An Overview of the National Flood Insurance Program in Washington, DC
DownloadKey Findings
- Flood insurance is available to residents of Washington, DC primarily through the National Flood Insurance Program.
- Flood risk extends beyond the 100-year floodplain and many residential properties exposed to flooding are not insured.
- Residential flood risk in the District is concentrated in areas of high social and economic vulnerability. These households may need financial assistance in order to afford the costs of flood insurance.
1. Overview of the National Flood Insurance Program
The National Flood Insurance Program (NFIP), housed in the Federal Emergency Management Agency (FEMA), was created over fifty years ago to provide flood insurance to participating communities. Communities voluntarily join the program, adopting minimum floodplain management regulations, and then all residents become eligible to purchase flood coverage. The NFIP currently writes over 90% of all residential flood coverage nationwide.
Through the NFIP, owners of residential property can purchase up to $250,000 in building coverage and up to $100,000 in contents coverage. Renters can choose to purchase a contents-only policy. Owners of non-residential property (commercial and municipal buildings) can purchase up to $500,000 each of building and contents coverage.
The NFIP maps flood hazards on Flood Insurance Rate Maps (FIRMs). A key purpose of the maps is to delineate the Special Flood Hazard Area (SFHA), the area with at least a 1% chance of inundation each year– also called the 100-year flood– from a river overflowing it banks or high water driven by coastal storms. The SFHA comprises two zones: A zones and V zones. The District’s SFHA is only A zone. V zones are subject to storm-induced waves and occur in a narrow strip along the coast. The area outside the SFHA is referred to as the X zone. The X zone is divided into two categories: the shaded X Zone, which includes areas with at least a 0.2% chance of inundation each year (the 500-year floodplain), and the unshaded X zone, which includes areas with a minimal risk of flooding.
By federal legislation, purchase of flood insurance (an NFIP or equivalent private policy) is mandatory for any owner of property that is located in the SFHA and secured with a federally- backed loan or a loan from a federally-regulated lender. Purchase of flood insurance is a voluntary choice for everyone else.
2. Flood Risk in the District
Washington, DC faces three sources of flood hazard. First, the city faces riverine flooding when the Potomac River, as well as tributary streams, overflow their banks. Second, floods may result when water is pushed up the rivers during coastal storms; this is the primary flood hazard along the eastern shore of the Anacostia River. Third, the city can experience pluvial, or storm water, flooding when a rainfall event overwhelms tributaries and storm drainage infrastructure. Some tributary streams are buried and considered part of the storm drainage system. The likelihood and severity of flooding from each of these hazards is projected to increase with changing storm patterns, increasingly intense rainfall events, and rising sea levels.
The District FIRM, shown in Figure 1, was updated in 2010 and shows the SFHA and the extent of the 500-year floodplain. Of note, FEMA FIRMs tend not to depict flood hazards from intense rainfall events, so they do not show all sources of flood risk. They also may not have the most up-to-date data, particularly in areas where flood risk is changing rapidly from climate changes and/or development.
Figure 1. Special Flood Hazard Areas in Washington, DC
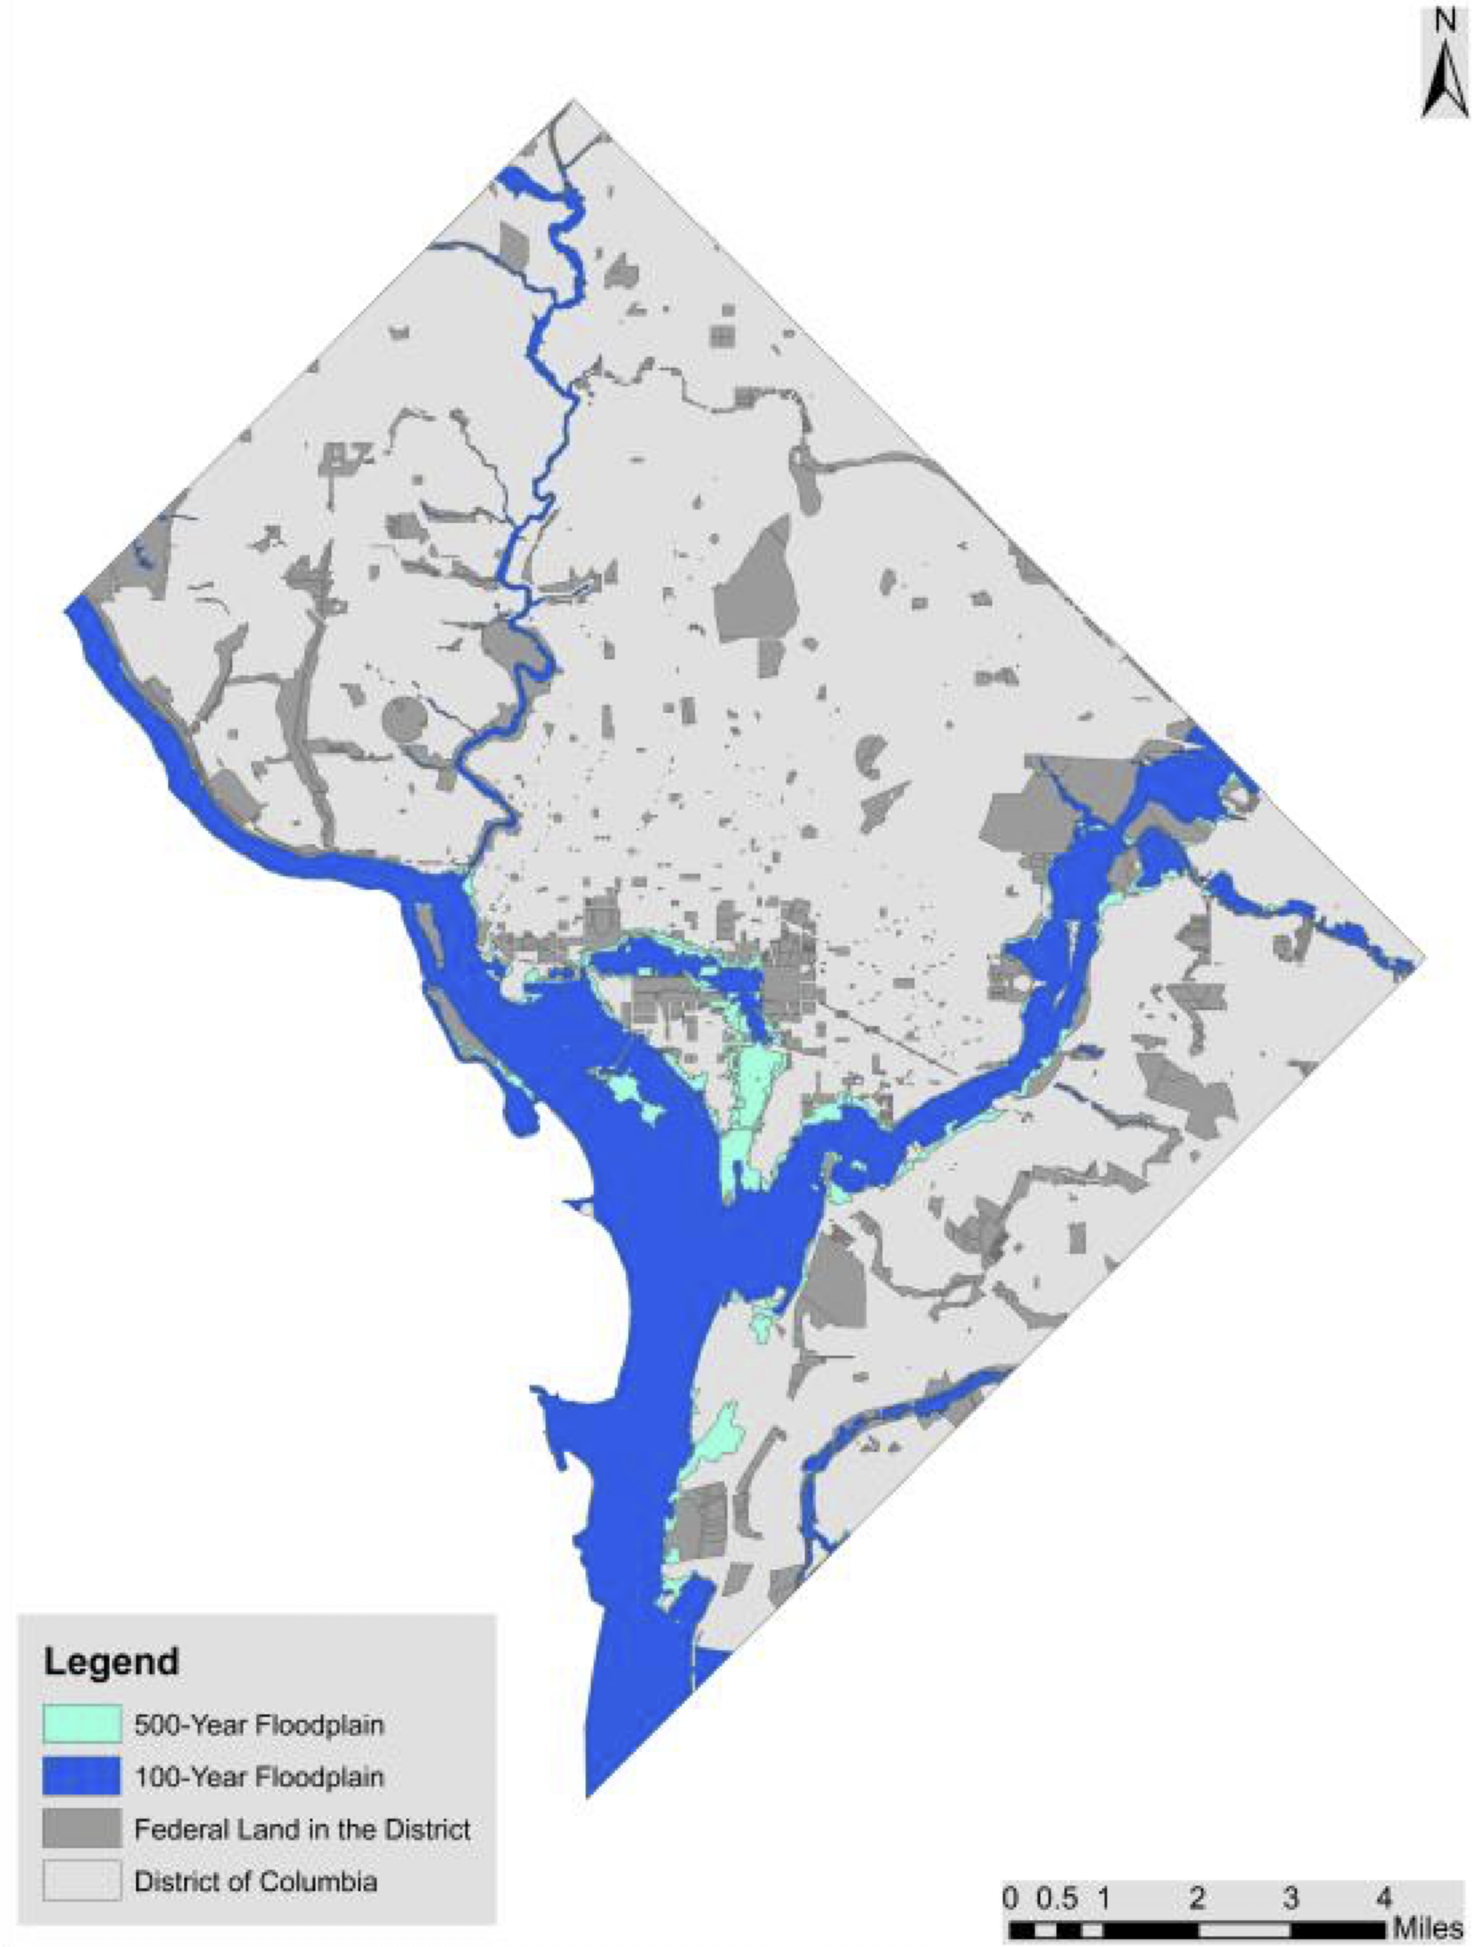
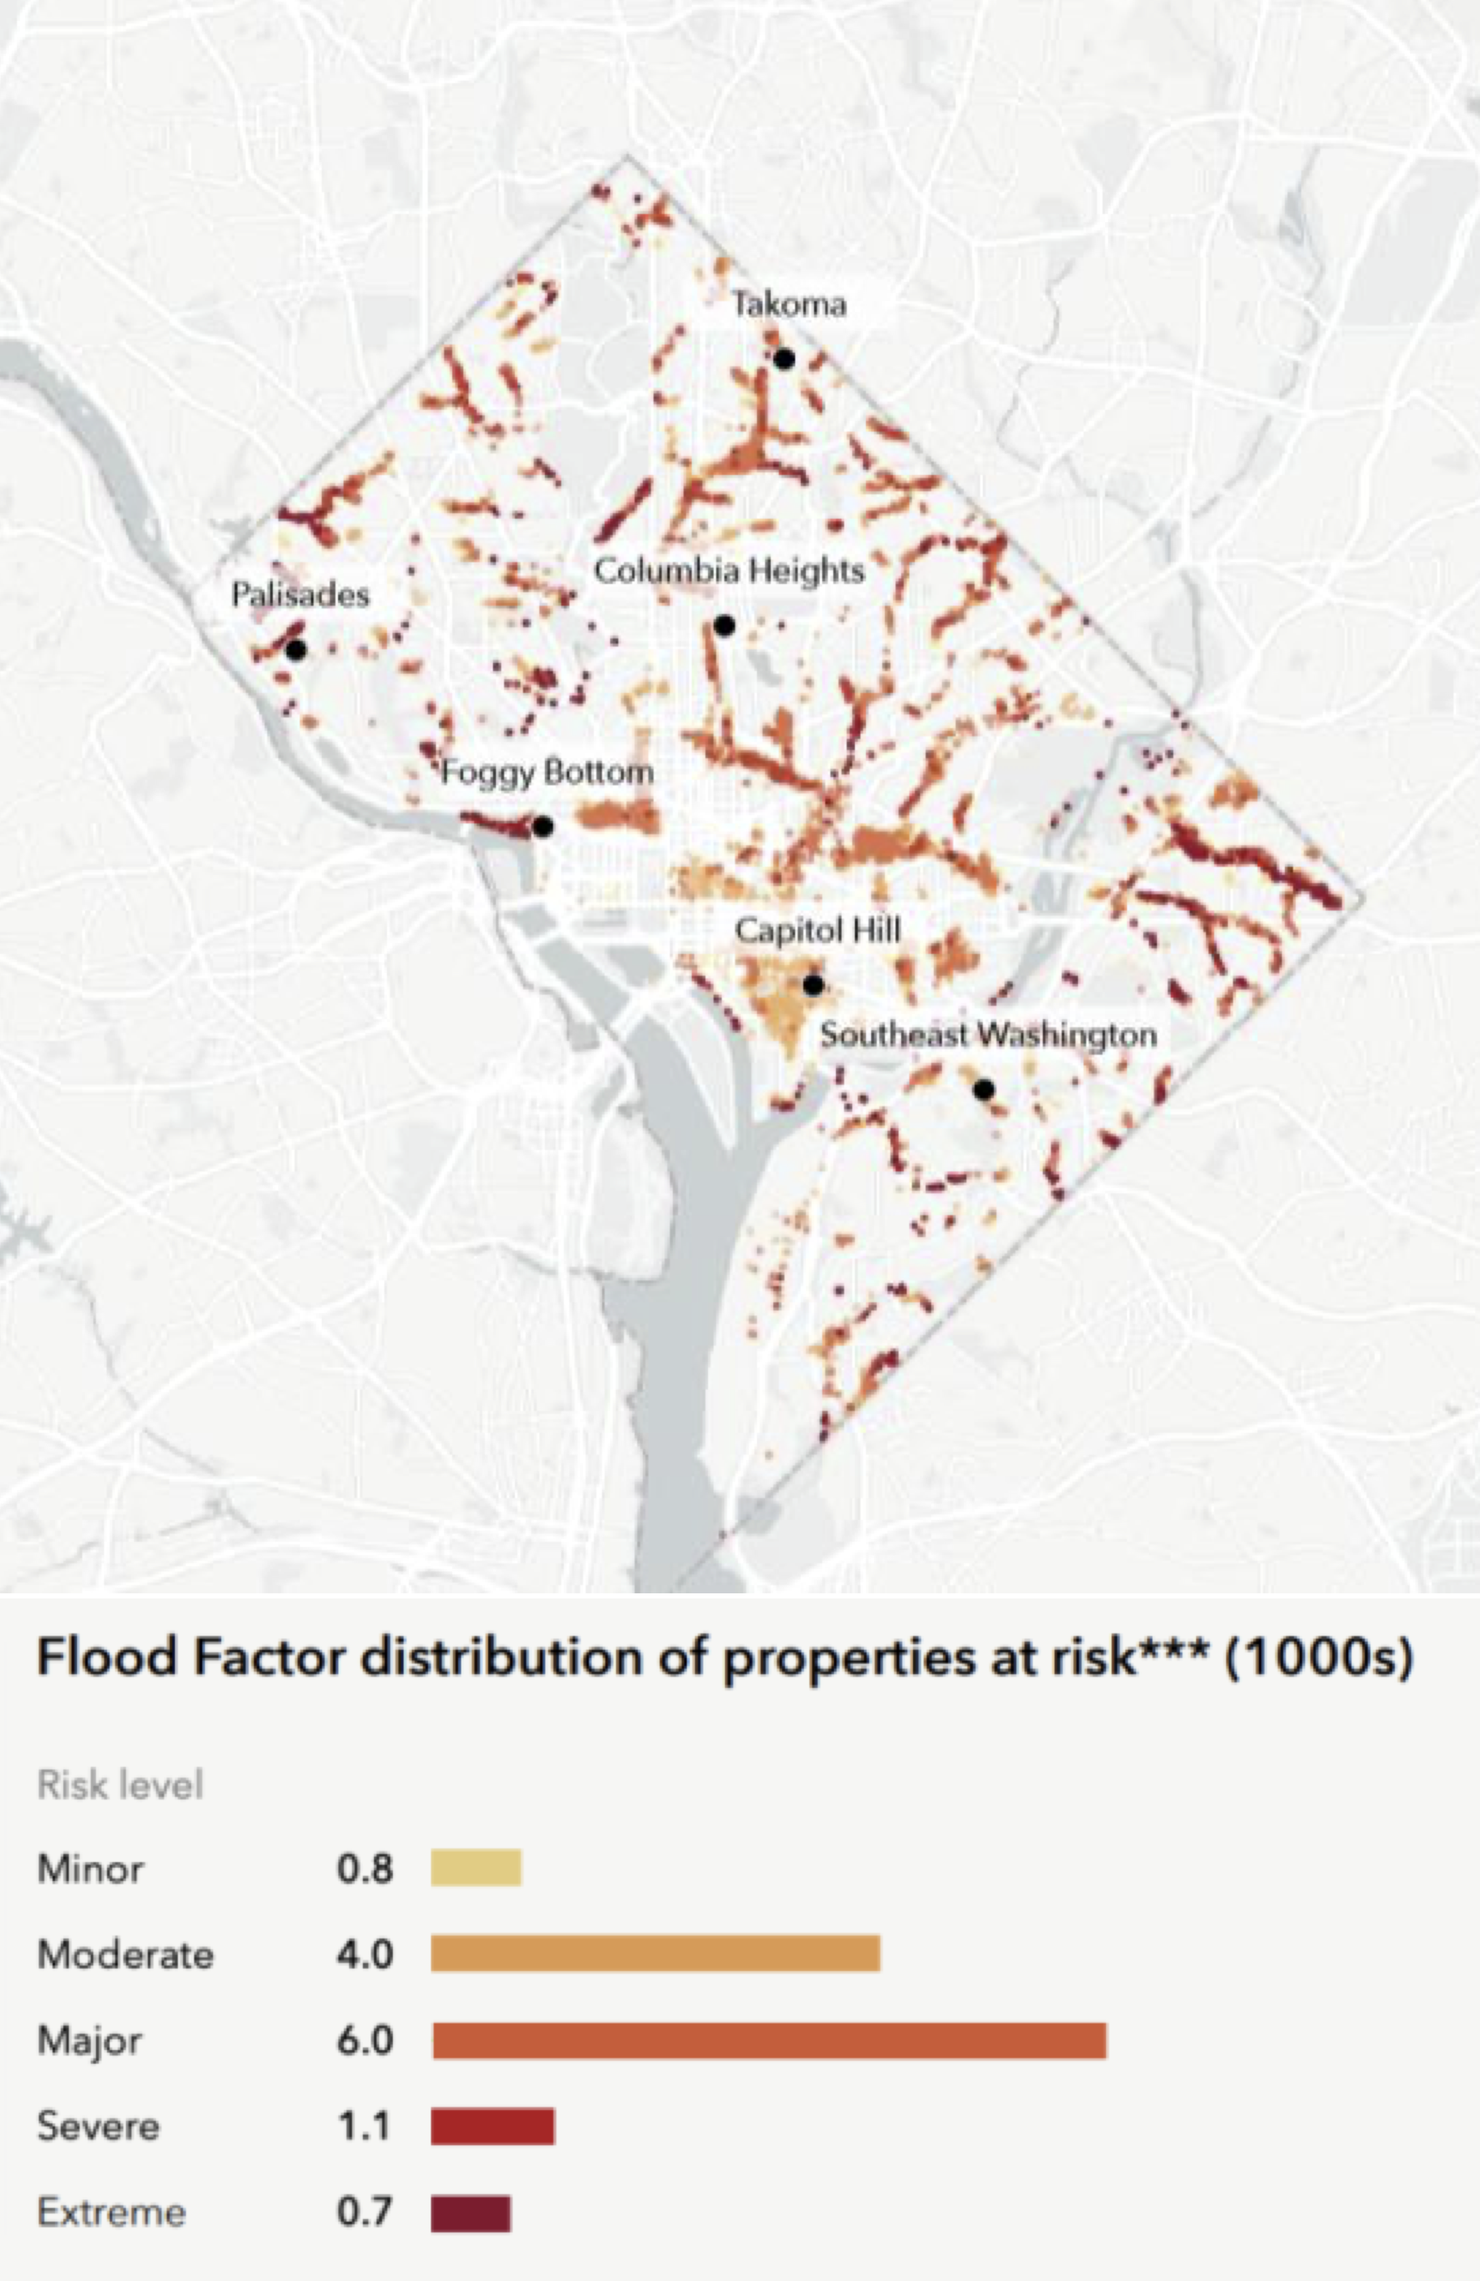
Figure 2 shows another depiction of flood risk in the District using the property-level Flood Factor score from the First Street Foundation. The Flood Factor is a 1-10 score based on national probabilistic flood modeling that includes four sources of flooding: riverine, tidal, pluvial (rainfall), and coastal storm surge. The Flood Factor links the probability and depth of flooding to a 1 through 10 score that increases with either depth or likelihood that the property will be inundated. Scores of 2 are considered minor risk, scores of 3 and 4 are coded as moderate risk, scores of 5 and 6 as major risk, scores of 7 and 8 as severe risk, and a score of 9 or 10 is coded as extreme flood risk. Figure 2 depicts the Flood Factor scores for the District, highlighting that flood risk in Washington, DC exists well outside the SFHA. It also highlights variations of flood risk within the SFHA.
Figure 2. Flood Factor Scores in Washington, DC
As seen in both figures, there are a few “hot spots” of flood risk in the District. Much of the land surrounding the National Mall was once marshland, now filled, but still at heightened risk of flooding. A levee along the Potomac River with a closure gate at 17th Street limits flooding along Constitution Avenue and the Federal Triangle area. However, this low-lying area of the city is still at risk when storm water flows overland from higher locations toward the Mall. The Federal Triangle area most recently experienced severe floods in 2006 and again in the summer of 2019. The commercial area along the Potomac at the Georgetown waterfront also has the potential for significant flood risk, but that risk is mitigated by flood walls that can be raised in anticipation of high river flows. In 2011, however, a failure to anticipate flooding and deploy these protective structures resulted in significant flood damage.
Pluvial, or rainfall-related flood risk, occurs in low areas and along many tributaries, partly attributable to limited capacity of the storm drainage network. In fact, one-third of the DC sewer system is a combined storm/sewer system exacerbating interior storm water flooding. In 2012, a heavy rainstorm flooded basements and streets in the Bloomingdale neighborhood. In 2016, another rainstorm caused flooding in the Cleveland Park metro station. Most recently, on September 10, 2020, three inches of rain fell over portions of the District in less than two hours, causing flooding in multiple neighborhoods. Based on post-event canvassing data from the District’s Homeland Security and Emergency Management Agency, more than 240 residents reported some damage following the storm, and 105 residents specifically reported “major” damage. Reported consequences of the flood included standing water, standing sewage, residual sediment, damaged flooring, wet drywall, damaged utilities, and mold growth. Flood risk will be reduced at some of the most flood-prone areas with completion of several new storm water projects now underway.
The residential areas with the greatest exposure to river-related flooding are in Wards 7 and 8, situated east of the Anacostia River. These two Wards contain over 90% of all single-family homes in DC’s 500-year floodplain and approximately 99% of all the single-family homes in DC’s 100-year floodplain. They also contain concentrations of multi-family housing in the 100-year floodplain (See Table 1). These communities are some of the most economically vulnerable. Data from the American Community survey indicates that in Wards 7 and 8 the average adjusted family income is $62,281 and $52,422, respectively--compared to the entire District’s average of $139,260. The wards are over 90% African American, compared to less than half in the city overall. Approximately 66% of housing units in Census tracts that include the flood-prone areas of Wards 7 and 8 are rented, and over 55% of the households in those areas are paying rent that exceeds the 30% of gross household income that HUD defines as affordable housing.

3. Demand for Flood Insurance
As of January 2021, there were 2,068 NFIP policies-in-force in Washington, DC, representing $534,793,900 in total coverage. Approximately 85% of policies are for residential properties. As shown in Figure 3, the total number of NFIP policies in DC declined between 2015 and 2016 and again slightly between 2018 and 2019. While the absolute numbers are fairly low, the District also has a lower number of properties in the SFHA. FEMA estimates that 50% of DC properties in the SFHA have flood insurance, a take-up rate that is higher than the national average of a bit more than one-third.
Notably, around 83% of flood insurance policies in the District are for properties in the X zone, meaning that only 17% of all NFIP polices are in the SFHA, the area FEMA designates as higher flood risk, and many of those may be the result of the mandatory purchase requirement. Outside the SFHA, policies are voluntarily purchased, suggesting those residents are aware of flood risk beyond the SFHA and thus voluntarily choosing to insure. The overwhelming majority of all policies are building policies or building and contents policies; the Department of Energy and the Environment estimates that only around 1% of policies are contents-only policies for renters.
Figure 3. NFIP Policies-in-Force in DC by Year

4. Cost of Flood Insurance
Currently, the NFIP quotes premiums based on flood zone and by certain characteristics of the structure. Premiums are higher in the A zone than in the X Zone. Premiums in the A Zone are lower when homes are elevated. Within the X Zone, property with a favorable loss history can qualify for a Preferred Risk Policy (PRP), which tends to be less expensive. The average premium for A zone policies in DC is around $3,000 and the average X Zone premium is roughly $430. The average PRP premium is lower, at $350.
Starting in the fall of 2021, the NFIP will be updating its approach to setting premiums through an effort referred to as Risk Rating 2.0. FEMA will replace its zone-based rating, making use of new tools—such as catastrophe models—to generate premiums that better reflect the likelihood of flooding and expected claims for individual properties. One effect will be to remove the sharp drop in charged premiums for properties that are located just outside the SFHA. The new rating also will account for home value, which will help correct a regressive cross-subsidy by which low-value homes are currently paying too much and high-value homes too little. When Risk Rating 2.0 is adopted, properties with a lower premium will see an immediate price decrease, while properties that see an increase will have that phased in over time subject to Congressional caps on rate increases of 18% per year for primary residences and 25% per year for commercial properties.
5. Flood Claims
While the District has experienced multiple floods over the years, flood claims reflect only the damage to properties that were covered by flood insurance at the time of the flood. As of January 2021, NFIP claims have been filed in the District 440 times, for a total of $4,612,920. Given the much higher take-up rates outside of SFHAs, it is perhaps not surprising that around 64% of all paid claims in DC have been in the X zone. Total claims paid for all policies (residential and commercial) are shown by year in Figure 4 and by census tract in Figure 5. The average paid claim over this time period is a little a bit less than $20,500. The total number of paid claims and paid losses by ZIP code in DC is given in the appendix.
Figure 4. NFIP Flood Claims by Year in Washington, DC
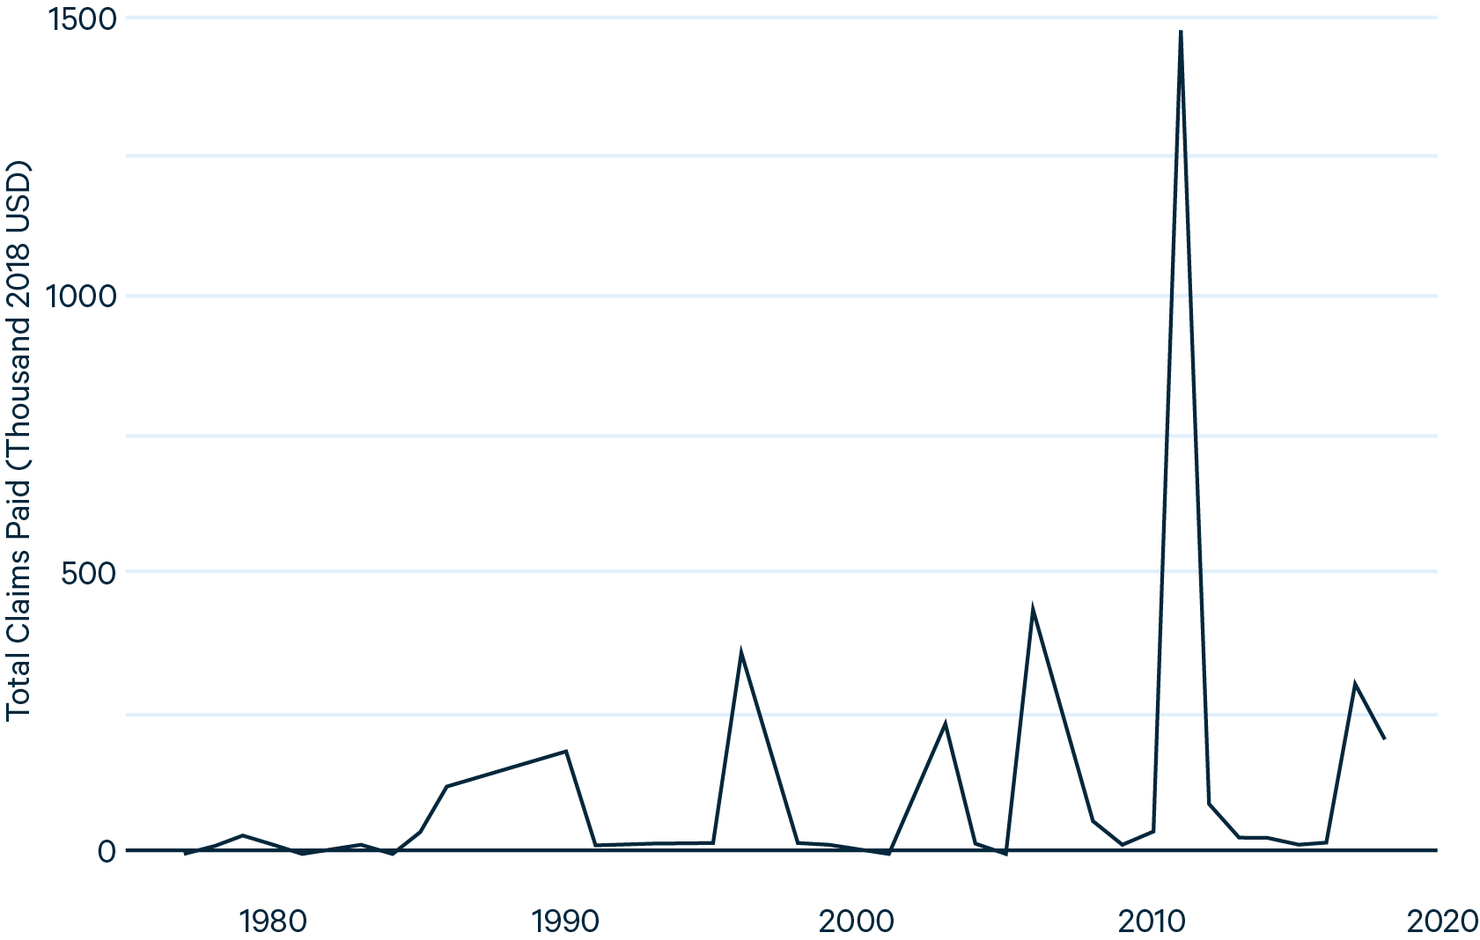
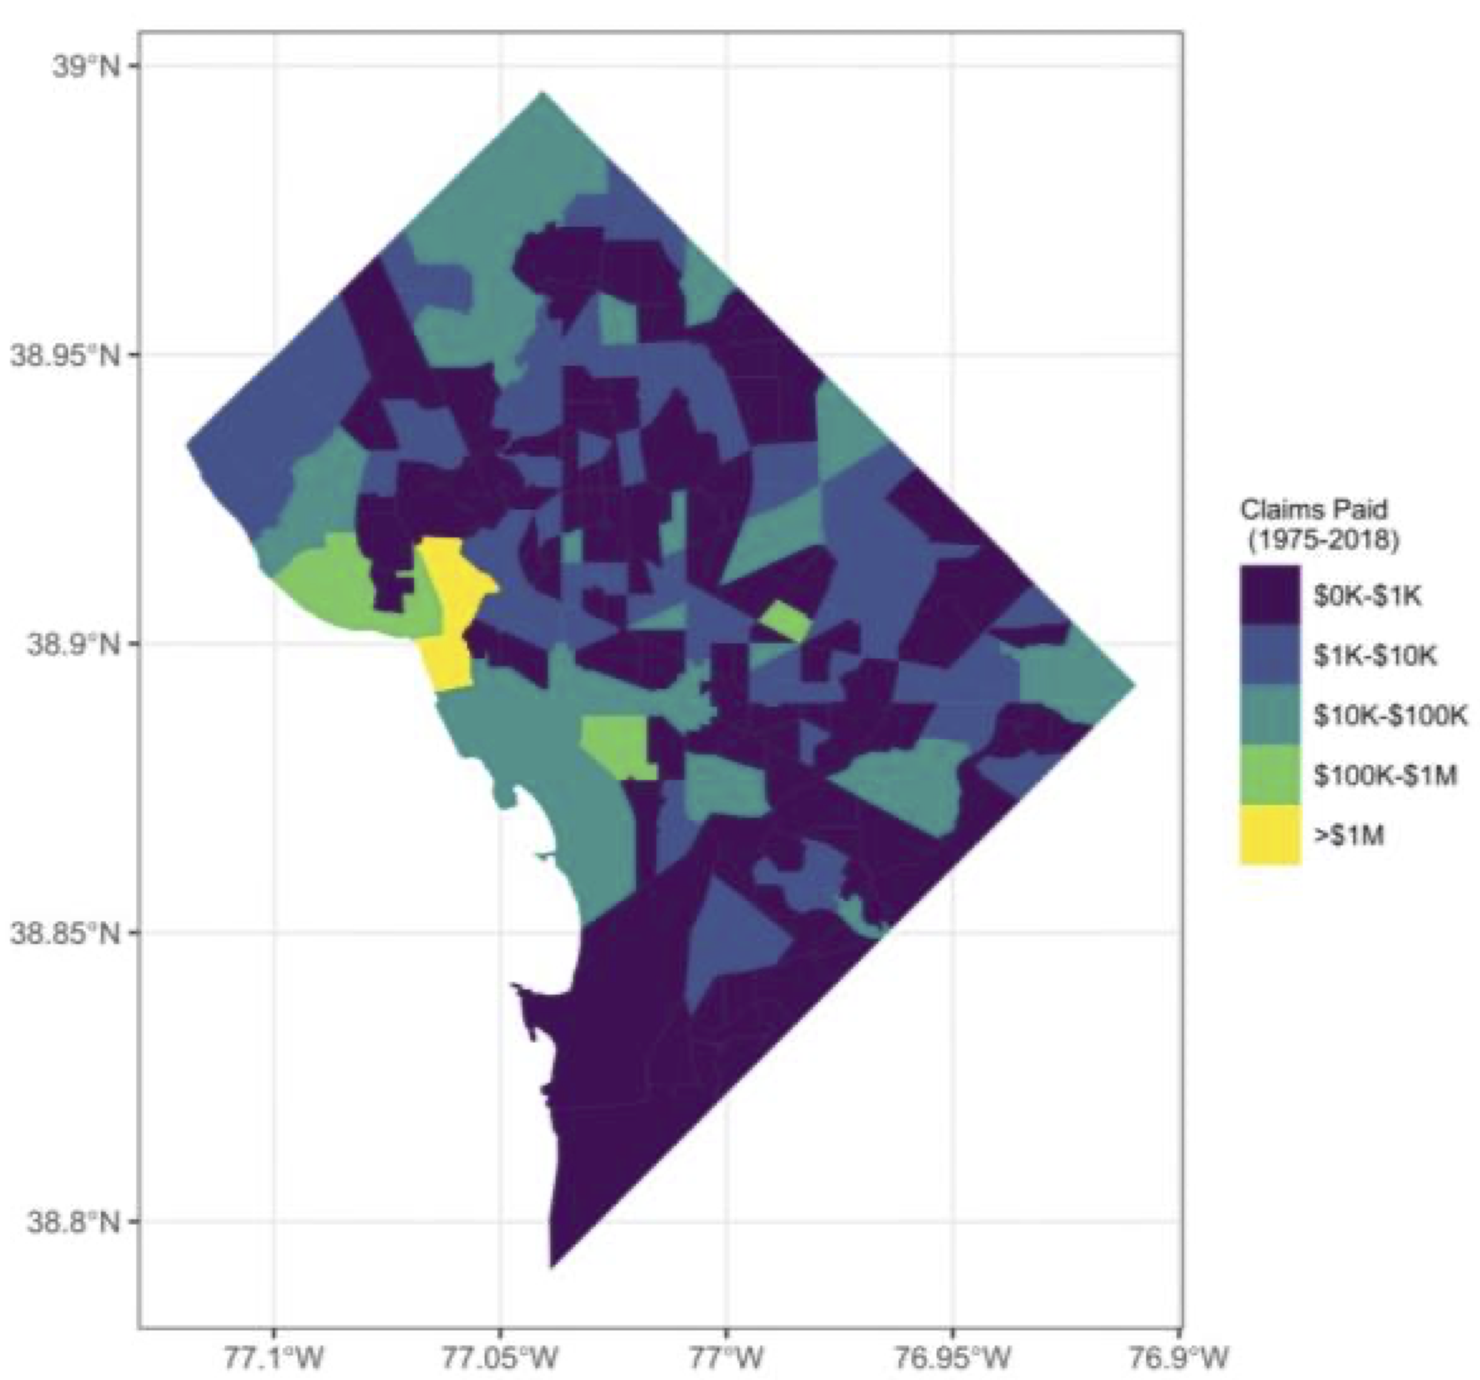
Figure 4 shows a spike in paid claims in 2011 and Figure 5 shows a “hot spot” for claims in Georgetown from the 2011 flood events. Heavy rains led to a 10’ rise in the river, which flooded Georgetown Harbor when there was a delay in raising the flood walls. This is a largely commercial area, explaining why most NFIP claims in DC have been for commercial properties. Claims elsewhere in the District have been lower, partially explained by small absolute numbers of NFIP policies, as well as by the lack of large-scale flooding of residential properties to date.
Figure 5. Cumulative Claims Paid by Census Tract, 1975 to 2018
6. The Future of Flood Insurance in the District
A robust body of research suggests that those with insurance recover more completely and more quickly post-disaster than those without insurance. Yet, while Washington, DC faces several sources of flood risk and that risk is growing as the planet warms, current purchases for NFIP flood insurance are low and have fallen since a high in 2015. There are a number of challenges to increasing NFIP purchases in the city. First, understanding of flood risk and how it is evolving may not be widespread. The city is actively improving outreach and making more resources available for residents to understand their flood risk, particularly as it extends beyond the SFHA. Second, premiums for flood insurance may exceed what households are willing or able to pay. Risk Rating 2.0 might accelerate declines in coverage if premiums in what is now defined as the X zone increase. Conversely, where prices fall, demand may rise. The District will need to add outreach about Risk Rating 2.0 to its developing flood risk communication efforts. Meanwhile, limits on the ability to pay NFIP premiums will continue in Wards 7 and 8. Various federal policy options to help with affordability have been suggested by FEMA and researchers, but none have been adopted federally. Local policy options are also possible, from property-tax rebates, to insurance consultations, to a direct subsidy. More innovative options could explore community-based insurance or microinsurance policies.
When considering broader flood resiliency, insurance plays an important role in guaranteeing financial resources for recovery. This can be especially important for more localized flood events that would not be severe enough to lead to federal disaster aid. Another challenge, especially in Wards 7 and 8, is securing the post-flood resiliency of renters. If landlords offering affordable rental property are not insured, they may not be able to repair or replace affordable housing damaged by flooding. Policies aimed at expanding flood take-up rates, therefore, should also investigate whether landlords have sufficient coverage.
Note
This issue brief was originally published by the former University of Pennsylvania Wharton Risk Management and Decision Processes Center, which was replaced by the Wharton Environmental, Social and Governance Initiative in 2022. https://esg.wharton.upenn.edu/. This issue brief is being republished by Resources for the Future by the author(s).


