Two Key Design Parameters in Clean Electricity Standards
An illustrative, simulation-based comparison of proposed carbon intensity benchmarks and target escalation methods
Summary
A clean electricity standard, more commonly called a clean energy standard (CES), can serve as a transformative policy in the electricity sector to deliver significant emissions reductions. Depending on its design, the economic efficiency of emissions reductions under a CES can approach that of a power-sector-only carbon emission pricing policy. Two important design considerations under a CES are (1) the emissions intensity benchmark used to calculate clean energy credits earned by a given electricity generator (and that inherently determines generator eligibility under the policy); and (2) the escalation method of clean energy targets over time.
In this issue brief, we employ a power sector simulation model, E4ST, to explore effects of different choices of these two design parameters —reflecting options contained in proposed legislation and under consideration for forthcoming legislation— on power sector greenhouse gas (GHG) emissions, generation, electricity prices and societal benefits and costs, including climate and health impacts from air pollution. Specifically, we compare the effects of the emissions intensity benchmarks and escalation methods in the Clean Energy Standard Act of 2019 (CESA 2019) with those under consideration in the discussion draft of the CLEAN Future Act. CESA 2019 uses a lower benchmark emission rate that does not allow for partial clean energy credits for natural gas generation without carbon capture technology. It also implements a tailored, tiered set of target escalation rates. The draft CLEAN Future Act would use a higher benchmark emission rate that allows partial crediting for natural gas and would employ a uniform linear escalation rate of targets from current clean generation percentages to 100% of retail sales by 2050. We also consider additional cases reflecting the other two combinations of these design choices.
The modeling simulations discussed in this brief are intended to be illustrative and explore the relative tradeoffs of changing the benchmark emission rate and escalation method each in isolation. Importantly, though the simulations reflect certain aspects of CESA 2019 and the CLEAN Future Act discussion draft, they do not account for all of their features. Both have additional features that would affect emissions and the composition of the power sector.
We observe the following general effects of modifying the benchmark emission rate and the credit requirement escalation method:
Carbon Emissions Intensity Benchmark for Crediting
- A benchmark emission rate above typical emission rates of natural gas-fired generators distinguishes between natural gas and higher-emitting sources by providing natural gas-fired generation with partial credits. The 0.82 metric tons / MWh benchmark in the CLEAN Future Act discussion draft is an example.
- Providing partial credit to natural gas-fired generation still reduces natural gas use compared to a current policies baseline, but results in more natural gas use and less coal use than an otherwise identical CES with a benchmark that is low enough to preclude natural gas (without carbon capture) from earning credit (e.g., 0.4 metric tons / MWh benchmark as in CESA 2019).
- By reducing coal-fired generation more, the higher benchmark reduces sulfur dioxide and nitrogen oxide emissions, and consequently premature mortality, more than the lower benchmark.
- Holding the clean energy target constant, the higher benchmark results in less GHG emissions reductions than the lower benchmark due to more natural gas generation.
- Under the higher benchmark, the target can be increased to match GHG emissions under the lower benchmark. The resulting policy reduces emissions at lower cost and produces larger air quality benefits, compared to the policy with the lower benchmark. It does so by incentivizing more sources of low-cost emissions reductions (e.g., replacing coal with natural gas rather than just replacing natural gas and coal with non-emitting generation).
- For a given emission quantity under a CES, the natural gas generation industry would be larger under a higher benchmark. This could increase the risk that the natural gas industry would secure changes to the CES that make it less stringent than planned.
Clean Energy Target Escalation Method
- Holding the benchmark emission rate constant, the CESA 2019 target escalation method yields higher targets on average than the linear escalation in the CLEAN Future Act discussion draft, through approximately 2040. Higher targets require a larger number of clean energy credits to be surrendered. All else equal, they are associated with lower emissions.
- From approximately 2040 through 2050, the linear escalation targets are on average higher, as targets reach 100% of retail sales by 2050 under the draft CLEAN Future Act but not necessarily under the CESA 2019 method.
- The linear escalation under the draft CLEAN Future Act can yield higher targets in every year for electricity suppliers with particularly carbon-intensive baseline portfolios, as the starting target is low and must rise more rapidly to 100% by 2050.

Introduction
On January 28, 2020, the House Energy and Commerce (E&C) Committee released a discussion draft legislative framework for the Climate Leadership and Environmental Action for our Nation’s (CLEAN) Future Act — a collection of policies that together aim to achieve a 100% clean US economy by 2050. The release marks an important milestone in the development of the Committee’s legislation, which comes after receiving stakeholder and expert feedback through a formal public request for information as well as through a set of oversight hearings at both the full committee and subcommittee level. Resources for the Future (RFF) experts engaged in this process formally by submitting comments and testifying before the Energy Subcommittee, as well as through a number of informal consultations with staff and stakeholders.
One of the cornerstones of the E&C approach is a federal Clean Energy Standard (CES) that incorporates a stated goal of 100% clean electricity by 2050. A CES is a power sector only policy similar to a traditional renewable portfolio standard (RPS), in which each year, retail electricity suppliers must account for a percentage of their sales from “clean” energy sources by turning in “clean energy credits” (CEC). CECs are awarded to clean generators (e.g. renewables, nuclear, fossil with carbon capture — depending on the policy’s definition of “clean”) for each megawatt-hour (MWh) of generation provided to the grid, and can be tradable in a national market (in the case of a federal program). The percentage requirement grows over time, thereby encouraging a transition to cleaner generation overall. For more background on CESs, see this RFF Issue Brief, and for additional key considerations in designing CESs, see RFF’s formal comments submitted to the US House of Representatives Select Committee on the Climate Crisis.
The discussion draft CLEAN Future Act draws from federal CES legislation introduced in May 2019 by Senator Tina Smith (D-MN) and Representative Ben Ray Lujan (D-NM) titled the Clean Energy Standard Act of 2019 (CESA 2019), as well as from forthcoming legislation currently under development by Representative Diana DeGette (D-CO).
RFF previously examined the projected effects of CESA 2019 using a detailed power-sector model (E4ST). The analysis projected that in 2035 the legislation would reduce emissions 61% relative to no additional policies, and 76% from 2005 levels.
The CLEAN Future discussion draft proposes changes from CESA 2019 for two important policy design features: (1) the emissions intensity benchmark used to calculate clean energy credits earned by a given electricity generator (and that inherently determines generator eligibility under the policy); and (2) the escalation method of clean energy targets over time. Given sufficient interest to decisionmakers and other stakeholders, we offer a preliminary, illustrative analysis to explore effects of these decisions on emissions reductions and other future outcomes in the power sector.
Carbon Emissions Intensity Benchmarks for Crediting
An important consideration in a CES design is what sources will be eligible to earn credits for compliance — i.e. which sources are considered “clean.” A key parameter that determines which sources are eligible for crediting is the carbon emissions intensity benchmark, where sources with carbon emission rates below the benchmark earn partial or full credits for their clean generation, proportional to how far below the benchmark they are, with zero-emitting sources receiving a full credit. All sources above the benchmark, however, do not earn credits and are thus treated identically, regardless of how much above the benchmark they are. For example, a high-emitting coal facility would be treated the same as a cleaner natural gas combined cycle facility, as long as both had emission rates above the benchmark.
The two emissions intensity benchmarks from CESA 2019 (0.4 CO2-equivalent metric tons / MWh) and the draft CLEAN Future Act (0.82 CO2-equivalent metric tons / MWh) are illustrated in Figure 1 in the context of the emission rates of generators projected to exist in 2035 under current policies. Importantly, under these policies and in the following modeling exercise, these CO2-equivalent emission rates include upstream methane emissions from natural gas and coal consumption in addition to smokestack carbon dioxide emissions. [1] As a generator only receives credits if its emission rate is below the benchmark, CESA 2019 effectively excludes any natural gas sources that do not have carbon capture and storage. With a higher benchmark in the CLEAN Future discussion draft, much of the natural gas fleet is eligible to earn partial credits. We investigate the implications of choosing one of these benchmarks rather than the other.
Figure 1. CO2-Equivalent Emission Rates of Generators Compared with Two Proposed CES Benchmarks
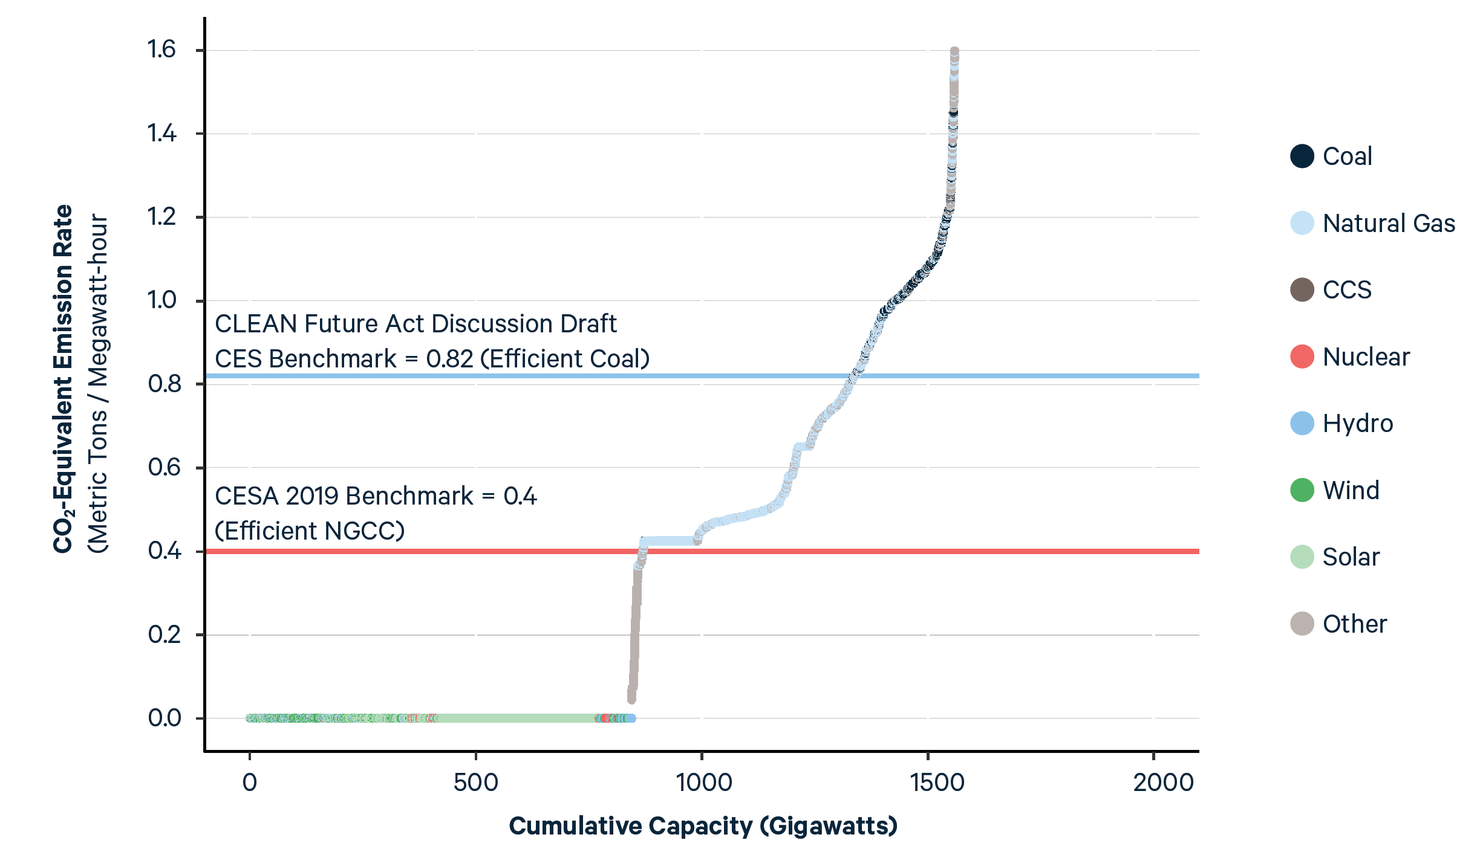
Under either benchmark, as the targets approach 100%, the percentage of emitting generation allowed to remain in the system diminishes substantially. To satisfy a requirement of 100% clean sales under both CESA 2019 and the CLEAN Future discussion draft will require a nearly fully decarbonized system. However, the requirement is applied to retail sales, and so even under a 100% requirement the amount of generation lost during transmission and distribution is not covered by the policy target and can come from emitting sources. Furthermore, if the US were to become an exporter of electricity and neighboring countries were not to impose a similar requirement, that too could contribute to continued US emissions. Hypothetically in an isolated system, in which the policy applied to generation rather than sales, a 100% target would yield zero emissions regardless of the benchmark selected.
Clean Energy Target Escalation Methods
Under both CESA 2019 and the draft CLEAN Future Act, each retail electricity supplier must increase its clean energy sales on a percentage basis year over year, starting from its own historical baseline level of clean sales. [2] Under the draft CLEAN Future Act, the requirement for each supplier simply increases linearly from its 2022 baseline level to 100% by 2050. CESA 2019 implements a tailored, tiered approach in which the rate of annual escalation is delineated between large and small retail electricity suppliers as follows: the clean energy compliance requirement for a given retail electricity supplier with annual retail sales above 2 million MWh escalates by 2.75% per year until it reaches 60%, then by 1.75% per year until the compliance target reaches 90%. Beginning in 2040, for such retail electricity suppliers that have reached targets of 90%, the percentage requirement increases by 1% annually until it reaches 100%. Retail electricity suppliers with initial annual retail sales less than 2 million MWh have a compliance obligation that escalates by 1.5% per year to a maximum of 90%. After 2040, small retail electricity suppliers that had reached a 90% obligation would have their percentage requirement increased by 1% annually.
Figure 2. Effect of Escalation Method on Approximate National Average Percentage Targets Assuming 0.82 Metric Tons / MWh Benchmark
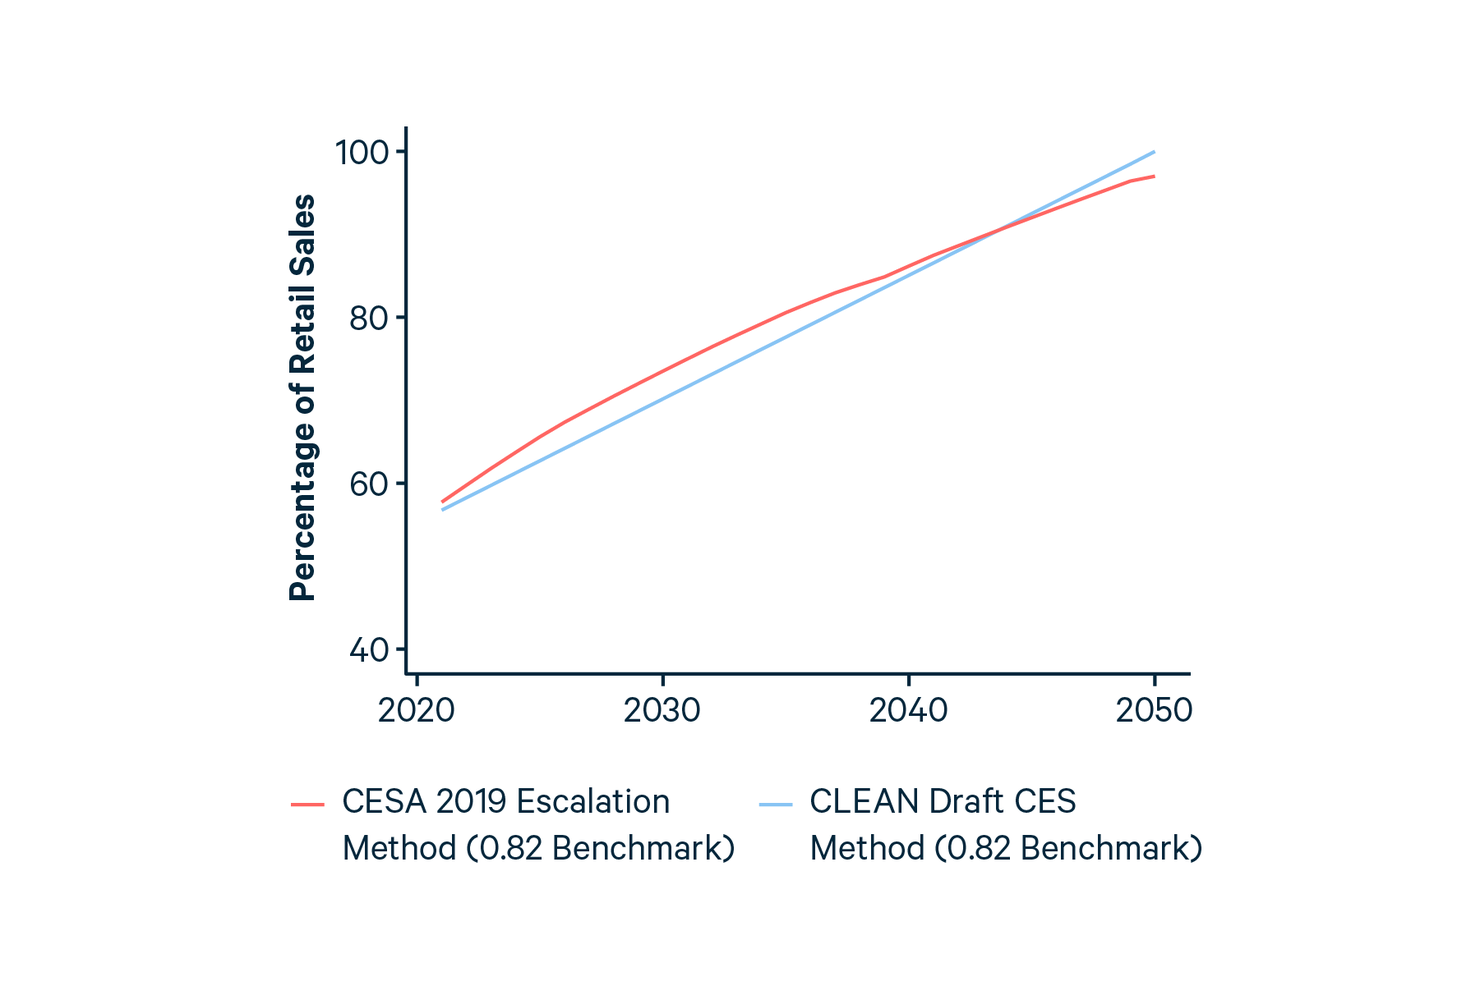
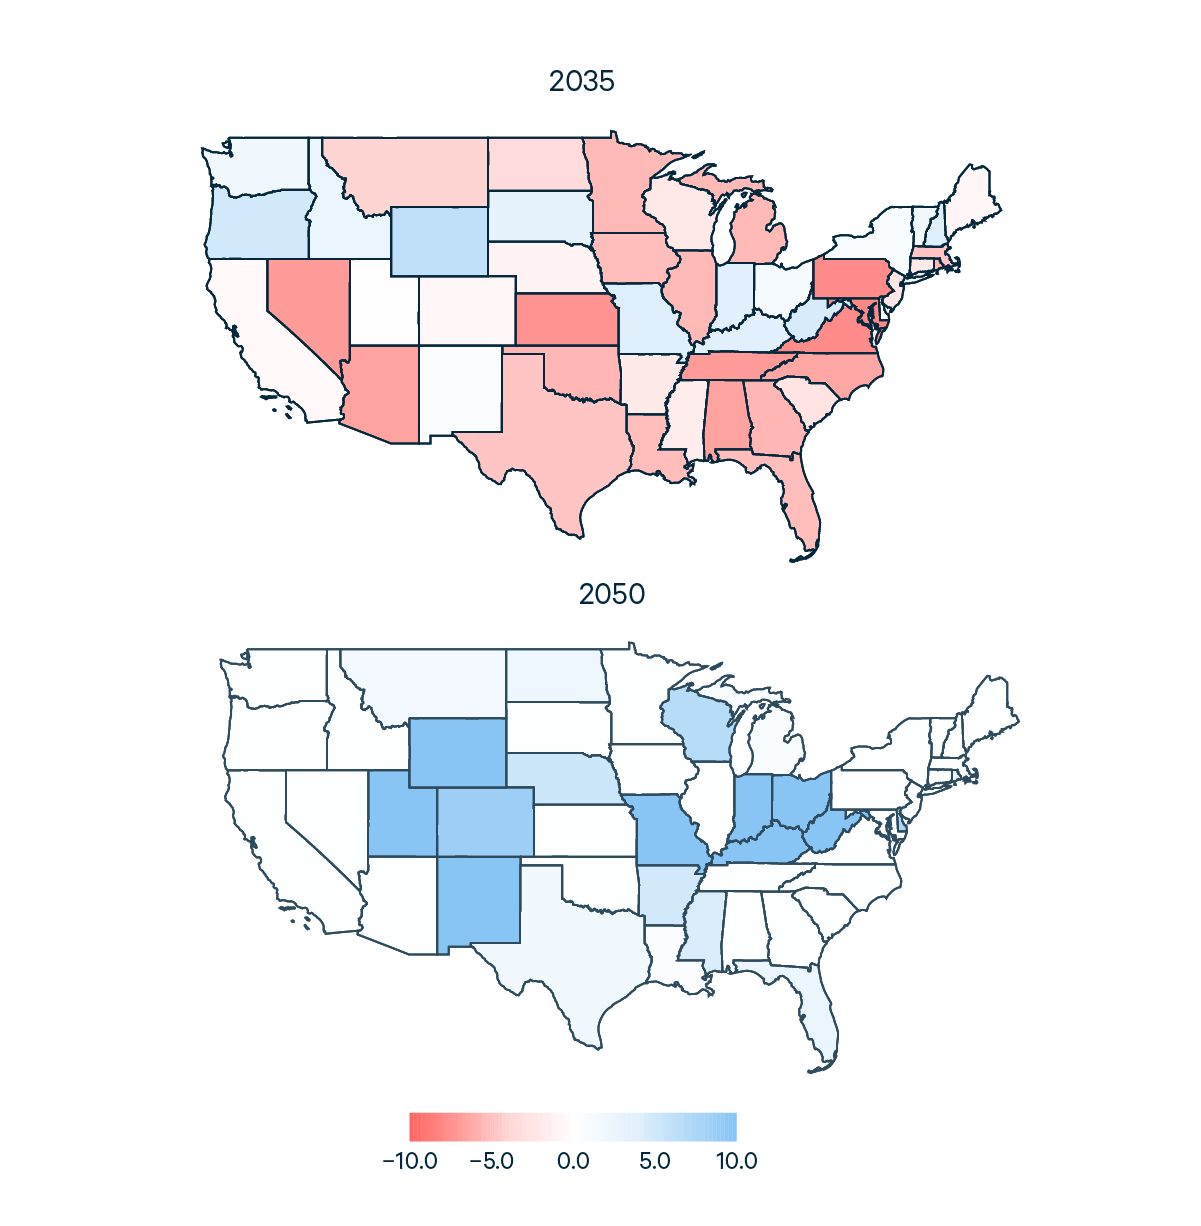
Figures 2 and 3 compare the two escalation approaches, assuming the same emissions intensity benchmark of 0.82 metric tons / MWh in both sets of targets in order to offer an apples-to-apples comparison, since the benchmark affects the starting clean percentages. Note that the targets from CESA 2019 reflecting the benchmark of 0.4 would be lower, due to lower starting percentages (see Figure 4). Furthermore, we assume the starting baseline clean percentage in 2019, using data available, and begin escalation of the targets in 2020. While targets using the method from the CLEAN Future discussion draft reach 100% of retail sales by 2050, the targets using the method from CESA 2019 are higher on average across the nation through approximately 2040 (Figure 2). The effect, however, varies regionally, as demonstrated by state level averages shown in Figure 3, which shows the difference between the CLEAN Future discussion draft targets and the CESA 2019 method-based targets (with a higher 0.82 benchmark): a blue shade means CLEAN Future discussion draft target escalation method is more stringent, while a red shade means the CESA 2019 method is more stringent, as of 2035. By 2050 under the CESA 2019 method, targets in some but not all states reach 100% of retail sales. Under the CLEAN Future Act discussion draft, states starting with lower targets (reflecting a relatively higher emission baseline portfolio) experience a faster rate of escalation to reach 100% by 2050.
Figure 3. Effect of Escalation Method on Approximate State Average Percentage Targets: CLEAN Future Act Method-Based Targets minus CESA 2019 Method-Based Targets
Scenarios Modeled
We employ a detailed power system simulation model, E4ST, to explore the effects of the above design considerations in the year 2035. We model the following five scenarios, including a current policies case, two federal CES cases reflecting the emission rate benchmarks and target escalations of CESA 2019 and the draft CLEAN Future Act, and two additional federal CES cases reflecting the remaining two combinations of benchmarks and target escalation methods.
- CURRENT POLICIES: Business-as-usual reflecting current US policies (as of August, 2019).
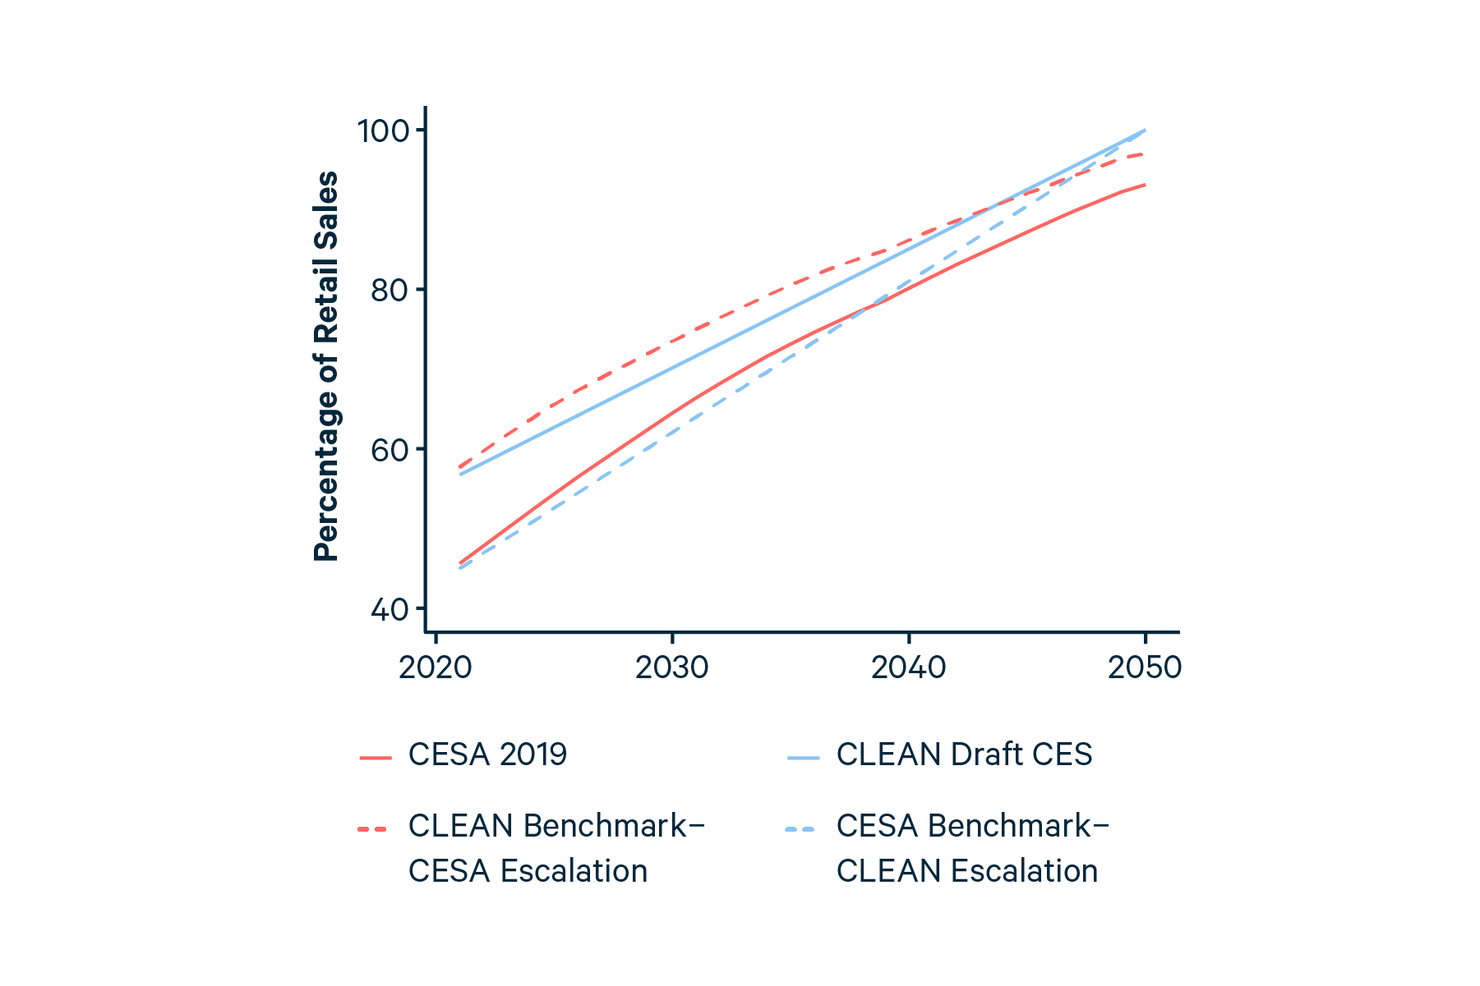
- CESA 2019: A federal clean energy standard representing features of Senator Smith’s and Rep. Lujan’s Clean Energy Standard Act of 2019: an emissions intensity benchmark of 0.4 CO2e metric tons / MWh (the approximate emission rate of an extremely efficient natural gas generator), and tiered target escalation rates (with a national average clean energy requirement of 74% in 2035).
- CLEAN Draft CES: A federal clean energy standard representing features of the discussion draft CLEAN Future Act CES: an emissions intensity benchmark of 0.82 CO2e metric tons / MWh (the approximate emission rate of an uncontrolled, ultra supercritical coal-fired power plant), and linear target escalation rates to 100% by 2050 (with a national average clean energy requirement of 78% in 2035).
- CESA Benchmark-CLEAN Escalation: A federal clean energy standard with an emissions intensity benchmark of 0.4 CO2e metric tons / MWh and linear target escalation rates to 100% by 2050 (with a national average clean energy requirement of 72% in 2035).
- CLEAN Benchmark-CESA Escalation: A federal clean energy standard with an emissions intensity benchmark of 0.82 CO2e metric tons / MWh and tiered target escalation rates (with a national average clean energy requirement of 81% in 2035).
Figure 4. National Average Percentage Targets for Scenarios Modeled
E4ST
The Engineering, Economic, and Environmental Electricity Simulation Tool (E4ST) is software built for benefit-cost analysis of policies, regulations, power infrastructure additions, and more. E4ST simulates in detail how the power sector will respond to such changes. It models successive multi-year periods, predicting hourly system operation along with generator construction and retirement, and various other outcomes. E4ST’s advantages over other models include its high spatial detail, its realistic representation of power flows and system operation, its integration of an air pollution and health effects model, its uniquely comprehensive benefit-cost analysis capabilities, its high-quality generator data, its inclusion of Canada, and its unique adaptability and transparency. E4ST has been used to analyze various policies and investments, including in projects for the US Department of Energy, the US Department of the Interior, the US Climate Alliance, and in independent analyses of proposed national and state policies by Resources for the Future. E4ST has been developed by researchers at Resources for the Future and Cornell and Arizona State Universities, with funding, input, and review by the Department of Energy, the National Science Foundation, the New York Independent System Operator, and the Power Systems Engineering Research Center. E4ST's current developers, at Resources for the Future, frequently add updates and features. More information is available at e4st.com.
Results
Under each policy considered, we assess effects on power sector generation mix, GHG emissions, electricity prices (wholesale and retail), health, and societal benefits and costs (welfare), including climate and health impacts from air pollution. We report results for the year 2035, in 2013 dollars.
In interpreting the results presented below, it is important to note that all models provide an imperfect approximation of the real world, and the scenarios do not precisely represent the full details of the policies discussed here. See the Caveats section for further detail.
Generation and GHG Emissions
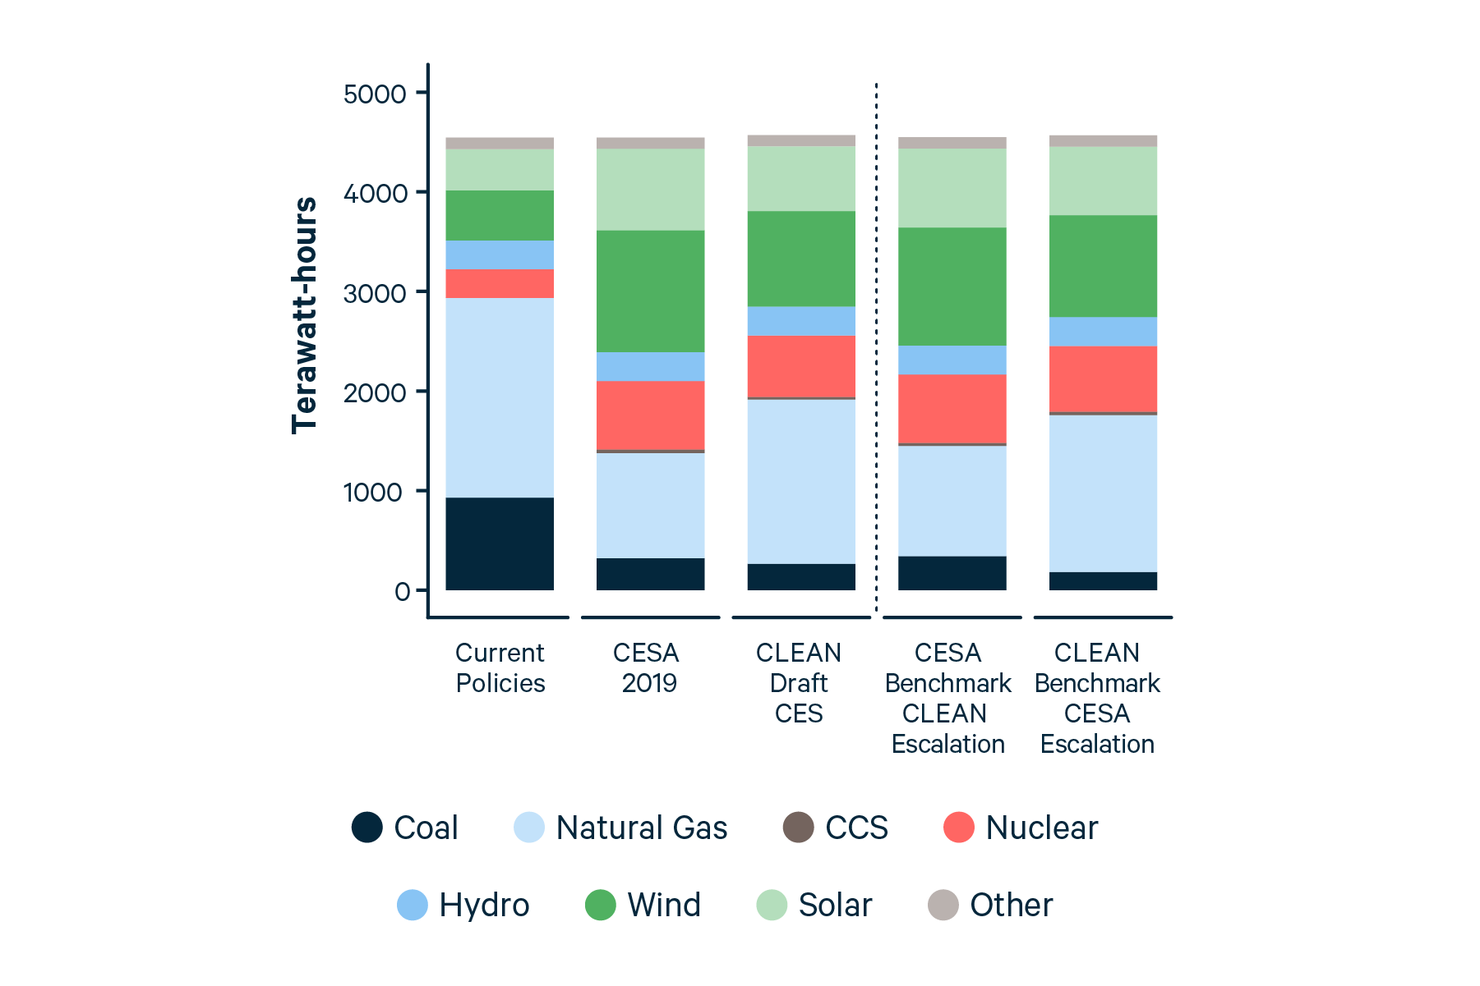
Figure 5 depicts the generation mix in each scenario in 2035. Relative to Current Policies, each policy promotes significant additions of wind and solar, and preserves a substantial amount of the nuclear fleet that may otherwise retire due to low electricity prices and unprofitability. However, there is a key difference in effects on coal and natural gas generation, driven most by the choice of benchmark. All four policies reduce coal and natural gas generation to some extent. However, the CESs crediting natural gas (through the higher 0.82 benchmark) disincentivize coal more than they disincentivize gas, and as a result produce greater reductions in coal generation but less reductions in natural gas generation compared to CESs not crediting natural gas. Under CESs not crediting natural gas, the lower natural gas generation is compensated mainly with more generation from wind, solar, and coal. Note that natural gas and coal generation sources equipped with carbon capture and storage technologies play a small role in achieving decarbonization under any case in this analysis.
Figure 5. US Annual Generation Mix, 2035 (Terawatt-Hours)
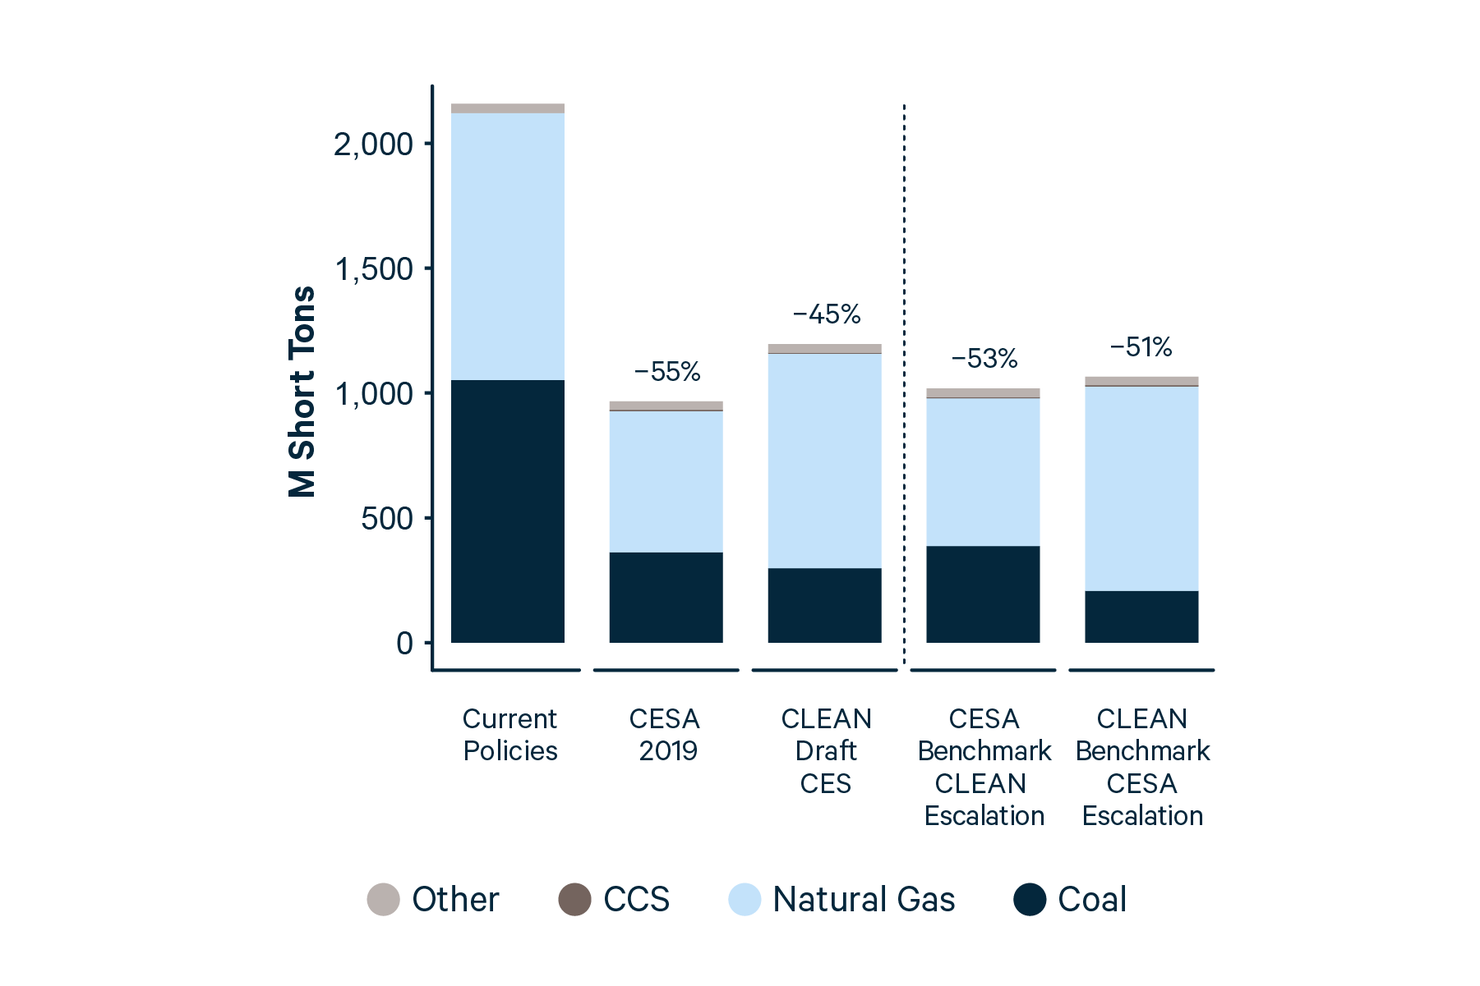
These effects on generation mix are also reflected in the greenhouse gas emissions mix. Figure 6 shows the CO2-equivalent emissions, taking into account CO2 and methane. Relative to Current Policies, CESA 2019 achieves the greatest 2035 CO2-equivalent emissions reductions (55%), reflecting the combination of excluding natural gas crediting and escalating the clean energy targets more rapidly in most states; both of these design choices, relative to the alternatives explored here, independently drive greater emissions reductions. The CLEAN Draft CES achieves the smallest 2035 emissions reductions, reflecting the lower targets and the higher benchmark allowing more emitting generation to qualify for crediting under the policy. When the CESA Benchmark is combined with the CLEAN Escalation, emissions reductions are lower relative to CESA 2019 simply due to the lower resulting CES target.
If the CLEAN Draft CES adopted the CESA Escalation, the higher target would drive greater emissions reductions relative to the CLEAN Future discussion draft CES, however the targets would need to be increased further in order to match the emissions reductions of CESA 2019 in 2035. This would result in the same amount of CO2-equivalent emissions as CESA 2019, but at lower cost because it would incentivize more low-cost means of reducing emissions. Specifically, it would incentivize emissions reductions by replacing coal-fired generation with natural gas-fired generation, not just by replacing gas- and coal-fired generation with non-emitting and very-low-emitting generation as in CESA 2019.
In summary, the same emissions reductions can be achieved with either a higher benchmark emission rate such as 0.82 or a lower one such as 0.4. With a given emission rate benchmark, the CESA Escalation results in lower emissions in 2035 than does the Escalation in the draft CLEAN Future Act. For a given set of percentage targets, the draft CLEAN Future Act’s 0.82 emission rate benchmark results in higher emissions than does CESA’s 0.4 benchmark, but that can be offset by increasing the clean percentage targets used in conjunction with the 0.82 benchmark, which would result in equal CO2-equivalent emissions but at lower cost.
Figure 6. US Annual Power Sector Greenhouse Gas Emissions Mix, 2035 (Million Short Tons of CO2-Equivalent)
Electricity Prices
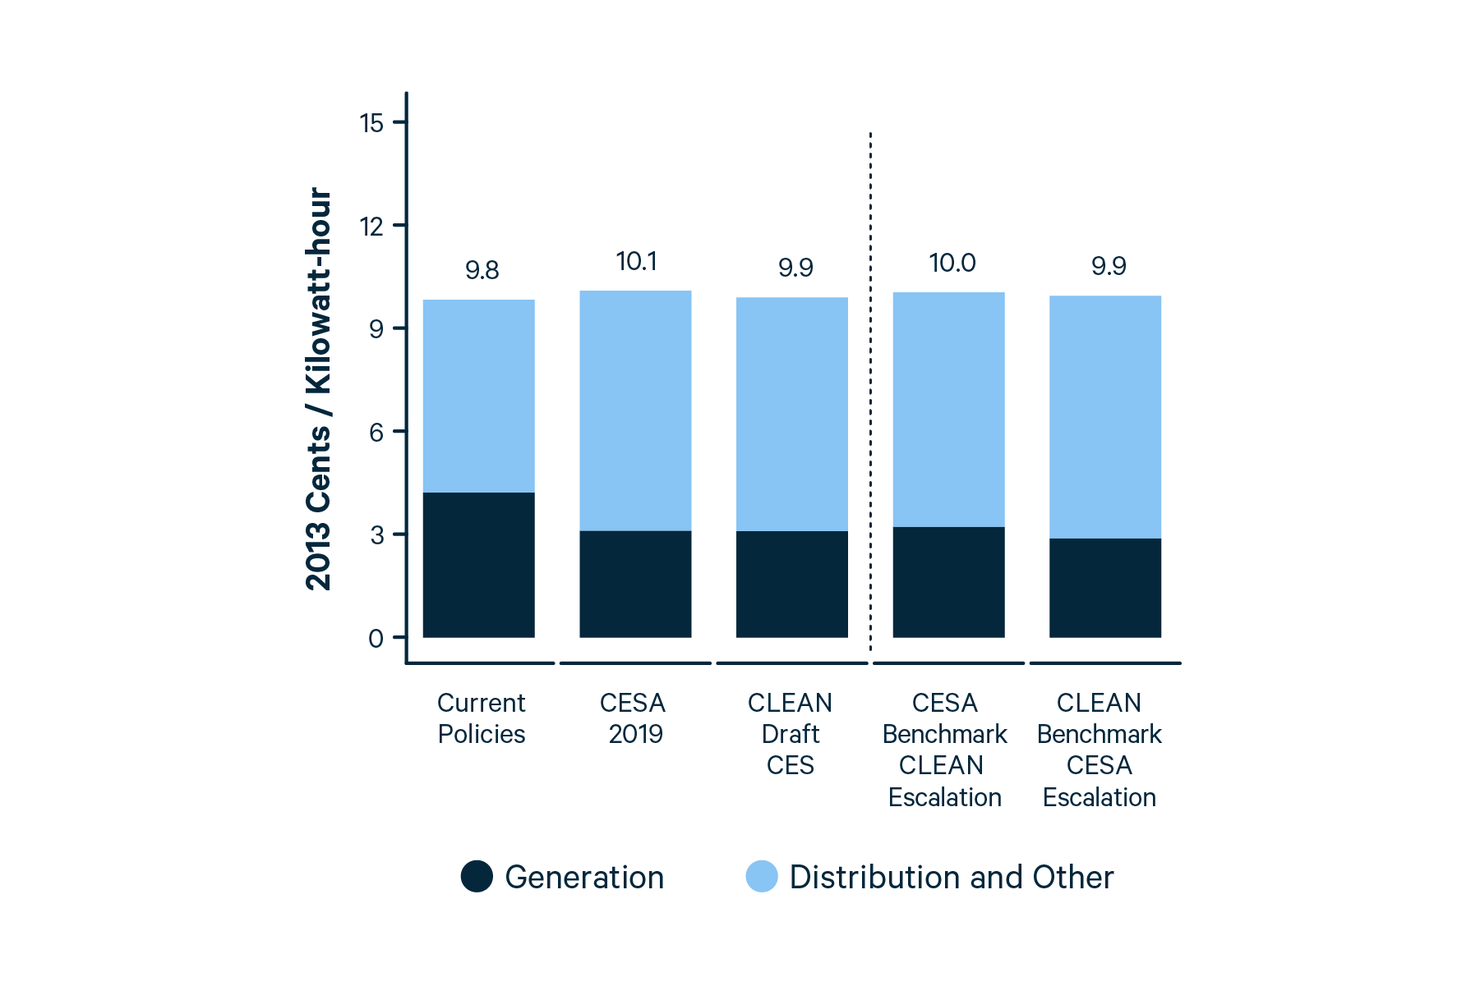
Effects on electricity prices are one measure of cost-effectiveness of the emissions reductions. Figure 6 shows average US retail electricity prices under each scenario, in 2035, assuming no changes in tax rates. Each policy slightly raises the retail price above that of Current Policies. The CESs that credit natural gas increase the retail price less than CESs not crediting natural gas, in part due to the less stringent targets but also because they reduce emissions at a lower cost, as explained at the end of the preceding section.
As illustrated by the dark (“generation”) component of the bar in Figure 7, the CES policies are projected to decrease wholesale electricity prices by subsidizing generation. The CESs with the higher benchmark lead to larger reductions in wholesale prices partly because they require a higher credit price (subsidy). For eligible clean energy generators, these larger reductions in clearing prices are projected to be offset by the higher prices of the CES credits they sell.
Figure 7. US Annual Average Retail Electricity Price, 2035 (2013$ / kWh)
Health Effects
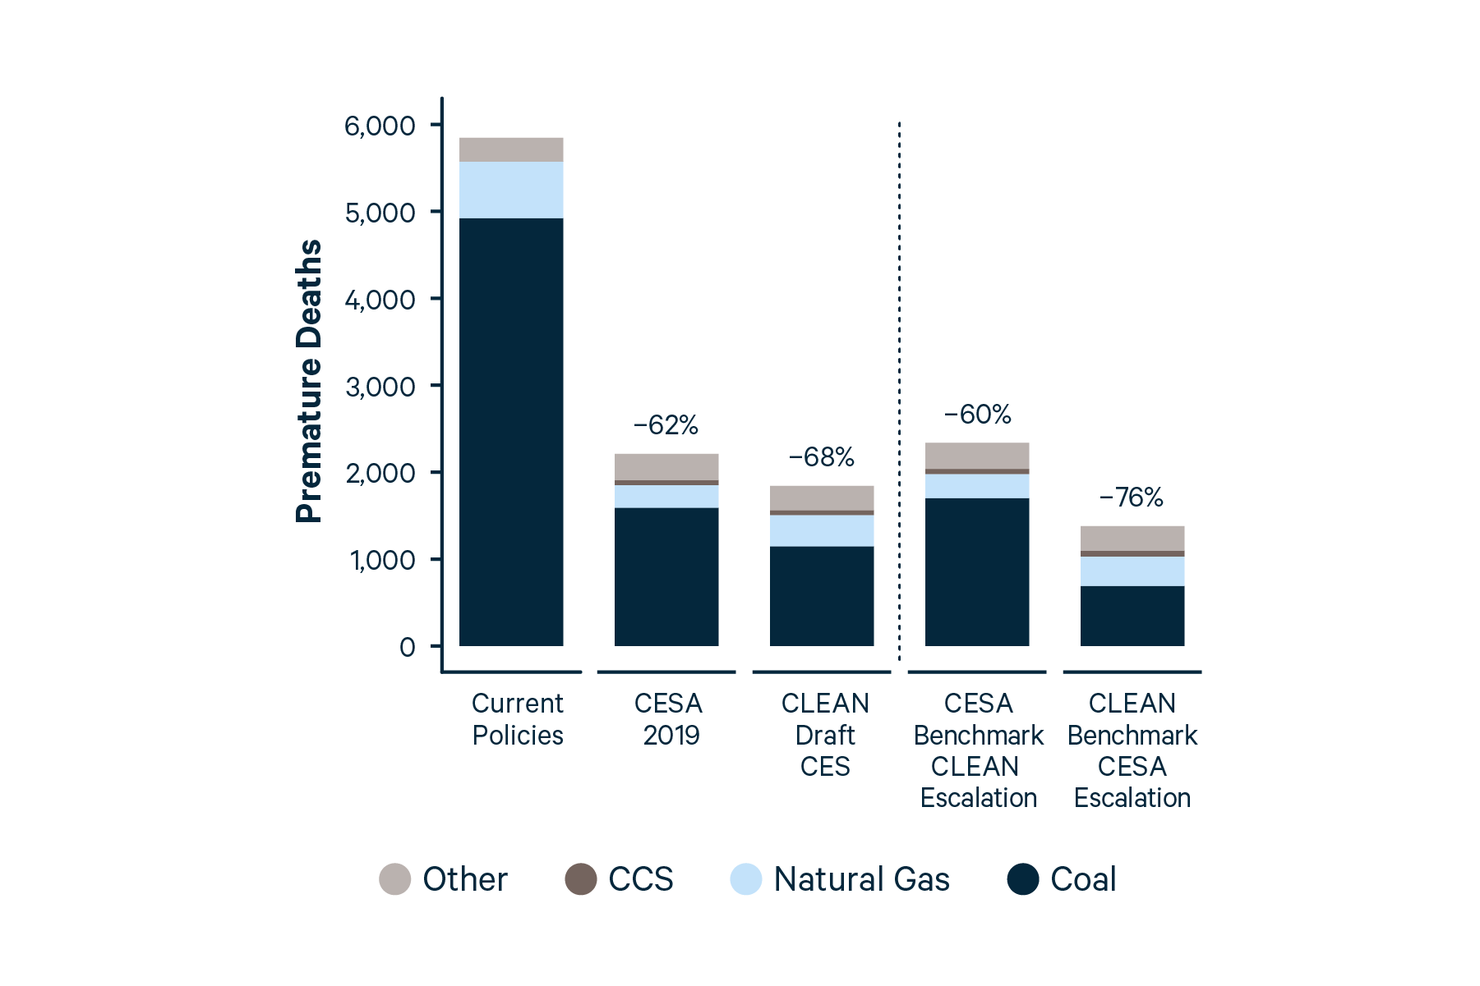
The composition of generation can have substantial implications for emissions and health outcomes. Coal-fired generation has, on average, much higher sulfur dioxide (SO2) and nitrogen oxide (NOX) emission rates than does natural gas-fired generation. As a result, the CESs with the lower benchmark excluding natural gas (allowing greater coal generation) result in higher SO2 and NOX emissions than the CESs with the higher benchmark crediting natural gas. Figure 7 shows the effect of this on estimated premature mortality from the fine airborne particulate matter that forms from power sector SO2 and NOX emissions. We estimate the particulate matter effects and the resulting deaths at the county level using a version of the Co-Benefits Risk Assessment (COBRA) Health Impacts Screening and Mapping Tool, reflecting the midpoint between estimates using dose-response functions from Krewski et al. (2009) and Lepeule et al. (2012). While CESA 2019 reduced carbon emissions the most, it was relatively less effective at reducing premature deaths. The CES using the CLEAN benchmark and CESA escalation method reduces prematures deaths the most. The greatest co-benefits are achieved by reducing coal-fired generation.
Figure 8. US Annual Estimated Premature Mortality from Power Sector SO2 and NOX Emissions
Benefit-Cost Analysis
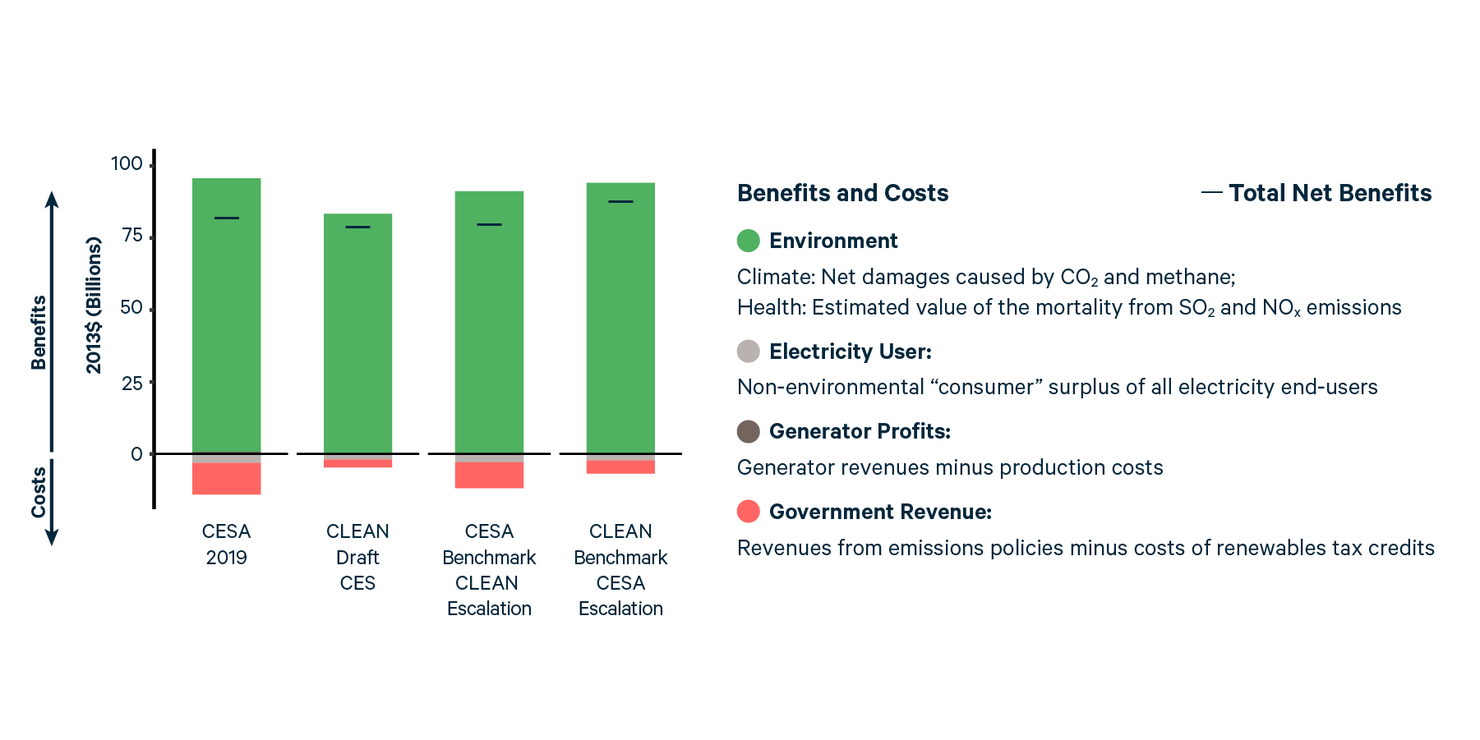
We compare the benefits and costs of each policy relative to Current Policies to estimate the total effect of each policy on societal welfare, or the net benefits to society, in 2035. We consider both environmental and non-environmental components in a comprehensive framework: climate net benefits, health benefits, effect on government net revenue, electricity end-user net surplus, and net profit of generation owners. (We assume that transmission congestion revenues and state and regional greenhouse gas pricing revenues are rebated to end-users.) A breakdown of the welfare benefits is shown in Figure 9. The black dash marks indicate total net benefits, which is the sum of the four categories defined in Figure 9.
Each policy results in net benefits to society, largely driven by environmental benefits. While CESA 2019 had resulted in the largest carbon emissions reductions, the CLEAN Benchmark paired with the CESA Escalation yields the greatest total net benefits, as the higher benchmark and faster escalating targets produce greater health co-benefits and lower cost to end-users. CESA 2019 yields the next highest net benefits, as the climate benefits outweigh the higher costs on consumers. While the CLEAN Draft CES has the lowest cost to consumers, it is the least effective at reducing 2035 CO2e emissions and consequently yields the least estimated net benefits to society. These four policy options are of course not the only ones. For example, an emission rate benchmark of 0.82 could be combined with a clean energy requirement of approximately 85% in 2035 to produce the same estimated CO2e reduction as CESA 2019 but at a lower cost and with lower mortality. If you are interested in this result, we can provide the simulation results that show it.
The sum of the effects on “electricity user,” “generator profit,” and “government revenue” can be called “net non-environmental cost.” The net non-environmental cost is lower with the CLEAN Benchmark than with the CESA Benchmark. There is reason to expect that this would be partially offset by the need to build more non-emitting generation facilities in the late 2040s and early 2050s under the CLEAN Benchmark, as the scope for emissions reductions by using gas instead of coal is reduced. This could also partially offset the advantage of the CLEAN Benchmark over the CESA Benchmark in terms of effect on retail electricity prices (Figure 7).
Figure 9: Total US Net Benefits of CES Policies, 2035 (2013$ Billions)
Caveats
The results presented are intended to be illustrative rather than a projection of expected outcomes under the policies proposed. They do not capture all elements of the proposed policies. For example, the CLEAN Future Act discussion draft includes many other provisions beyond the power sector CES than we represent in these simulations. Also, the simulations are a snapshot of 2035 based on a single simulation of 2035. This has two effects.
First, the model assumes that net clean energy credit banking in 2035 is zero. In reality, credit banking might cause emissions to be shifted between 2035 and other years, either increasing or decreasing emissions in 2035 in exchange for a change in the opposite direction in other years.
Second, the investment and retirement decisions of generators in the model are made based on each generator’s profit in 2035. If 20 years of that annual profit (discounted at 5.44% real per year) would cover the cost to build, the capacity is built, otherwise not. There is reason to expect that in the cases with a CES, this slightly decreases non-emitting generation, slightly increases fossil generation, and slightly increases emissions, relative to what would be projected if the model instead simulated additional years before and after 2035 and the generator investment decisions took into account profit in those additional years. Further, there is reason to believe that this effect is smaller with a benchmark emission rate of 0.4 than with one of 0.82.
Notes
[1] We convert methane to CO2-equivalent using the 100-year global warming potential of methane, since that corresponds almost exactly to the ratio of estimated methane damage per ton to CO2 damage per ton in Marten and Newbold (2012), assuming a 3% continuous real social discount rate. If the 100-year global warming potential does indeed correspond to the ratio of damages, then using a different global warming potential would result in higher costs or more emission damage. Note that the draft CLEAN Act proposes using a 20-year global warming potential.
[2] This is a loophole that could greatly undermine the effectiveness of the policy. Retailers that started out with 0% clean energy would have a competitive advantage over retailers that started out with higher percentages and could take away their market share, greatly reducing the average clean percentage targets. An alternative that avoids this loophole is to base the percentage requirement for all sales in a given area on the initial clean percentage of the electricity delivered in that area. We use this area approach in the CES modeling for this Issue Brief.
Additional Materials
References
EPA 2018, CO-Benefits Risk Assessment (COBRA) Health Impacts Screening and Mapping Tool, https://www.epa. gov/statelocalenergy/co-benefits-risk-assessmentcobra-health-impacts-screening-and-mapping-tool. Accessed May 7, 2019.
Lenox, C., Dodder, R., Gage, C., Loughlin, D., Kaplan, O., Yelverton, W., 2013. EPA U.S. Nine-region MARKAL database, database documentation. EPA/600/B-13/203. US Environmental Protection Agency, Cincinnati, OH https://www.epa.gov/air-research/epaus9r-energy-systems-database-use-market-allocation-markal-model.
Inter-Agency Working Group on the Social Cost of Greenhouse Gases (IWG), 2015. Technical update of the social cost of carbon for regulatory impact analysis under executive order 12866. Technical Support Document.
Marten, Alex L., and Stephen C. Newbold. "Estimating the social cost of non-CO2 GHG emissions: Methane and nitrous oxide." Energy Policy 51 (2012): 957-972.
Krewski, D., Jerrett, M., Burnett, R.T., Ma, R., Hughes, E., Shi, Y., et al., 2009. Extended follow-up and spatial analysis of the American Cancer Society study linking particulate air pollution and mortality. Research Report. Health Effects Institute, pp. 5–114.
Lepeule, J., Laden, F., Dockery, D., Schwartz, J., 2012. Chronic exposure to fine particles and mortality: an extended follow-up of the harvard six cities study from 1974 to 2009. Environ. Health Perspect. 120:965–970. https:// doi.org/10.1289/ehp.1104660.
Vimmerstedt, Laura J., Augustine, Chad R., Beiter, Philipp C., Cole, Wesley J., Feldman, David J., Kurup, Parthiv, Lantz, Eric J., Margolis, Robert M., Stehly, Tyler J., Turchi, Craig S., and O’Connor, Patrick. 2018 Annual Technology Baseline (ATB). United States: N. p., 2018. Web. doi:10.2172/1463080.


