The Shadow Price of Capital: Accounting for Capital Displacement in Benefit–Cost Analysis
This issue brief explains why the discounting sensitivity case using a 7 percent investment rate of return is generally incorrect and can yield extremely misleading estimates of the costs and benefits of policies with long-lived impacts, such as climate change.
1. Introduction
Circular A-4 (OMB 2003) is a guidance document that provides recommendations for federal agencies on how to conduct benefit–cost analysis (BCA), such as Regulatory Impact Analysis (RIA), including discounting future impacts depending on when they occur. Circular A-4 recommends two discount rates to adjust estimated future costs and benefits to present-day equivalents: 3 and 7 percent. The 3 percent consumption discount rate is meant to reflect the discount rate applicable to impacts on individual households (as measured by their consumption), with individuals being the ultimate concern of economic welfare analysis. In contrast, the 7 percent investment rate of return—which is sometimes called the “opportunity cost of capital”—is meant to reflect that costs may displace capital investment, which has a higher rate of return than the consumption rate due to taxes, risk, and other factors.
However, Circular A-4 notes that the economic literature has shown that the “analytically preferred” method to account for the higher investment rate of return is instead to use the “shadow price of capital” (SPC) approach, in which costs displacing capital investments are converted to consumption-equivalent values. Once all impacts are measured consistently in terms of consumption, all costs and benefits are appropriately discounted at the consumption discount rate. “Analytically preferred” is another way of saying “welfare based,” meaning consistent with maximizing the well-being of households, as measured by their consumption over time.
Nonetheless, the analytically preferred SPC approach is rarely used in practice. Instead, federal BCAs typically include a sensitivity case that discounts all costs and benefits at the investment rate of return, currently set at 7 percent by Circular A-4, with the intention that the use of the investment rate serves as a simplified way to account for capital displacement. This issue brief explains why the discounting sensitivity case using a 7 percent investment rate of return is generally incorrect and can yield extremely misleading estimates of the costs and benefits of policies with long-lived impacts, such as climate change.
Using an investment rate of return as one of the discount rate sensitivity cases is common practice in RIAs, but economists have demonstrated that it is only conceptually consistent with the analytically preferred SPC method under very restrictive and unrealistic conditions that are almost never satisfied (Li and Pizer 2021). Simply discounting benefits at an investment rate of return ignores the differences between the time pattern of the benefits and that of capital returns being displaced. That is, discounting future benefits at the investment rate of return to account for immediate cost impacts on capital investment mismeasures the value to households if those time patterns differ. This reflects well-known flaws in using investment rates of return to compare policy options, rather than an appropriate consumption discount rate. An appendix elaborates on why the traditional investment rate of return sensitivity case is incorrect.
Recent work not only confirms that the longstanding approach of using a 7 percent discount rate is inconsistent with the welfare-based SPC approach but also shows that the degree of embedded inaccuracy tends to compound the longer the time frame of the policy being evaluated (Li and Pizer 2021). It is therefore particularly inaccurate for actions with long-term consequences, such as actions that reduce greenhouse gas emissions.
Moreover, this issue brief explains how to move beyond the inconsistent but common practice of applying a 7 percent discount rate to address concerns about capital displacement. Instead, we show how the welfare-based SPC approach is simple to implement in practice, would not involve major changes in analytical procedures, and would simplify federal BCA by dispensing with multiple internally inconsistent discount rates within a given BCA. We demonstrate how one would implement this by re-evaluating the final RIA for the 2015 Clean Power Plan using the SPC framework and Circular A-4’s recommended 3 percent consumption discount rate. This demonstrates that the SPC approach would be simple to implement, account for concerns about capital displacement without resorting to the inconsistent 7 percent discount rate approach, and yield results not dramatically different from those reached by recently conducted RIAs where the time horizon is not particularly long.
2. The Welfare-Based Method Uses the SPC, Which Reflects the Impact and Duration of Capital Displacement
The welfare-based approach is to employ the SPC and use a consumption discount rate, so the natural question is what numeric value should be used for the SPC in BCA. The SPC, which reflects the welfare value lost from displaced capital investment, depends on how long it remains displaced in the economy. The degree of the displacement’s persistence is determined by broad economic equilibrium dynamics, including depreciation and savings, suggesting that the SPC should be guided by macro-derived models of optimal savings and investment. Li and Pizer (2021) present such a model, demonstrating that the SPC reflecting the degree of permanence of capital displacement depends on four parameters:
- μ, the depreciation rate of capital, which determines how quickly displaced capital would have decayed over time in any event;
- s, the savings rate (gross of depreciation), which replenishes capital over time;
- ri, the investment rate of return (net of depreciation), which determines the annual income (savings and consumption) lost per dollar of displaced capital; and
- rc, the consumption discount rate, which converts future consumption into equivalent present values.
Li and Pizer (2021) and Pizer (2021) present an analytical expression for the SPC as a function of these parameters, generalizing methods developed by Marglin, Bradford, and others in the 1960s and 1970s:
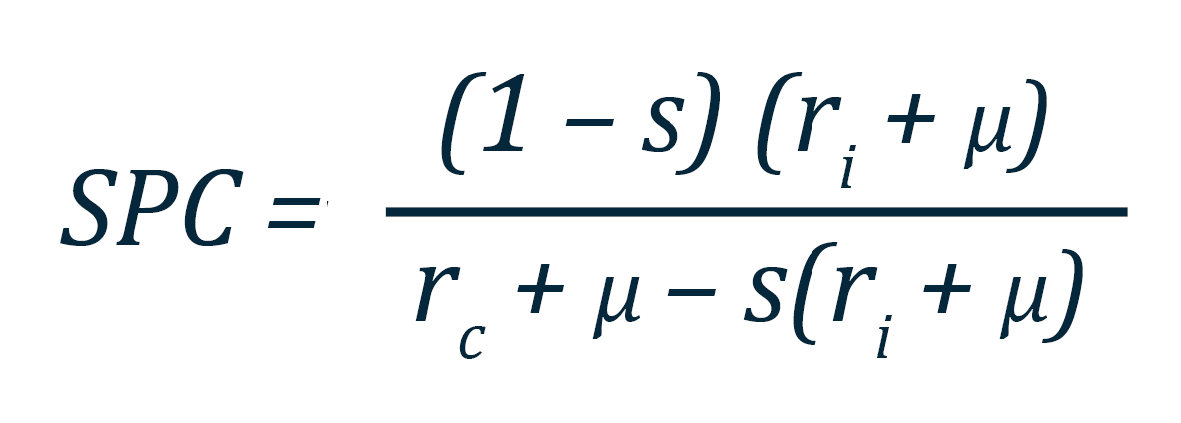
Using reasonable ranges for these parameters, Pizer (2021) suggests an SPC value of 1.2. A range of sensitivities around inputs to this equation suggest a lower bound of SPC value of 1.1 and an upper bound SPC value of no more than 1.6.Pizer (2021) recommends estimating ri based on tax rates applied to rc , yielding a preferred value of 1.2 and lower bound of 1.1 (see Pizer, 2021, and Li and Pizer, 2021 for details on other parameter values). An upper bound value for the SPC of 1.6 is based on using values of rc = 2 percent and ri = 7 percent. However, this approach does not compensate for the much higher risk inherent in a 7 percent market investment rate of return. Best practice in BCA warrants separating discounting from risk and discounting using relatively risk-free rates (Lind et al. 2011).
3. A Simple Sensitivity Approach to the SPC, with an Illustrative Example
With a value for the SPC in hand, its application is straightforward: simply adjust any capital-displacing costs (or benefits) in any year upward by multiplying by the SPC. The SPC converts capital impacts into consumption equivalents, so all costs and benefits can then be directly compared and discounted at the consumption discount rate. This allows analysts to dispense with the common but contentious approach of using the investment rate of return and avoid multiple different discount rates in a single analysis.
The SPC sensitivity approach is both simpler and much better grounded in welfare economics than the current 7-percent approach and can be implemented with currently available information. Moreover, it is less biased in its assumptions with regard to whether costs displace investment or benefits augment investment—the latter possibility being underappreciated (Li and Pizer 2021). For example, reduced damages from climate change may prevent destruction of long-lived assets, such as coastal infrastructure, and reduced mortality may lead to more savings and investment.
Specifically, when it is unclear whether a particular category of costs or benefits displaces capital versus consumption, the SPC sensitivity approach involves simply examining two extreme cases—assuming either that all costs displace capital or that all benefits augment capital. These two extremes would bound a central case that assumes all costs and benefits fall on consumption (consistent with the historically used 3 percent consumption discount rate case). All cases use the consumption discount rate. This approach also addresses an important set of recommendations of a formative report by the National Academies on the social cost of greenhouse gases (NASEM 2017) that discounting approaches in BCAs having climate impacts should apply a consumption discount rate to consumption-equivalent impacts and be internally consistent across various categories of benefits and costs (Rennert et al. 2021; Prest et al. 2021).
To demonstrate the simplicity of the SPC sensitivity approach, we show how analysts could have implemented the SPC in the RIA for the 2015 Clean Power Plan. That RIA compared costs and benefits calculated using multiple different discount rates, raising concerns about analytical consistency. The SPC approach would avoid such concerns but account for the issue of capital displacement.
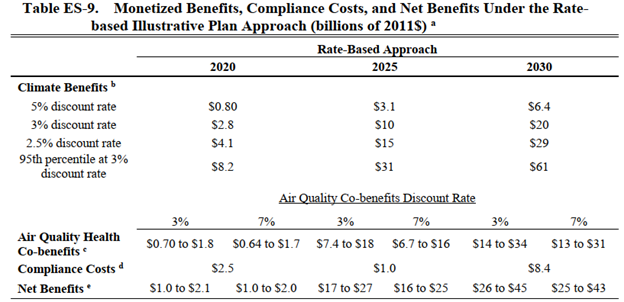
Table 1 shows a recreation of the 2015 Clean Power Plan BCA. We show the net benefits calculation using the snapshot approach for three specific years—2020, 2025, and 2030—as was done in the original RIA. The original RIA mixed 3 percent and 7 percent discount rates, but we dispense with the need for the 7 percent discount rate by accounting for the potential for capital displacement using the SPC. This greatly simplifies the net benefits table. Figure 1 shows the main panel of the original table from the Clean Power Plan RIA for reference, illustrating that it is much more complex.
Rather than the six columns in the original table representing benefits at consumption and investment discount rates, we simply add new rows representing benefits, costs, and net benefits using the SPC approach. The SPC involves scaling up compliance costs in each year by a factor of 1.2 (a 20 percent premium), under the assumption that all costs displace capital, and using the consumption discount rate to discount all costs and benefits. The compliance costs originally estimated by EPA were $2.5, $1.0, and $8.4 billion in 2020, 2025, and 2030, respectively. A 20 percent SPC premium raises these costs to $3.0, $1.2, and $10.1 billion due to increased costs from displaced capital in each of those years.
This application of the SPC to costs changes net benefits by a relatively small amount in this context, such as from the range of $26–46 billion (row 5) in 2030 to $24–44 billion (row 6)—a reduction of about $2 billion, which corresponds to the 20 percent premium on the originally estimated $8.4 billion. As Figure 1 illustrates, this has a similar effect as applying the higher 7 percent discount rate to air quality health benefits alone, which reduces those benefits by a similar amount, about $1–3 billion in 2030.
In the other sensitivity case, we apply the SPC on the benefits side of the ledger to account for the potential capital impacts of environmental improvements, such as reduced mortality bolstering the value of human capital, or individual savings. This increases estimated net benefits in 2030 from the range of $26–46 billion (row 5) to $32–56 billion (row 7).
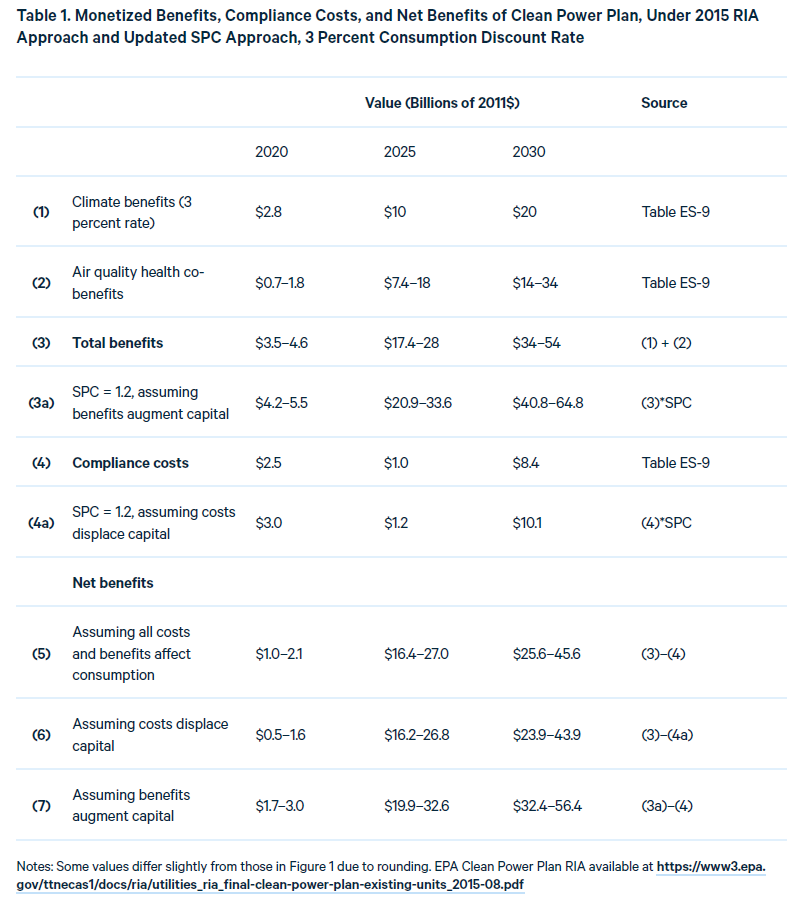
Figure 1. Original Clean Power Plan RIA Table
4. References
Bradford, David F., 1975. “Constraints on government investment opportunities and the choice of discount rate.” The American Economic Review 65 (5), 887–899.
Li, Qingran, and William A. Pizer. 2021. “Use of the consumption discount rate for public policy over the distant future.” Journal of Environmental Economics and Management 107 (May): 102428. https://doi.org/10.1016/j.jeem.2021.102428
Lind, Robert C., Kenneth J. Arrow, Gordon R. Corey, Partha Dasgupta, Amartya K. Sen, Thomas Stauffer, Joseph E. Stiglitz, and Jacob A. Stockfisch. 2013. Discounting for Time and Risk in Energy Policy. Washington, DC: RFF Press. https://www.taylorfrancis.com/books/mono/10.4324/9781315064048/discounting-time-risk-energy-policy-robert-lind-kenneth-arrow-gordon-corey-stockfisch-amartya-sen-thomas-stauffer-joseph-stiglitz-partha-dasgupta
Marglin, Stephen A., 1963a. “The opportunity costs of public investment.” The Quarterly Journal of Economics 77 (2), 274–289. https://doi.org/10.2307/1884403
Marglin, Stephen A., 1963b. “The social rate of discount and the optimal rate of investment.” The Quarterly Journal of Economics 77 (1), 95–111. https://doi.org/10.2307/1879374
National Academies of Sciences, Engineering, and Medicine. 2017. Valuing Climate Damages: Updating Estimation of the Social Cost of Carbon Dioxide. Washington, DC: The National Academies Press.
Pizer, William A. 2021. A Shadow-Price-of-Capital Approach to Harmonize Discounting for Greenhouse Gases in Broader Benefit–Cost Analyses. Washington, DC: Resources for the Future. https://media.rff.org/documents/OMB-2021-0006-0059_attachment_1.pdf
Prest, Brian C., William A. Pizer, and Richard G. Newell. 2021. “Improving Discounting in the Social Cost of Carbon.” Resources. https://www.resources.org/archives/improving-discounting-in-the-social-cost-of-carbon/
Rennert, Kevin, Brian C. Prest, Richard G. Newell, William A. Pizer, and David Anthoff. 2021. Comments to OMB on Estimating the Social Cost of Greenhouse Gases. Washington, DC: Resources for the Future. https://www.rff.org/publications/testimony-and-public-comments/comments-to-omb-on-estimating-the-social-cost-of-greenhouse-gases/
White House. 2003. Circular A-4. Washington: Office of Management and Budget. https://obamawhitehouse.archives.gov/omb/circulars_a004_a-4
5. Appendix: Common Approaches for Accounting for Capital Displacement Are Simplistic and Often Wrong
This appendix formally describes the mathematical logic underlying Circular A-4’s approach of incorporating capital displacement concerns by simply discounting benefits at a rate of 7 percent and illustrates why it fails to accurately reflect the fundamental concern except in very limited situations.
Circular A-4 notes that the SPC approach is analytically preferred, but for simplicity, A-4 nonetheless recommends the two rates for sensitivity analysis—a consumption discount rate (estimated historically at 3 percent) and an investment rate of return (estimated historically at 7 percent), notionally as a bound on how capital displacement might affect BCA. The latter rate is sometimes referred to as the “opportunity cost of capital.” The use of the consumption rate is appropriate when all costs fall on consumption and no costs displace capital.
However, the 7 percent investment rate of return is only an appropriate opposing bound under very specific assumptions. In particular, if the displaced capital is permanent and both the returns and benefits are paid out as perpetuities—or, more generally, if the pattern of benefits and investment returns are the same. A matching time pattern is a necessary condition to the validity of using the investment rate, implying that the use of the investment rate to reflect capital displacement is only appropriate in very limited circumstances.
To see why, let us walk through this special case for using the investment rate of return as a substitute for the analytically correct SPC approach. For permanent capital displacement, each dollar of immediate costs leads to a permanent one-dollar loss in capital. This has no immediate impact on consumers, but that dollar of capital would have returned the investment rate of return, denoted ri, to consumers every year in perpetuity. This return must go entirely to consumers—otherwise, it would be further affecting capital through savings. Therefore, a dollar of permanently displaced capital implies consumers face a cost equal to ri in every year into the future. The present value of this stream of consumer costs equals
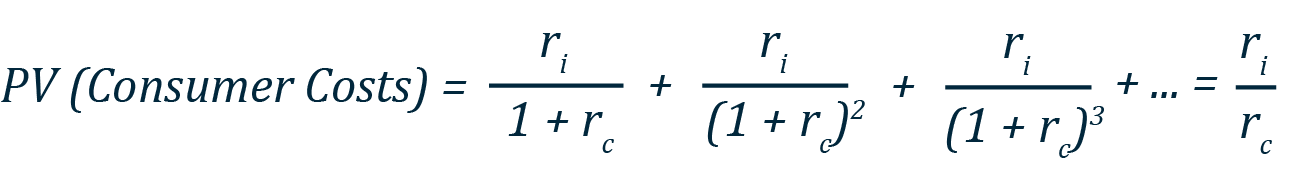
where the final equality, ri ⁄ rc, derives from the equation for the present value of a perpetuity. Thus, a dollar of permanently displaced capital is equivalent to ri ⁄ rc dollars of lost consumption today. For ri = 7% and rc = 3%, this SPC ratio would be 7 percent / 3 percent = 2.33.
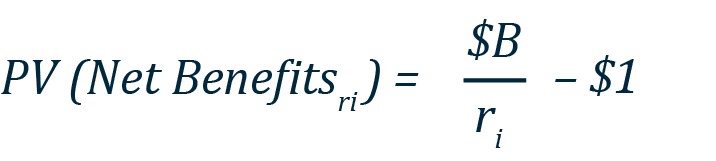
This SPC can easily be used to calculate net benefits within this extreme scenario. For benefits, assume this regulation generates $B of consumer benefits annually for each $1 of permanently displaced capital costs. Then, under the SPC approach, the net present value is given by

Using the SPC, this project passes a benefit–cost test if this expression is greater than zero, or $B > ri.
The alternative approach commonly used by government analysts, per Circular A-4, is to discount both the flow of benefits ($B) and immediate costs ($1) at the investment rate of return, ri. Despite there being no conceptual reason to change the benefit calculation to reflect the nature of costs, the intuition given is that the benefits from a project or policy should deliver the same or greater return than if the costs were invested (essentially comparing the internal rate of return). In this simple extreme case of permanent capital displacement and a perpetuity benefit, using the investment rate of return yields the same conclusion regarding whether a particular project passes the benefit–cost test. To see why, note that the net benefits would be the perpetuity value of the benefit flows, $B, discounted to the present at the investment rate of return ri, minus the immediate $1 of costsThe $1 of costs are assumed to accrue immediately, so they need not be discounted.:
Comparing the expressions for net benefits under the two approaches—equation (1) for the SPC and (2) for the investment rate of return—they both reach the same directional conclusion that the project passes a benefit–cost test if, and only if, $B > ri. This is the implicit logic underlying Circular A-4’s recommendation to discount all costs and benefits at the 7 percent rate—that is, it can mimic the considerations of the SPC under certain conditions, such as when costs permanently displace capital and benefits are paid out as a perpetuity.
This intuitive reasoning yields an equivalent result as the SPC approach in this specific case but not more generally. The equivalency breaks down as soon as the time pattern of regulatory benefits and ordinary capital investment returns differ. It is particularly problematic when regulatory benefits are much longer lived than ordinary capital investment returns. Here, they were both assumed to be perpetuities.
For example, suppose the benefits of this $1 in regulatory cost do not pay out as a perpetuity with $B paid every year but rather are a fixed payment of B = $10 received at T = 40 years. For this example, we will again use rc = 3% and ri = 7% as our consumption and investment discount rates, respectively. Therefore, the present value of those benefits would be $10 ⁄ 1.0340 = $3.07. As previously shown, using the SPC approach, the $1 in immediate, investment-displacing cost is valued at $1 • ri / rc= $1 • 7% / 3% = $2.33. Hence, this investment yields positive net benefits of $0.73 (equaling $3.07 in benefits minus $2.33 in costs). Had we ignored the SPC approach and discounted both benefits and costs at the investment rate of return of 7 percent as in the OMB guidance, we would have computed a present value of benefits of only $10 ⁄ 1.0740 =$0.67, yielding an incorrect conclusion of negative net benefits of -$0.33 (equal to $0.67 in benefits minus $1 in costs).
A subtle point is that in addition to the difference in sign, the 7 percent approach is calculating net benefits in terms of “capital equivalents.” In terms of consumption, the measure used in the 7 percent approach, to which one should compare the $0.73 in net benefits from the SPC, would be -$0.78 (which is -$0.33 × SPC ). The SPC measured in terms of capital equivalents would be $0.31 (which is $0.73 ÷ SPC).
If one were to solve for the single discount rate that yields the analytically correct conclusion in terms of capital—positive net benefits of $0.31—the resulting rate would be about 5.2 percent, which has moved toward the 3 percent consumption rate. For longer time horizons, such as those relevant to climate change, the rate will move even closer to 3 percent. Redoing this example with T = 100 years, the resulting rate at which to discount both costs and benefits is 3.9 percent.
This demonstrates another important point: the SPC is a simpler way to account for capital displacement than discounting at the higher investment rate of return. Namely, if one wishes to account for investment displacement in the initial period by applying a higher discount rate (that is, above the consumption rate) to future costs and benefits, then one must first determine the appropriate rate. As we have shown, the appropriate rate in this circumstance is much lower than the investment rate of return, and both depend on the time pattern of both benefits and costs, even in this very simple example. Furthermore, determining this rate would require conducting a full SPC analysis anyway. Hence, the more straightforward and correct approach would be to simply conduct the SPC analysis.


