Prioritizing Justice in New York State Climate Policy: Cleaner Air for Disadvantaged Communities?
This report, produced in partnership with the New York City Environmental Justice Alliance, examines air quality improvements in two options for implementing New York State's Climate Leadership and Community Protection Act.
Executive Summary
Our country and New York State (NYS) in particular are striving to meet the interrelated challenges of decarbonization and environmental justice. Historically unjust systems and policies have led to a disproportional air pollution burden on low-income communities and communities of color. As a result, the federal and NYS governments have resolved to meet their climate goals while improving air quality conditions in disadvantaged communities.
Bringing together leading environmental justice advocates, economic researchers, public health scientists, and air quality modelers, Resources for the Future (RFF) and the New York City Environmental Justice Alliance (NYC-EJA) along with researchers at Yale, UC Davis, and Northeastern University have partnered to investigate local air quality impacts on disadvantaged communities from implementation of the NY Climate Leadership and Community Protection Act (CLCPA). Specifically, we compare two sets of policies, both in line with the statutory requirements of the law but differing in their ambition and the degree to which they focus on aiding disadvantaged communities, with a business-as-usual (control) case in 2030. One policy case (inspired by recommendations of the Climate Action Council, CAC) models what the New York State government may implement, which includes policies discussed in other jurisdictions and proposed by New York policymakers. The other case (representing what many stakeholders recommend) was crafted by a team led by NYC-EJA and included many environmental and climate justice advocates in New York, who prioritized community protection and directing benefits to marginalized communities. We modeled the impact of policies on the electric power, on-road transportation, ports, and residential building sectors; the effects these policies have on emissions of direct fine particulate matter (PM2.5) and its precursors nitrogen oxides, sulfur dioxide, and volatile organic compounds (NOx, SO2, and VOCs); and the resulting PM2.5 concentrations experienced by disadvantaged communities and nondisadvantaged communities alike. For a full list of policies modeled, see Table 1 in our full report.

1. Introduction
As a result of historically unjust systems and policies, the neighborhoods where low-income communities and communities of color live, work, learn, and play are often sites for or affected by polluting infrastructure, vehicle congestion, and other environmental hazards. Racist systems and policies along with economic discrimination continue to diminish the health and quality of life of communities of color and low-income communities and make them more at risk to other hazards like climate change (Peña-Parr 2020; Donaghy et al. 2023). As fossil fuel consumption and pollution have increased exponentially over the past century, not only has the climate change outlook worsened, but vulnerable communities have also disproportionally suffered injury, disease, death, displacement, and loss of property because of these same trends (Resnik 2022).
To address the growing inequities, community leaders have advocated for clean air, water, and land and fought against trash incinerators, highways, and fossil fuel power plants being placed in their neighborhoods. National and state climate policy has rapidly evolved in the past decade—not only are efforts to reduce greenhouse gases (GHGs) increasing, but recent efforts have also put racial, social, and economic justice at the forefront of the policy conversation. With leadership from communities affected first and worst by pollution and other environmental and climate risks (often referred to as “frontline communities”), policies are now expected to achieve not only climate goals but also improvements in environmental and economic justice. Another key goal is to ensure a just transition, making sure that low-income communities and communities of color don’t face disproportionate burdens or exclusion from the benefits of the transition from a fossil fuel economy to a resilient, equitable, and regenerative society.
One of the most prominent examples of justice-oriented climate policy is New York State’s recent climate law, the Climate Leadership and Community Protection Act (CLCPA). As the state moves to implement this groundbreaking law, rigorous research and analysis are needed to shed light on policy design options that can achieve the dual goals of cutting GHG emissions and improving air quality and other public health outcomes for “disadvantaged communities,” as defined by the state. This requirement is the motivation for this study.
Bringing together leading environmental justice (EJ) advocates, economic researchers, public health scientists, and air quality modelers (see Appendix A), our study investigates EJ impacts in the context of the CLCPA. Specifically, we model the impact of policies on the electric power, on-road transportation, ports, and residential building sectors, and the resulting fine particulate (PM2.5) air pollution experienced by disadvantaged communities and nondisadvantaged communities alike. We compare two policy scenarios: one inspired by the Climate Action Council’s (CAC) scoping plan for implementing the CLCPA, and one inspired by the policy priorities of environmental and climate justice stakeholders in New York. A key question driving our research is, to what extent do the policies contemplated in the CLCPA scoping plan indeed (as required by the CLCPA) “not result in a net increase in copollutant emissions or otherwise disproportionately burden disadvantaged communities” and/or “prioritize measures to maximize net reductions of … copollutants in disadvantaged communities”? And furthermore, how do the scoping plan policies compare—in this regard—with those policies advocated by New York’s EJ stakeholders?
Our analysis has revealed 10 major findings and insights:
- GHG reductions in 2030 are substantial under both cases relative to the business-as-usual (control) case but are greater under the stakeholder case (58 percent vs. 34 percent reduction).
- The stakeholder case leads to greater statewide emissions reductions for all PM2.5 precursors (nitrogen oxides, NOx; sulfur dioxide, SO2; and volatile organic compounds, VOCs) than the CAC-inspired case.
- The stakeholder case leads to greater statewide PM2.5 concentration reductions (air quality improvements) than the CAC-inspired case in 99 percent of census tracts.
- In the CAC-inspired case, average air quality improvements in disadvantaged communities are comparable to the improvements made in nondisadvantaged communities. In the stakeholder case, improvements in disadvantaged communities are greater than those in nondisadvantaged communities.
- Although, on average across the state, both cases improve air quality (reduced PM2.5 concentrations), some census tracts do experience a worsening of air quality (increased PM2.5 concentrations): in the CAC-inspired case, about 6 percent of the state’s roughly 5,000 tracts experience worse air quality, a fourth of which are disadvantaged communities, whereas in the stakeholder case, only three census tracts experience worse air quality, none of which are disadvantaged communities.
- The most vulnerable communities (the top 10 percent of tracts in the state’s social vulnerability measure, and the 10 percent with historically worse air quality) experience particularly pronounced improvements under the stakeholder case but experience average air quality improvements in the CAC-inspired case.
- Both policy cases make air quality improvements in disadvantaged communities, but the impacts are too evenly shared with nondisadvantaged communities to reverse the historical disparity in air pollution concentrations.
- In an illustrative calculation, the stakeholder case offers the greatest public health benefits to elderly Black New Yorkers relative to their Hispanic, Asian, and white counterparts. Although 22 percent of New York City’s 65 and older population is Black, this group accounts for 42 percent of the avoided deaths from PM2.5 reductions; white residents make up 41 percent of the city’s 65 and older population but account for 37 percent of the avoided deaths.
- Both cases, as modeled, meet the CLCPA EJ goal to “not disproportionately burden disadvantaged communities,” if we define burden to mean increasing PM2.5 concentrations.
- The greater benefits associated with the stakeholder case relative to the CAC-inspired case require greater investment, since the stakeholder policies are more ambitious and offer more generous subsidies to encourage electrification of buildings and vehicles. The emissions reductions and air quality improvements for disadvantaged communities certainly favor the stakeholder case, driving valuable health and equity outcomes that may well outweigh the policy costs, but estimating benefits and costs was beyond the scope of this project.
2. The New York Climate Policy Environmental Justice Landscape
2.1. The Climate Leadership and Community Protection Act (CLCPA)
The CLCPA, passed in 2019 after years of debate and advocacy, sets ambitious GHG emissions goals, including an 85 percent reduction in economywide GHG emissions by 2050, 70 percent renewable energy by 2030, and a 100 percent zero-emissions electricity sector by 2040. The law also mandates that the state achieve 9,000 MW of offshore wind by 2035; 3,000 MW of energy storage by 2030; 6,000 MW of solar by 2025; and 22 million tons of carbon reduction through energy efficiency and electrification.
In addition, the law explicitly sets goals for environmental and climate justice—addressing the disinvestment and disproportionate environmental burdens that communities of color and low-income communities have experienced. The preamble states that “actions undertaken by New York State to mitigate GHG emissions should prioritize the safety and health of disadvantaged communities, control potential regressive impacts of future climate change mitigation and adaptation policies on these communities, and prioritize the allocation of public investments in these areas.”
Not only does the CLCPA require reductions in GHGs like methane and carbon dioxide (CO2), it also targets local air pollutants—what the law refers to as copollutants—such as PM2.5 and SO2. The law specifically directs the New York State Department of Environmental Conservation (NYSDEC) to “ensure that activities undertaken to comply with the regulations do not result in a net increase in copollutant emissions or otherwise disproportionately burden disadvantaged communities” and to “prioritize measures to maximize net reductions of GHG emissions and co-pollutants in disadvantaged communities.” Stated simply, the CLCPA requires state climate regulations to prioritize air quality in disadvantaged communities—including by requiring that environmental burdens are not shifted from wealthier communities to lower-income, minority communities. The CLCPA also establishes a Climate Justice Working Group (CJWG) tasked with establishing criteria for identifying disadvantaged communities and representing EJ priorities throughout the various stages of CLCPA implementation. The final criteria were adopted on March 27, 2023, after a public comment period and public hearings held across New York State. Additionally, the law stipulates that 35 to 40 percent of the benefits and investments go to disadvantaged communities.
2.2. Environmental Justice
The Climate Justice Alliance, a national network of frontline communities and organizations demanding a just transition, defines environmental justice as the right of all people, regardless of race or socioeconomic background, to live, work, and play in communities that are safe, healthy, and free of life-threatening and harmful conditions. The alliance works to realize a vision for a just transition, which is a “place-based set of principles that build economic and political power to shift from an extractive economy to a regenerative economy.” The alliance states that the “Just Transition must advance ecological resilience, reduce resource consumption, restore biodiversity and traditional ways of life, and undermine extractive economies, including capitalism, that erode the ecological basis of our collective well-being. This requires a re-localization and democratization of primary production and consumption by building up local food systems, local clean energy, and small-scale production that are sustainable economically and ecologically. This also means producing to live well without living better at the expense of others.”
The Climate Justice Alliance and the EJ movement more broadly are led by (and advocate for) frontline communities who experience climate and environmental hazards first and worst. EJ communities are frontline communities: low-income communities and communities of color who face disproportionate exposure to environmental hazards due to both intentional design and structural racism. The Climate Justice Alliance describes the origins of the EJ movement as growing “out of a response to the system of environmental racism where communities of color and low-income communities have been (and continue to be) disproportionately exposed to and negatively impacted by hazardous pollution and industrial practices. Its roots are in the civil rights movement and are in sharp contrast to the mainstream environmental movement, which has failed to understand or address this injustice. The EJ movement emphasizes bottom-up organizing, centering the voices of those most impacted, and shared community.
Historically, low-income communities and communities of color have been systematically disinvested from, with racist policies and practices such as redlining used to value certain neighborhoods and residents above others (Hoffman et al. 2020). These policies and systems have caused wealth and resource gaps that endure to this day, investing in quality-of-life improvements in wealthier areas while pushing polluting industries into lower-income communities (Hoffman et al. 2020; Nardone et al. 2020; Schell et al. 2020). We see these disparities reflected in the location of power plants, transportation depots, and city parks. The impacts of this unequal investment are clear in public health data, with environmentally driven poor health outcomes like asthma most prevalent in EJ communities (New York City Department of Health and Mental Hygiene 2020).
Policymakers have paid little attention to these historical racist practices and the resulting disparities in distributional effects that have maintained and widened resource gaps. Without intentional consideration and targeted policy implementation, an unjust distribution of costs and benefits of policies and programs will continue to cause EJ communities to experience greater burdens than their white and wealthier counterparts.
2.2.1. Community Leadership and Solutions
As policymakers seek solutions to climate change, EJ experts and community leaders have emphasized the importance of doing so in a way that centers racial and economic justice, addressing this history of abuse. EJ advocates have been calling for climate policies that not only reduce GHG emissions but also ensure that the costs of an energy transition do not fall unduly on disadvantaged communities, and make improvements in the environmental conditions, public health, and adaptive capacity of disadvantaged communities.
EJ and climate justice stakeholders in New York have played a central role in representing the needs of underserved communities, as reflected in numerous provisions in the CLCPA. In the creation and execution of this research project, EJ and climate justice stakeholders were centrally involved to ensure that community concerns and expertise were woven into the fabric of the research design and process. It was crucial that the EJ stakeholder policy case reflect what these EJ stakeholders are fighting for and most want to see enacted to protect their communities. Accepting and incorporating their knowledge and leadership are important steps in the process of dismantling historical inequities and ensuring that all parties involved have a seat at the negotiating table for environmental policies such as the CLCPA.
3. Our Research
As New York moves to meet the CLCPA decarbonization goals, the state will implement policies that phase out behaviors and technologies that generate GHG emissions. Our research seeks to inform this process by analyzing the GHG and air pollution impacts of three policy cases: a business-as-usual case, meant to represent what would happen to emissions and air quality without the actions contemplated in the two policy cases; the stakeholder policy case, meant to reflect EJ policy priorities; and the CAC-inspired policy case, meant to reflect a plausible set of policies coming out of the state’s scoping plan process, which defines the policy goals and tools that ought to be used to meet the legal requirements of the CLCPA. Details on the policy cases can be found in Section IV. We focus on how the policy cases affect PM2.5 concentrations in communities at the census tract level across the state.
To compare policy outcomes between disadvantaged communities and nondisadvantaged communities, we use an EJ screen (referred to in this report as a climate health and vulnerability index) and an EJ map. The EJ screen and map reflect the disadvantaged community criteria and methodology developed by the state through the CJWG. Using this EJ screen and map, we track the effects of changing PM2.5 concentrations on disadvantaged and other communities.
Several characteristics of our research set it apart from other research efforts. Our contribution to examining the outcomes of decarbonization policies on EJ communities at a state level is unique. Additionally, we use a combination of behavioral models and one of the most sophisticated air quality models to assess and trace the consequences of the two policy cases for disadvantaged communities (DACs) and non-DACs. Further, mapping these results visually at the 4km2 scale gives readers an unprecedented ability to assess and understand the geographic distribution of results.
3.1. Methodology
This project involves several models that work together to estimate the emissions and air quality impacts of different policies. The first step in our research is to build and compare the three cases—business-as-usual case, CAC-inspired policy case, and stakeholder policy case—in consultation with New York policy experts (see Appendix A and Section IV). Next, we use four economic models that estimate the future emissions impacts of different policies in each of the three cases (see Appendix B). Models of the electric power sector, the light-duty vehicle market and fleet, the medium- and heavy-duty vehicle market and fleet, as well as nonmarine port activities and the residential building sector are included in our analysis.
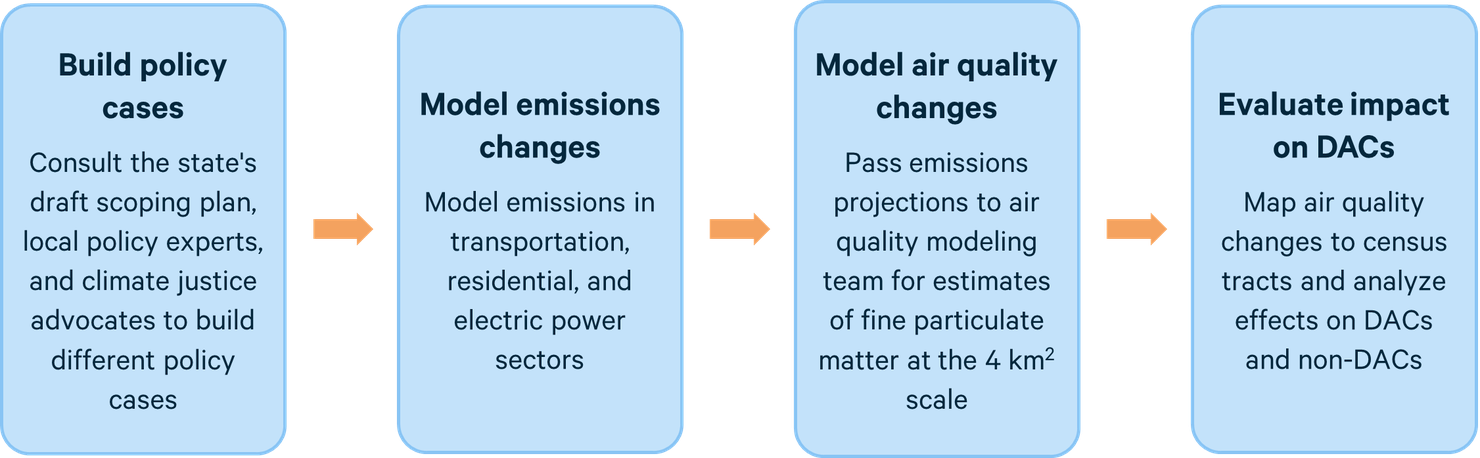
The emissions estimates produced by the economic models are used as inputs in an air quality model that projects changes in PM2.5 resulting from meteorological conditions, chemical reactions, and other factors (see Appendix C). We then incorporate the CJWG’s criteria for identifying DACs in our EJ screening and mapping tool to analyze outcomes for the three cases in 2030 (see Appendix D). By comparing emissions levels and air quality changes in DACs with non-DACs, we can ascertain the impacts of different implementations of the CLCPA for vulnerable communities. Figure 1 depicts the flow of research for this project.
Figure 1. Research Process
The research and findings from this project contribute to the current body of work investigating the impacts of the state’s climate policies. The most expansive work in this space was conducted by New York State Energy Research and Development Authority (NYSERDA) and NYSDEC in partnership with E3 in 2021 to inform the scoping plan process. Their work focused on establishing estimated pathways of decarbonization across all sectors affected by the CLCPA. Our work is more focused on a few critical sectors for which we have robust behavioral models. For a full list of differences with the state-sponsored analysis, see Appendix F.
We also acknowledge that important boundaries to our research may influence the interpretation of the results. For example, our air quality modeling is at a 4km2 grid resolution, which in some cases is larger than a DAC boundary. We use one of the most advanced air quality models for our estimates, which incorporates detailed representations of atmospheric science and chemical processes. We have selected a spatial resolution that preserves the accuracy of that model. To aid in the interpretation of our work, we describe the limitations and caveat for our analysis in Appendix G, including a small error in the transportation emissions used as an input in the air quality model.
4. The Cases
We focus on 2030 as the year for modeling economic activity and related air pollutant concentrations throughout New York State. Our modeling begins with a business-as-usual case, which includes policies in place prior to the passage of the CLCPA and continues through 2030. We also model two policy cases: the CAC-inspired policy case, which assumes policies are implemented to meet the goals of the CLCPA as stated in the CAC scoping plan, and the stakeholder policy case, which assumes policies are implemented in line with the priorities and preferences of prominent EJ advocates in New York. The details of all three scenarios are described below.
4.1. Business-as-Usual (BAU) Case
The models incorporate a variety of forward-looking economic and demographic projections to anticipate future conditions. For example, future oil and natural gas prices, population projections, and income and wage growth are all considered. The energy models in this project, like many others, use Energy Information Agency (EIA) projections for these high-level drivers of change. The projections are found in EIA’s Annual Energy Outlook (AEO), which is based on runs of the National Energy Modeling System.
The latest AEO available at the start of our project was the AEO2021 and embodies the agency’s most recent economic activity projections. EIA limits its modeling to sets of policies (mostly federal, and in some cases, state) that are already in place, not policies that might be implemented in the future. Its projections do not assume that a carbon tax or any other federal CO2 reduction plan is implemented.
Our modeling work took place over the course of 2022. We were required to lock in assumptions about what federal and state policies to model in the BAU case in January 2022. As a result, the effects of neither the Infrastructure Investment and Jobs Act nor the Inflation Reduction Act are included in our baseline. We made the following adjustments from the AEO2021 reference case to adapt it to our research:
- We used the AEO2020 projections for key transportation parameters, since these assume the Obama-era fuel economy standards are in place, rather than the Trump administration rollbacks represented in AEO2021.
- We used the reference cases for both AEO2020 and AEO2021 for oil and gas supply based on alignment with other modeling exercises and to avoid potentially biasing results by selecting an AEO case with high or low growth. The difference in 2030 CO2 emissions is about 5.6 percent between the reference and high growth cases and about 10 to 11 percent between the high and low cases. Thus, we favor an unbiased choice—the reference case.
- We used E3’s New York–specific assumptions about the transportation sector, including the increase in vehicle miles traveled in the state.
4.2. CAC-Inspired Policy Case (CPC)
The CPC was developed based on the Climate Action Council’s (CAC) draft scoping plan and conversations with New York State policy experts. We identified policies in the relevant sectors and adjusted where needed to fit the needs of our models. Table 1 provides a list of the CPC policies we model with brief descriptions.
Not all these policies are explicitly mentioned in the scoping plan. Our modeling work is based on behavioral responses to economic policies, so we had to add detail and specificity to policies where none existed. The CPC represents one reasonable interpretation of how the priorities in the scoping plan may be executed. The details were established using a mix of New York policy proposals, examples from other state and federal climate policy proposals, and feedback from New York policy experts.
4.3. Stakeholder Policy Case (SPC)
The SPC was developed with various EJ organizations operating throughout New York. These groups identified local and statewide priorities and gave feedback on the draft scoping plan’s proposed policies in the sectors we analyzed through several workshops and written comments. Table 1 lists the SPC policies that we included in our modeling and reasons why they diverge from the CPC.
There are many policies considered essential by climate and environmental justice advocates that we were unable to integrate into our research. We excluded policies for three primary reasons: (1) the policy applies to sectors that we are not modeling (e.g., agriculture policies), (2) we were unable to estimate accurate emissions changes from
the policy because of model limitations (e.g., public vehicle fleets are excluded in our transportation model), and/or (3) the objective of the policy affects an outcome other than emissions reductions or air quality improvements (e.g., job training programs). The exclusion of these policies is in no way a reflection on their importance, feasibility, or impact but rather a result of the reality of our modeling limitations. See Appendix A for a list of policies that the stakeholder groups identified as critical to their communities that we were unable to include in our models.
Furthermore, some if not all of the policies we model will affect conditions and outcomes that we do not estimate. For example, regional employment, water pollution levels, and health outcomes are all important metrics of a thriving community that are shaped by climate policies but not included in our modeling. Consequently, although we can make inferences about some of these outcomes, they are excluded from our policy analysis. The decision not to model these outcomes is not a judgment on their significance; they are simply outside our research scope.
Table 1. Details of Policy Cases
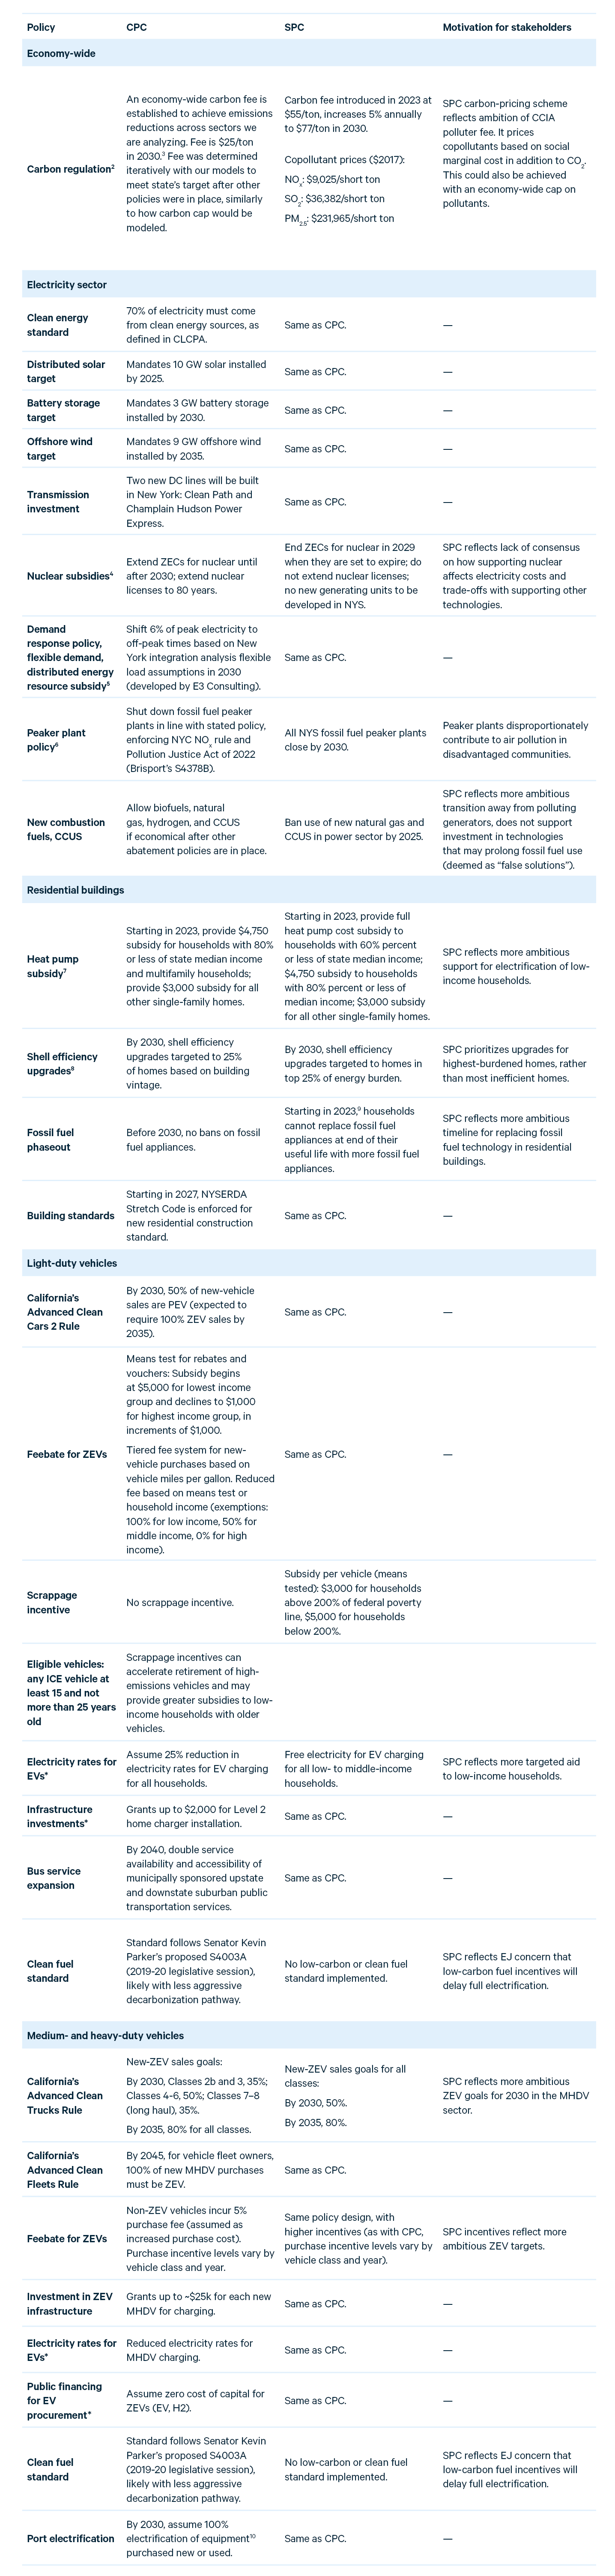
Economy-wide carbon regulation (cap or fee) in both policy cases is accompanied by a border carbon adjustment for imported and exported electricity. That border carbon adjustment is a fee on electricity imports to New York State and an equal subsidy on electricity exports from New York State. The level of the fee and subsidy is the price on New York in-state CO2 emissions times the average GHG emissions rate of electricity generation in adjacent regions. In this GHG emissions rate calculation, each pound of methane is counted the same as 30 pounds of CO2. This price was set to meet emissions reductions targets only in the sectors we model. A carbon price may play a larger role in eliciting emissions reductions in other sectors. The relative cost of emissions reductions in those sectors may require a higher price to achieve the desired result. Observing further emissions reductions with a low price in our policy case implies that there are relatively low-cost reductions that were not incentivized by the other modeled policies. Several policies included in the policy case force relatively high-cost emissions reductions (like the ZEV mandate in the transportation sector) that would not be achieved with the modeled carbon price alone. Our modeling took place before the passage of the Infrastructure Investment and Jobs Act or the Inflation Reduction Act, so the Civil Nuclear Credit program and the nuclear tax credit are not included in our modeling. These would likely reduce the costs of sustaining nuclear in the CPC and prevent retirement of nuclear in the SPC. Our power sector model has limited ability to model demand response and incentives for distributed energy resources directly, so we model these as an assumed shift in peak demand. We use the assumptions from the state analysis for this purpose. Peaker plants generally run only when demand for electricity is very high, or “peaking.” They are generally less efficient than other fossil fuel generators because they are designed to ramp up energy production quickly when needed. Heat pumps are assumed to be air-source heat pumps, and subsidies are assumed to fully cover the costs associated with building upgrades needed to install heat pumps. Shell efficiency upgrades are defined as an upgrade of the building standard when the home was built, to the latest NYSERDA stretch building code. The model considers the efficiency associated with each of these standards. At the time of constructing this policy case, the state was considering a fossil fuel hook-up ban for residential buildings. It was not included in the 2023 budget but it was after we modeled the SPC. This only includes equipment and terminal vehicles (any type F vehicle that operates within terminals). Drayage is included in the overall truck flows, and so is subject to all of the policies (most prominently, the Advanced Clean Trucks rule and feebate) listed above that apply to MHDVs.
5. Results
This results section has four subsections: Economic Modeling Results, which describes estimated changes in energy demand and technology adoption across our modeled sectors; Greenhouse Gas, PM2.5, and Precursor Emissions Results, which describes estimated emissions changes in our modeled sectors; Location of Emissions Changes, which describes the location of estimated changes in PM2.5 emissions; and finally Air Quality Results, which describes estimated changes in PM2.5 concentrations across community types and provides context for understanding the public health benefits of changes in air quality.
Our results focus on the differences between our two main policy cases (CPC and SPC), with reference to the BAU case. Significant changes in technology adoption and emissions are estimated to already occur under the BAU case, relative to the historical baseline. For example, even under the BAU, our modeling projects that New York State’s electricity sector CO2 emissions will fall to 17 million short tons in 2030, down from 31 million in 2020 (US EIA 2023), primarily as a result of the addition of solar and wind generation capacity. State policy to close peaker plants in areas with high population density also contributes to the steep decline in SO2 and NOX by 2030 under the BAU. Additionally, federal vehicle emissions standards and the continual retirement of older, more polluting vehicles leads to significantly lower emissions from cars and trucks. In the residential sector, the transition to natural gas furnaces in lieu of traditional oil furnaces significantly reduces PM2.5 and SO2 by 2030, even without additional policy.
5.1. Economic Modeling Results
The policies we modeled have a wide range of ambition and vary in their timelines for implementation. These results illustrate how far each policy case goes in pushing economic behavior that will lead to decarbonization and air quality improvements. The full sectoral analysis of economic results can be found in Appendix H. Figure 2 shows a summary of the key technologies and their adoption rates across each policy case.
Both policy cases prompt a dramatic increase in clean energy generation relative to the BAU. Compared with the CPC, SPC policies boost renewable generation and storage capacity. Relative to the CPC, the SPC delivers a 30 percent boost for solar, a 40 percent boost for wind, and nearly a 200 percent increase in storage capacity. The SPC also cuts nuclear, natural gas, and waste and biomass generation relative to the CPC (roughly 35 percent less for nuclear and 30 percent less for natural gas and waste).
Figure 2. Clean Technology Adoption Rates, by Policy Case (Percentage)
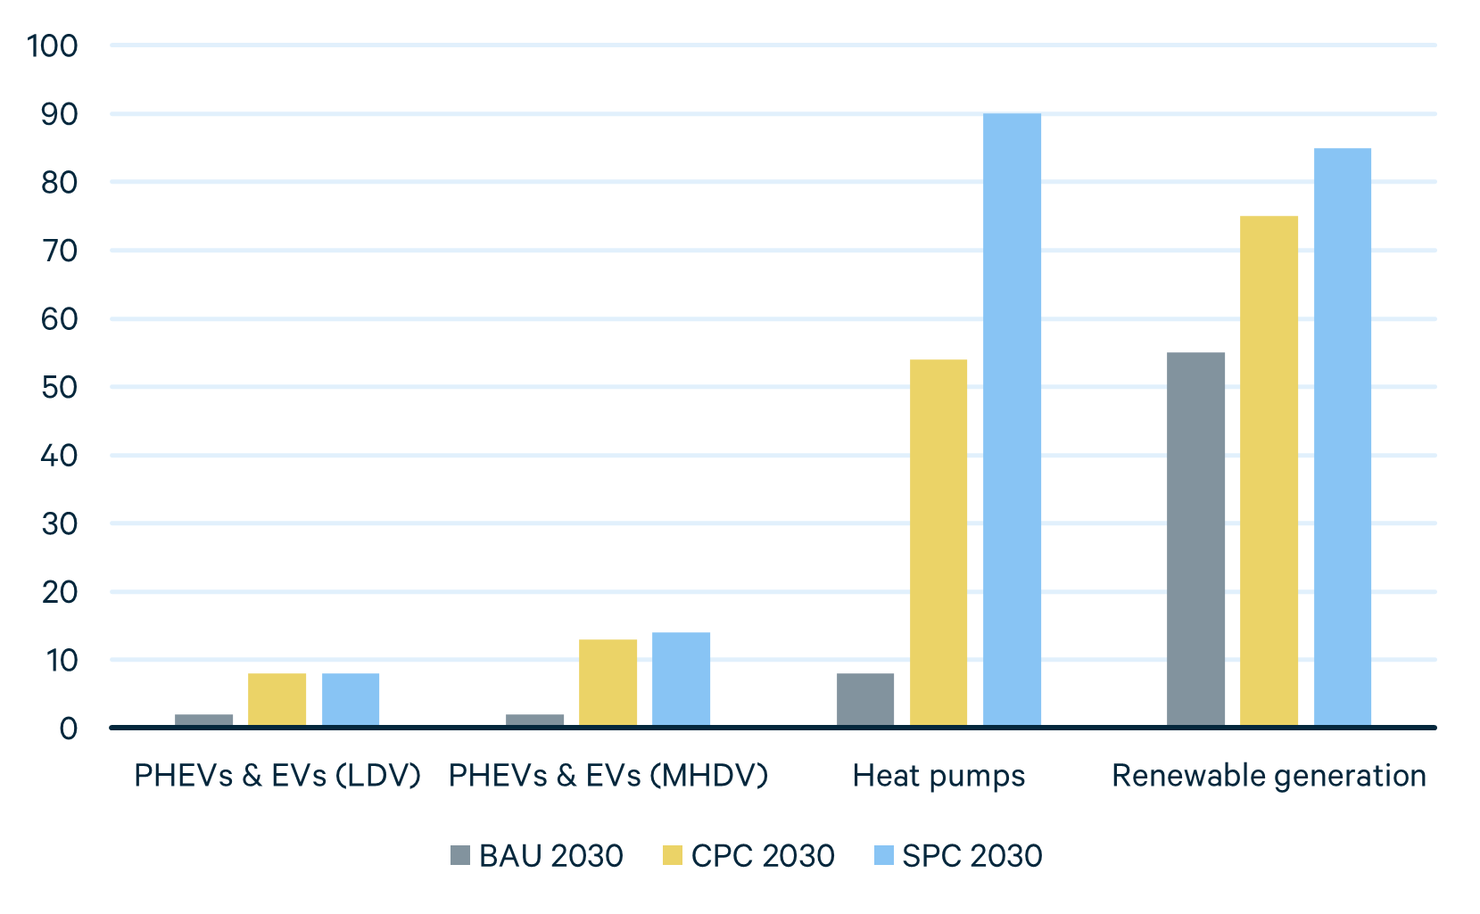
Heat pump adoption is also higher in both policy cases relative to the BAU. The SPC has the highest heat pump subsidies for low- and middle-income households; the CPC subsidy level is more modest. The SPC also includes a ban on new gas furnace purchases, rapidly phasing out fossil fuel heating. This leads to an approximately 90 percent heat pump adoption rate in the SPC, compared with a 54 percent adoption rate in the CPC. In addition to the statewide adoption rates, we find a range of adoption across counties in each case. For instance, the adoption rate varies across counties from 77 to 96 percent in the SPC, from 27 to 78 percent in the CPC, and from 2 to 15 percent in the BAU case. The higher adoption rates tend to be in the southeastern part of the state, such as Staten Island and Long Island.
Both policy cases also encourage adoption of light-duty zero-emissions vehicles (ZEVs). In the BAU, New York has about 241,000 EVs—about 2 percent of all on-road vehicles. The CPC and SPC yield roughly four times more EV sales than the BAU, driven by their more ambitious ZEV standards. Compared with the BAU, the policy cases also increase the average fuel economy of on-road vehicles by about 15 percent. The largest difference between the policy cases is in fuel consumption, which is driven by the different prices on carbon emissions. Fuel consumption is about 6 percent lower in the CPC and 12 percent lower in the SPC compared with the BAU. The SPC reduces fuel consumption more than the CPC because of its higher carbon price.
Similar to the light-duty vehicle findings, the mandate for zero-emissions medium- and heavy-duty vehicles (MHDVs) is a primary driver of the shift to a cleaner fleet. Because of the MHDV ZEV rule (see Table 1), by 2030, it is expected that about 14 percent and 13 percent of the fleet will be ZEV (mostly battery electric) in the SPC and CPC, respectively. Key drivers of the difference between cases (although small) are the more ambitious ZEV sales mandate and carbon price, as well as the copollutant fees, of the SPC; and the low-carbon fuel standard program (LCFS), which is specific to the CPC. Our findings suggest that significant financial incentives will be required to achieve the desired ZEV adoption. The models estimate that the various fees considered (on carbon, copollutants, and internal combustion engine vehicles) and the existing BAU vehicle incentives programs (e.g., New York City Clean Truck, New York Truck Voucher Incentive Program) will not be enough to fulfill the mandate.
Both policy cases increase total New York electricity demand because of the high rates of electrification in the residential and transportation sectors. Under the CPC, electricity demand increases by 17 percent, and under the SPC, by 29 percent, compared with the BAU. This leads to greater generation needs and contributes to higher electricity prices.
Our research did not include a comprehensive cost-benefit analysis, but we can observe that the more ambitious investments in the SPC are associated with higher costs. Both policy cases lead to modest increases in wholesale electricity prices, compared with the BAU (a 10 percent increase for the CPC and an 18 percent increase for the SPC). The subsidy levels for heat pumps for low- and middle-income households are much higher in the SPC than in the CPC, leading to higher government spending. The higher carbon price in the SPC also contributes to higher fuel costs, which reduces vehicle miles traveled in the transportation sector.
5.2. Greenhouse Gas, PM2.5, and Precursor Emissions ResultsGreenhouse Gas, PM2.5, and Precursor Emissions Results
Emissions of multiple types are expected to decline as a result of the CLCPA. That said, the different policy cases lead to significantly different emissions outcomes. For example, in 2030, CPC carbon emissions reductions are about 30 percent below the BAU, and SPC carbon reductions are estimated to be about 54 percent below the BAU. The 2030 percentage reduction below the BAU for methane is even more dramatic in the SPC (91 percent reduction) than in the CPC (31 percent reduction).
PM2.5 and precursors are also significantly affected by the different policy cases. The CPC creates estimated statewide reductions below the BAU of 25, 18, and 42 percent for SO2, NOx, and direct PM2.5, respectively. The SPC creates estimated reductions of 52, 32, and 75 percent for the same pollutants, relative to the BAU. Figure 3 shows statewide 2030 emissions for the three sectors we model under each case.
Reduced natural gas generation in both policy cases, relative to the BAU, leads to significant electricity sector emissions reductions in 2030. CPC policies reduce New York power plant NOx and SO2 emissions by smaller proportions than the other emissions types because waste-fueled generation accounts for large portions of the state’s power plant NOx and SO2 emissions, and the CPC policies do not appreciably change waste-fueled generation. Even in the BAU, waste-fueled generation accounts for more than half of New York power plant NOx and SO2 emissions, despite producing less than 10 percent as much generation as natural gas does. The reduction of waste-fueled generation in the SPC is a significant contributor to the emissions reductions in that scenario.
Emissions across Policy Cases, by Sector, 2030
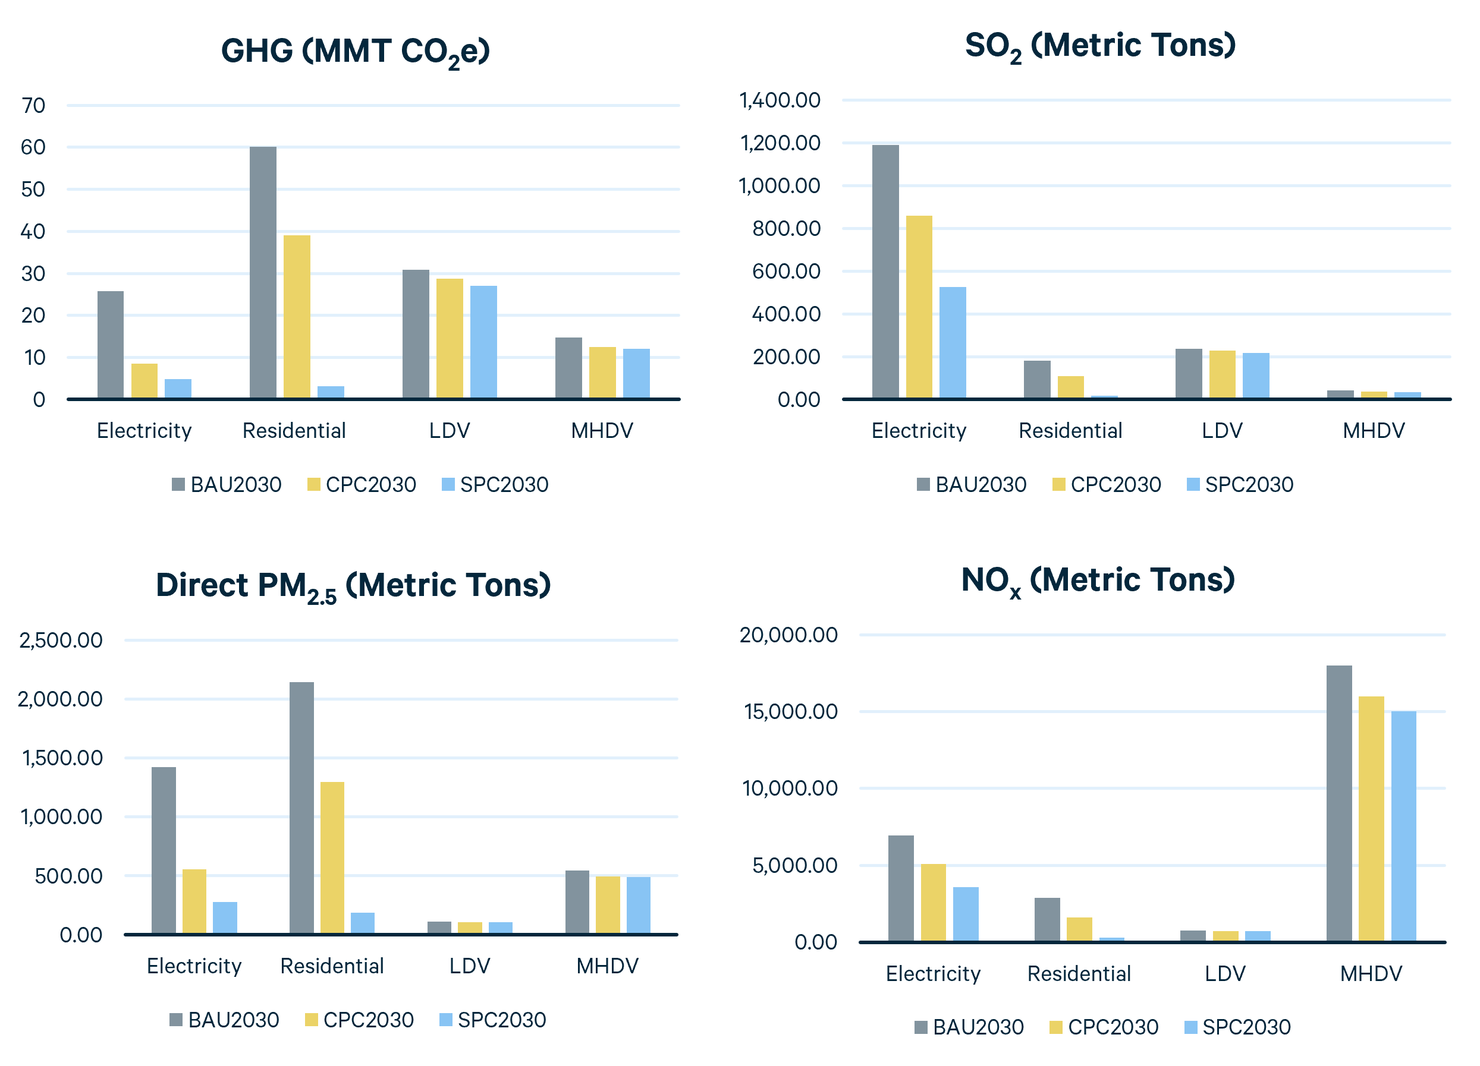
Similarly, in the residential building sector, both GHGs and local air pollutants decline under both scenarios because of reductions in fossil fuel (natural gas and diesel) use for heating. Although emissions decline under both scenarios, SPC reductions in both GHGs and local air pollutants associated with the residential sector are more than double those of the CPC, with 90 to 100 percent reductions from the BAU across the various emissions types. These emissions changes are the result of the adoption of electric heat pumps (Figure 2).
For light-duty vehicles, the emissions changes are more modest than for the other sectors because of minimal vehicle stock change by 2030. The CPC reduces CO2 emissions by 6 percent and the SPC by 12 percent below the BAU—the same as the fuel consumption reductions reported above. Methane (from incomplete combustion and upstream fugitive emissions associated with gasoline production and distribution) accounts for a trivial share of light-duty vehicles’ GHG emissions. Compared with the BAU, the CPC and SPC reduce direct PM2.5 emissions of NOx and SO2 by small amounts (3 to 8 percent across the two cases). The SPC does reduce emissions by about double the CPC, although the reduction is still modest (e.g., 4 percent in the CPC versus 8 percent in the SPC for SO2; see Table I-1 in Appendix I). The main policy driving this difference is the ZEV standards, since EVs do not emit these pollutants directly when running on electricity.
The medium- and heavy-duty vehicle sector is also estimated to have reduced emissions by 2030, but the differences between the two policy case implementations are small. The CPC reduces CO2 emissions by 16 percent and the SPC by 18 percent below the BAU (reductions in methane are similar; see Appendix H), primarily resulting from the penetration of ZEVs, with the SPC having a slightly larger share of ZEVs by 2030. From the BAU, the CPC achieves a further reduction of 15 percent for SO2, 11 percent for NOx, and 8 percent for direct PM2.5; the SPC reduces these emissions by 18, 17, and 10 percent below the BAU, respectively (see Table I1 in Appendix I).
5.3. Location of Emissions Changes
As stated above, the focus of this study is to estimate how New York climate policy affects PM2.5 pollution exposure in disadvantaged communities. This requires analyzing emissions—and ultimately air quality—by location, going beyond the statewide emissions estimates described above. This is because pollution is not spread uniformly across the state: where you live matters in terms of the air you breathe, which is a key aspect of environmental justice. To get at this geography of pollution (and related disparities in pollution exposure), we begin by studying where emissions occur—emissions from burning fossil fuels (and some waste and biomass) to generate electricity, heat homes, and power heavy trucks and passenger vehicles on New York roads. Identifying the location of emissions is a prerequisite for determining where pollution ultimately settles (after being mixed and morphed in the atmosphere), which is how we determine the geography of air quality and associated public health implications, discussed below. It is important for the reader to make a clear distinction between emissions and air quality—a distinction we will continue to discuss.
This section covers details about where emissions changes take place, to the greatest level of spatial detail possible. For simplicity of presentation, we restrict our discussion to direct emissions of PM2.5, even though the models predict changes in NOX, SO2, and VOCs (and other pollutants). We focus on direct PM2.5 because it has the greatest impact on local air quality. The extent to which other pollutants combine to form secondary PM2.5 is covered in the following section, Air Quality Results.
A number of our models indicate the largest emissions reductions (by mass) tend to occur in densely populated areas. This stands to reason, since the more people who live in an area, the more fuel combustion tends to take place. This is especially the case for sectors like transportation and residential buildings, where fuels are burned (resulting in emissions) in the location where the population is concentrated.
This trend is reflected in Figure 4, which shows the estimated direct PM2.5 emissions reductions (in 2030) from LDVs under the CPC. As we can see, the deeper emissions reductions (darker plots) are located around New York State’s metropolitan areas—especially New York City, Buffalo, Rochester, and Syracuse. It is worth noting that in the CPC, subsidies are not targeting these metro geographies—in fact, the model shows relatively uniform percentage reductions in fuel use and emissions across the state. Simply the fact that there are more people in metro areas means that these uniform percentage reductions lead to larger quantity reductions. These trends continue under the SPC (see Appendix J).
It is also evident from Figure 4 that many DACs are located in these metro areas, which means this trend is estimated to provide above-average benefits to DACs. That said, there are numerous DACs located outside metro areas, and these DACs are estimated to experience smaller emissions improvements associated with changes to the passenger vehicle fleet (however, this is also because nonmetro DACs experience less LDV pollution in the first place). It is also important to observe that although nonmetro DACs may see less emissions reductions from LDVs, none experience an increase in LDV emissions.
Light-Duty Vehicle Direct PM2.5 Emissions, BAU vs. CPC, 2030
Key Findings for Figure 4
- Relative to the BAU, the CPC leads to direct PM2.5 emissions reductions from LDVs across the state.
- No regions experience increases in direct PM2.5 emissions from LDVs.
- Direct PM2.5 emissions reductions from LDVs are most pronounced in New York City and other high-density areas.
We see some of this same population density-driven trend in emissions changes (around metro areas) from the residential sector under the CPC. However, as shown in Figure 5, other factors influence the distribution of emissions. For example, in addition to population density, the means testing of heat pump subsidies (favoring low-income households) leads to greater emissions reductions in low-income communities. The heterogeneity in building conditions, climate, and other household attributes also influences the adoption of heat pumps and resulting emissions reductions.
As with LDV emissions, we see that a large number of DACs experience sizable benefits associated with residential emissions reductions. And again, although some DACs experience more modest benefits, we do not observe any DACs that experience an increase in residential emissions.
Figure 5. Residential Home Heating Direct PM2.5 Emissions, BAU vs. CPC, 2030
Key Findings for Figure 5
- Relative to the BAU, the CPC leads to direct PM2.5 emissions reductions from residential heating across the state.
- No regions experience increases in direct PM2.5 emissions from residential heating.
- Direct PM2.5 emissions reductions from residential heating are most pronounced in high density areas like New York City.
Figure 6. Medium- and Heavy-Duty Vehicle Direct PM2.5 Emissions, BAU vs. CPC, 2030
Key Findings for Figure 6
- Relative to the BAU, the CPC leads to direct PM2.5 emissions reductions from MDHVs across the state.
- No regions experience increases in direct PM2.5 emissions from MDHVs.
- Direct PM2.5 emissions reductions from MDHVs are most pronounced along major highways.
One of the limitations of the LDV and residential models is that they estimate emissions at a somewhat coarse geographic scale (at the county level for the LDV model, and at the level of the public use microdata area, or PUMA, for the residential model). This limits the ability to identify more localized differences in pollution exposure. This limitation can really matter for something like transportation emissions, where pollution exposure is often a function of how close one is to a specific highway or port depot—a level of geographic granularity that goes below the county or PUMA level.
The MHDV model provides this finer geographic granularity. For the MHDV fleet, emissions were estimated for each major road segment (“network link”) along the primary and secondary highway system in New York (see Appendix E). In this analysis of the location of emissions changes, PM2.5 is displayed by census tract. Link emissions are attributed to census tracts based on what percent of the link is in each tract.
As shown in Figure 6, there is some clustering of emissions reductions around metro areas; however, the predominant trend is emissions reductions along highways—the major intercity corridors. This is mainly because the majority of long-haul heavy-duty truck traffic occurs on these highway network links, and so any vehicle improvements (and associated emissions reductions) made to the MHDV fleet will be concentrated on those highways.
A large percentage of DACs clustered in the urban core of cities (e.g., in Brooklyn and parts of Manhattan) are not located near these major intercity corridors, and so they are estimated to experience less benefit from MHDV emissions reductions. However, a number of nonmetro DACs that experience relatively modest emissions reductions from policies affecting residential buildings and LDVs (above) are estimated to see some of the largest benefits from policies affecting the MHDV fleet. Indeed, there is a close correlation between the location of many nonmetro DACs and New York’s intercity highway system (and therefore the deepest MHDV emissions reductions). This could partly be due to the fact that one of the criteria for designating DACs (as determined by the New York CJWG) is high exposure to traffic. No census tracts experience an increase in PM2.5 emissions, and reductions are greater under the SPC than in the CPC, following largely the same geographic distribution.
Our estimates of electricity emissions are even more geographically granular than the MHDV model, with the specific location of each power plant represented in the E4ST electricity sector model (see Appendix E). Figure 7 shows the location of 2030 emissions reductions from implementing the CPC, with green dots representing a decrease in power plant emissions at a given location and red dots indicating an increase in emissions (this is the first sector where we observe emissions increases).
Figure 7. Change in Direct PM2.5 Emissions, by Electric Power Generator, BAU vs. CPC, 2030
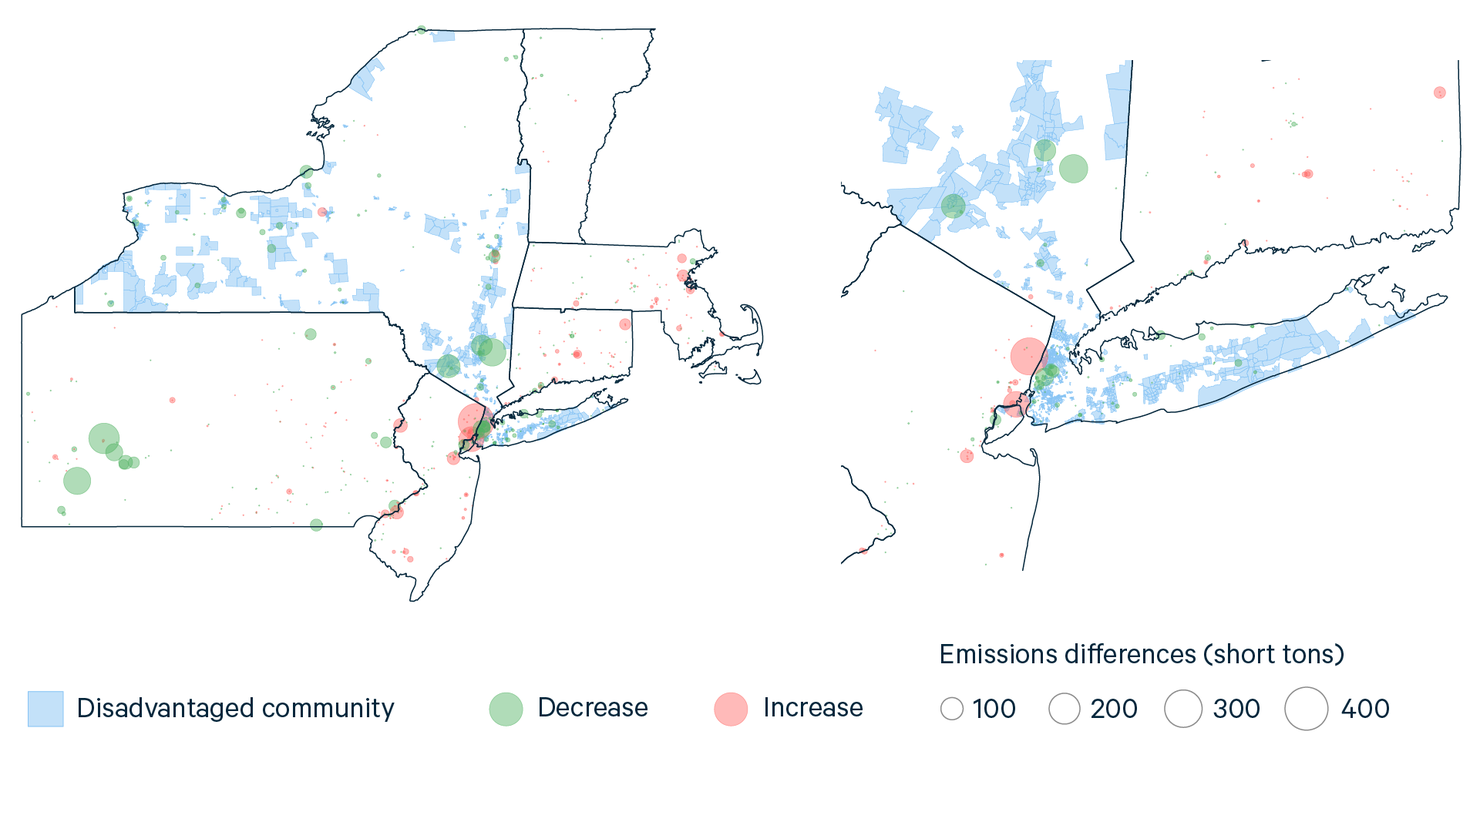
Key Findings for Figure 7
- Most of the power-generating units in New York decrease their direct PM2.5 emissions in the CPC relative to the BAU (green dots).
- The largest decreases are at generating units close to or in New York City.
- Emissions change at many generating units outside the state; some of the largest increases occur at generating units close to and upwind of New York City (e.g., in New Jersey); the largest out-of-state decreases occur at coal-fired generating units in Pennsylvania.
For the electricity sector, we show estimates for adjacent states as well because New York policy has a greater effect on out-of-state emissions in the electricity sector than in other sectors, and because electricity emissions get dispersed over a broader geographic area than emissions from the other sectors we model because of the tall smokestacks at power plants. Given this, New York electricity policy changes would affect emissions both in New York and in other states and Canadian provinces.
Just comparing the number of green and red dots, we can see that although most power-generating units in New York State decrease emissions in both policy cases relative to the BAU (green dots), the CPC results in a fair number of power-generating units that increase emissions (red dots); however, they tend to be small increases, and many are located out of state.
Examining the size of the dots, we see that the largest decreases in emissions are at power plants close to or in New York City—again reflecting a trend of emissions reductions near population centers. As with other metro-centered reductions, the concentration of emissions reductions near the New York City region is beneficial for public health, since that is the most densely populated part of the state. However, while the metro region is estimated to experience reductions at in-state plants, just over the border in New Jersey, emissions increases are expected.
Looking at the dots outside New York State, we find that emissions both increase and decrease at many power-generating units. This holds for both policy cases. The largest increases are at those New Jersey generating units that are close to and upwind of New York City, and the largest decreases occur at Pennsylvania coal-generating units that are also upwind of the state but farther away. Out-of-state emissions in the region may be impacted by changes in program ambition of the Regional Green House Gas Initiative, which caps carbon emissions from the power sector, or IRA subsidies, which provide incentives for clean energy.
In terms of how these emissions changes may affect New York communities, as stated above, reductions or increases in the New York City metro area will tend to have significant public health effects because of its population density. New York City is also where many DACs are located, and so emissions changes will have a significant impact on DACs: if emissions decline in that area, many DACs will benefit, and if emissions increase, many DACs will be harmed. However, because of the stack heights of power plants and the tendency of their emissions to be carried long distances by prevailing winds, the pollution exposure in a given community may not be directly linked to emissions changes at local power plants. To produce a more accurate estimate of pollution exposure at the community level, we must go from estimating emissions by location to estimating air quality by location, which is the next step in our analysis.
5.4. Air Quality Results
Our research goes beyond economic and emissions impacts to identify local air quality effects of the policy cases we studied. The key difference between emissions changes and air quality is that the latter reflects how and where emissions actually accumulate, after being transported and transformed by weather patterns and by mixing with other pollutants. Air quality is more relevant for human health because it looks at the composition of the air people breathe, instead of emissions flows from a source of pollution.
Our air quality analysis combines the geographic emissions information discussed above with scientific information about how meteorological patterns and chemical processes contribute to the distribution of pollutants. The air quality modeling approach we use (one of the most technically advanced in the field; see Appendix C) estimates average hourly PM2.5 concentrations at the 4km2 grid level. In many ways, this is a large area for thinking about community-level air quality impacts, but we determined that it was the most geographically granular estimate feasible. It is possible to model changes at 1km2, but our modeling team felt it presented the risk of “false precision,” where results would indicate a greater amount of accuracy than scientifically justified. Our estimates at 4km2 were determined to maximize geographic granularity without imposing false precision. Our results cover the overall air quality changes in New York State and specific community comparisons that highlight outcomes for different types of disadvantaged communities. For the full methodology for the air quality modeling process, see Appendix C.
5.4.1. Air Quality Changes in Each Policy Case
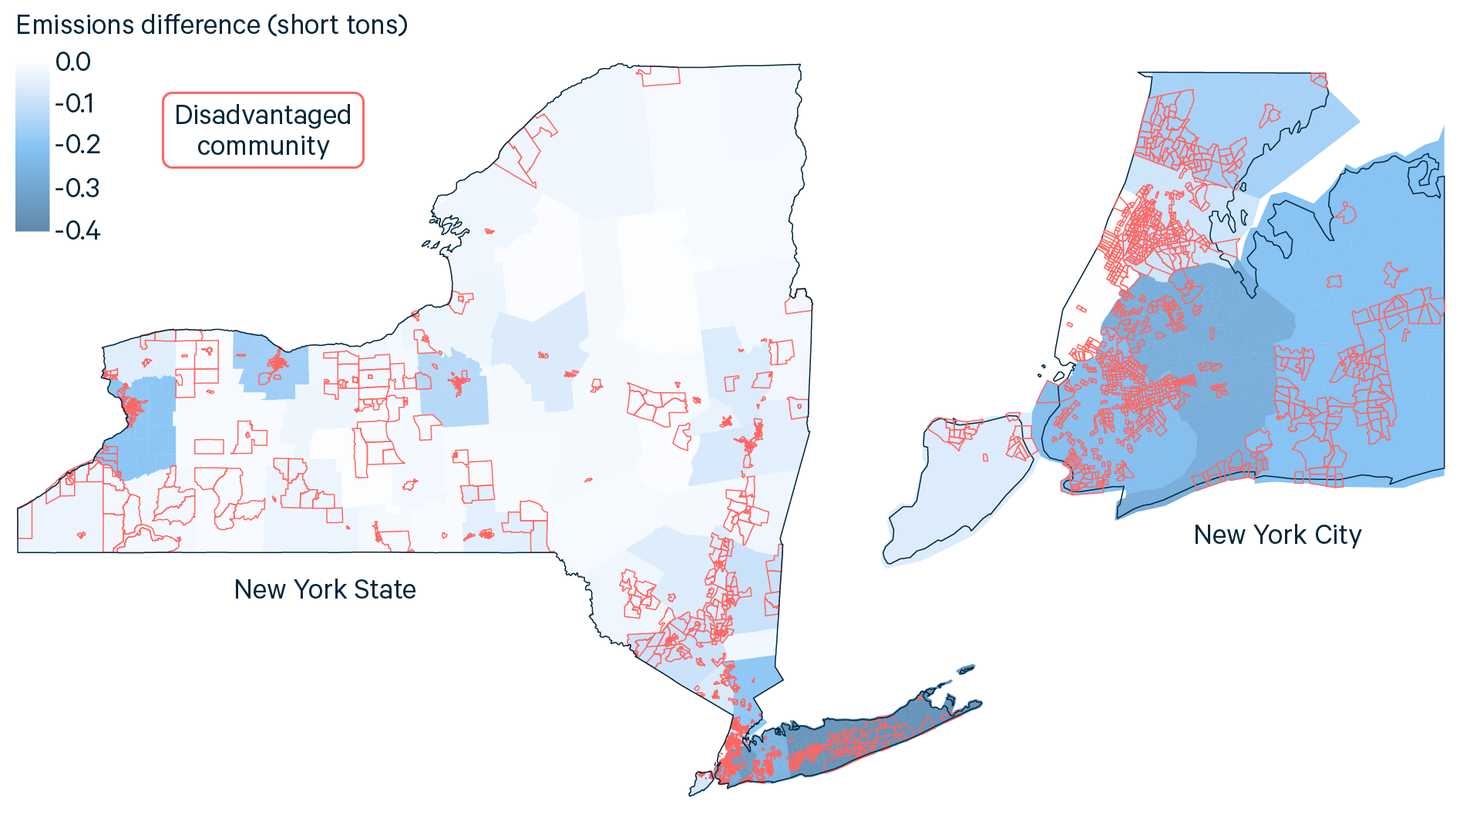
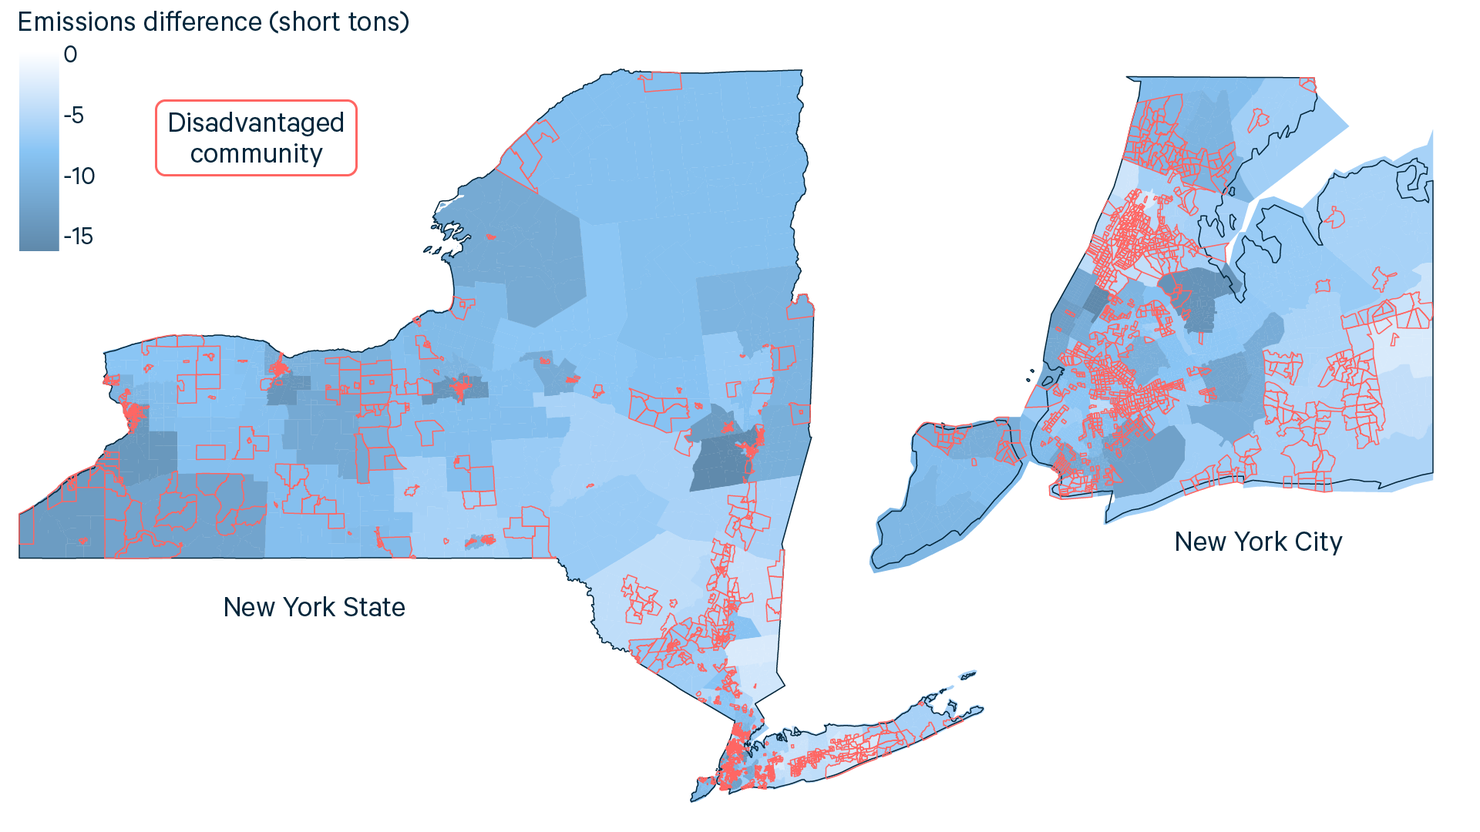
Figures 7 and 8 show changes in 2030 average hourly concentrations of PM2.5 at the census tract level across the state, with a more detailed view of New York City. Our air quality model (see Appendix C) estimates the PM2.5 concentration in every hour of 2030 for each 4km2 grid cell in the state of New York. We then estimate the 2030 average hourly concentration for each 4km2 cell, which is mapped onto each census tract. Therefore, Figures 8, 9, and 10 reflect differences in 2030 average hourly PM2.5 concentration levels for each tract. Darker colors in these figures indicate greater reductions in PM2.5 concentrations and hence greater improvements in air quality. For both policy cases, improvements are highly concentrated in high-density areas, particularly New York City. This reflects emissions changes discussed in Section 5.3. Location of Emissions Changes (above), which explains how increased heat pump and electric vehicle adoption tends to disproportionately benefit areas with high housing density and traffic congestion. Additionally, there tend to be more power-generating units built to service high-density areas. Though there can be more distance between generators and the demand they serve—and emissions from power plants can be spread over large distances—we do observe significant emissions reductions at power plants close to the New York City area. Although the darkest colors on the map occur mainly there, other urban areas also see more pronounced improvements relative to their rural neighbors.
One significant difference between the two policy cases is that the SPC achieves overall greater air quality improvements than the CPC. The population-weighted average PM2.5 concentration change from the BAU to the CPC is 0.03 µg/m3, with a range of 0.05 µg/m3 increase to 0.10 µg/m3 decrease. In comparison, the SPC achieves a population-weighted average reduction below BAU of 0.18 µg/m3, with a range of 0.04 µg/m3 increase to 0.40 µg/m3 decrease. The averages and ranges of PM2.5 concentrations are quite striking, and there is much greater variation in the SPC, which has a standard deviation of 0.12 µg/m3. More information on variation in air quality improvements can be found in Appendix L. Very high air quality improvements in the New York City area are largely responsible for the difference in average air quality improvement in the two cases.
An additional important finding is that—as the ranges stated in the previous paragraph show—both cases cause air quality to worsen (increased PM2.5 concentrations) in some census tracts, and although the CPC causes a worsening of air quality in some DACs, the SPC does not erode air quality in any DACs. In the CPC, 296 tracts (of nearly 5,000) are predicted to have worse air quality than in the BAU, 72 of which are DACs. In the SPC, only three census tracts experience worse air quality, none of which are DACs.
Figure 8. New York PM2.5 Concentration Improvements, BAU to SPC, 2030
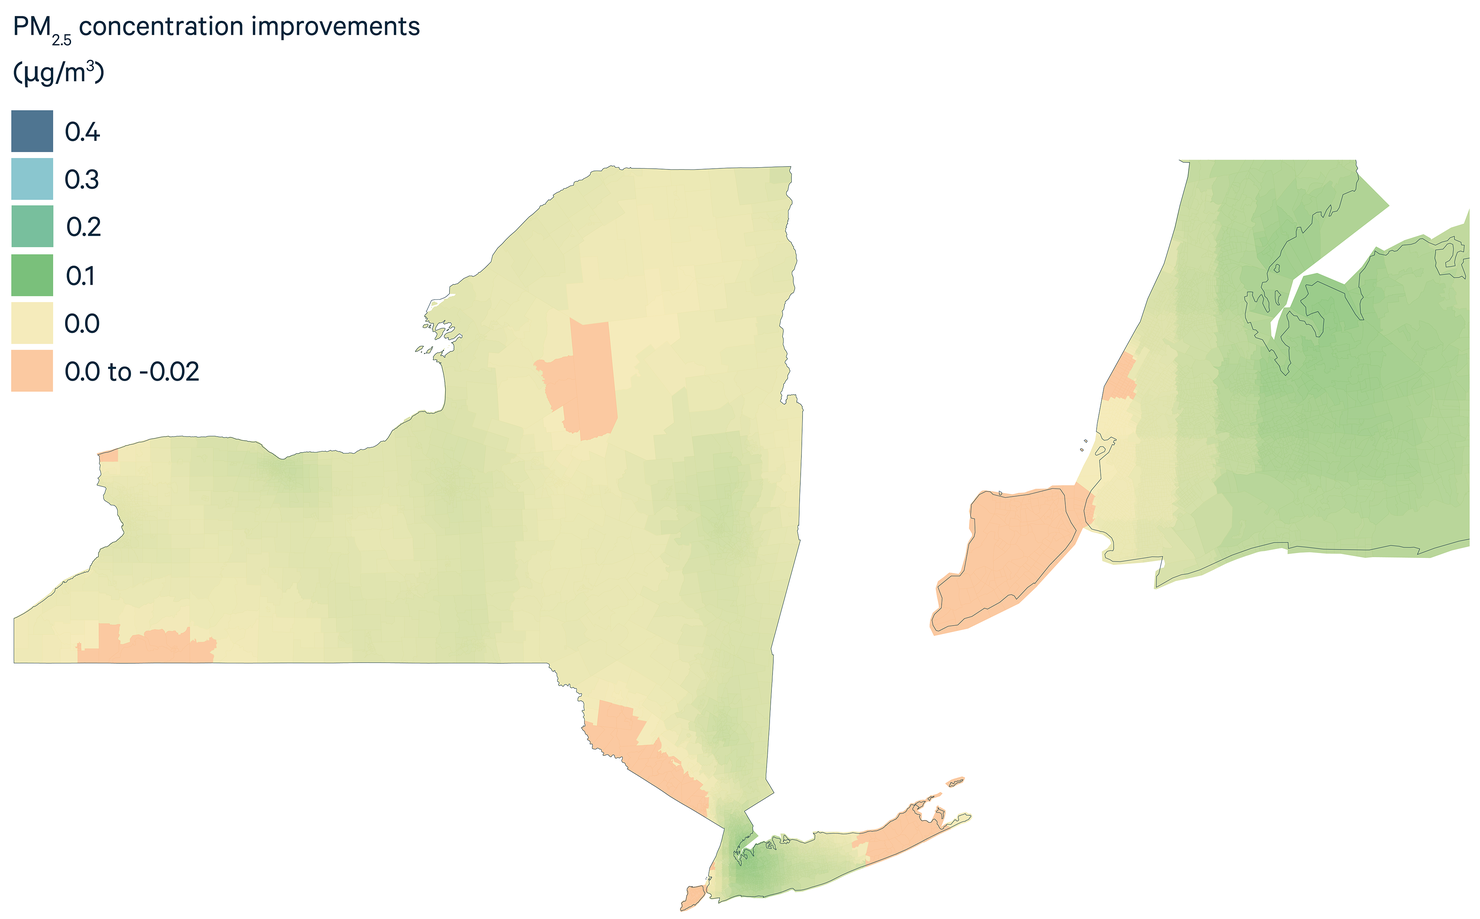
Figure 9. New York PM2.5 Concentration Improvements, BAU to CPC, 2030
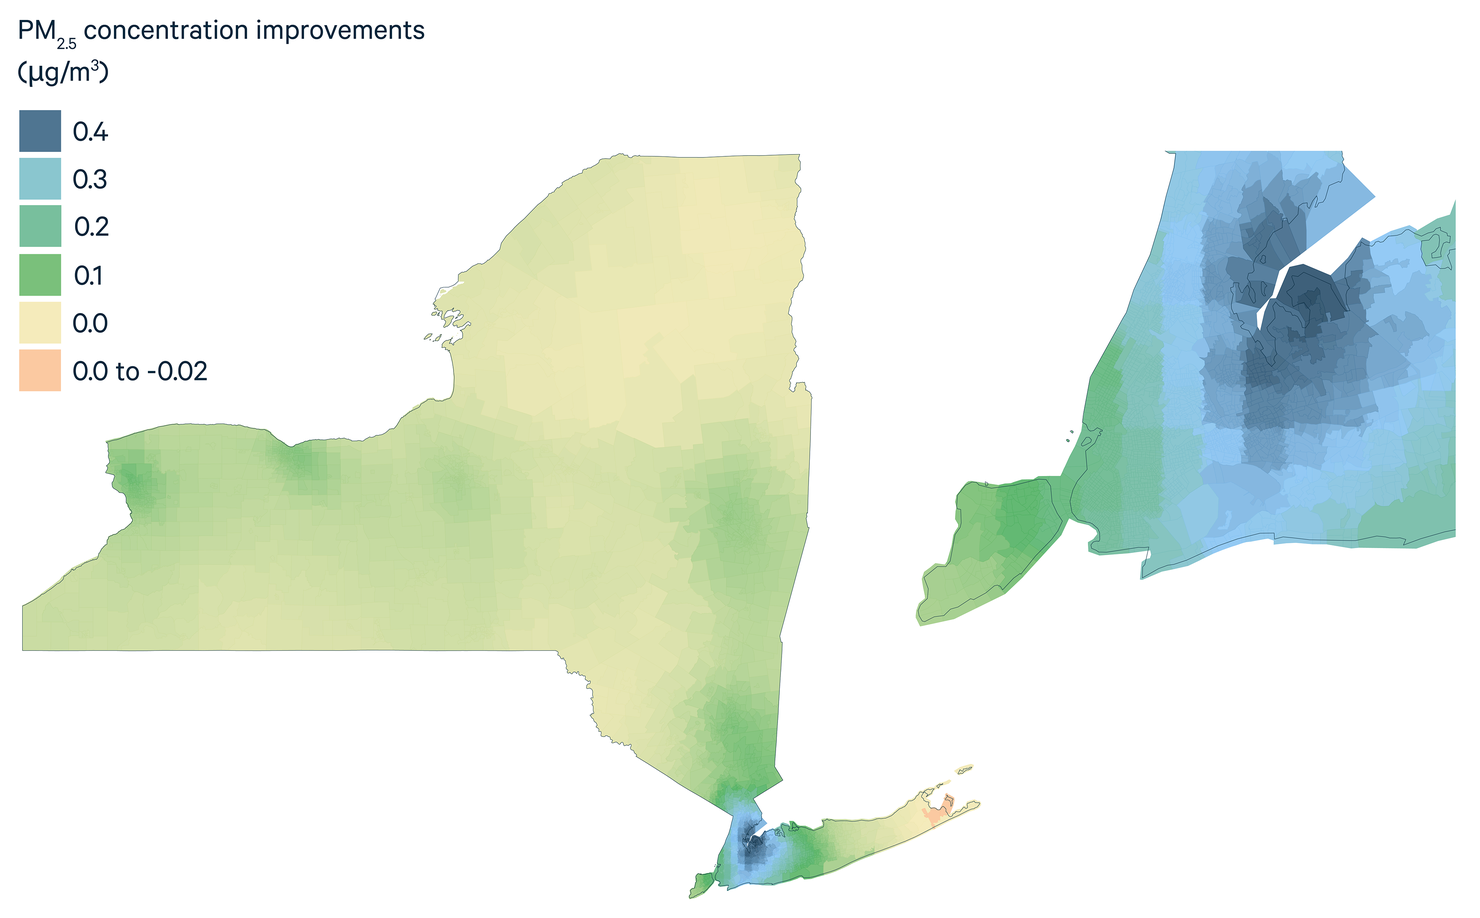
Key Findings for Figures 8 and 9
- Air quality improvements under the SPC are greater than air quality improvements under the CPC.
- Air quality worsens in more tracts under the CPC compared with the SPC; 72 of these tracts are DACs. The SPC does not erode air quality in any DACs.
- Air quality improvements are most concentrated in urban areas, with high population densities.
- Air quality improvements are more heterogeneous in the SPC, which has an even more dramatic spread between New York City and the rest of the state than the CPC.
5.4.2. Outcomes for Disadvantaged Communities
Although statewide results are critical to understanding overall impacts of potential CLCPA implementations, we also consider impacts across different types of communities—specifically, disadvantaged communities, as defined by the draft CJWG criteria, and non-DACs. Policies implemented as a part of the CLCPA may not harm or burden DACs, and emissions and pollution reductions in those communities must be prioritized.
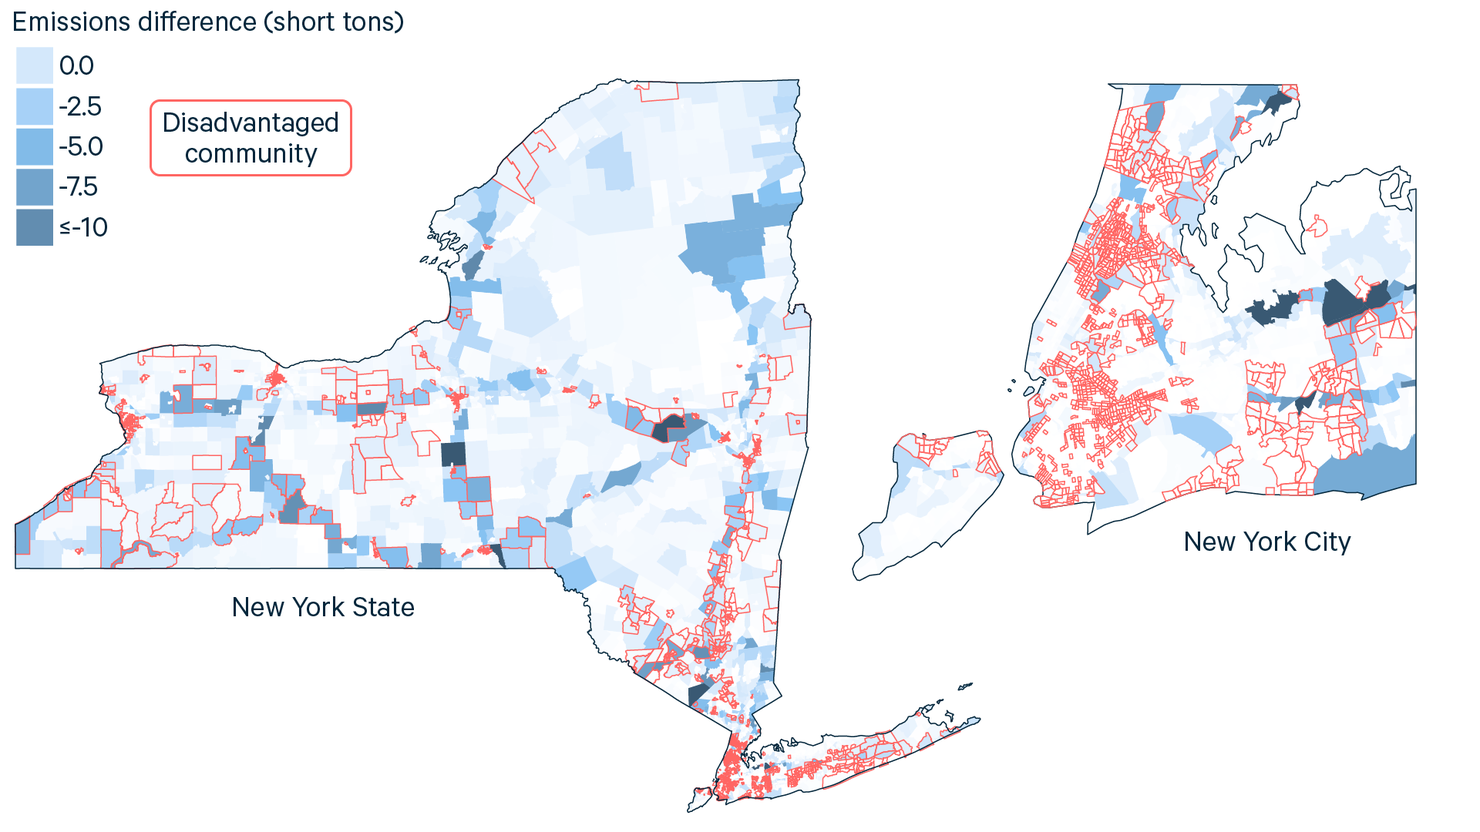
Figure 10. Air Quality Improvements for CJWG Community Types, CPC to SPC
Figure 10A. Disadvantaged Communities, Statewide and NYC
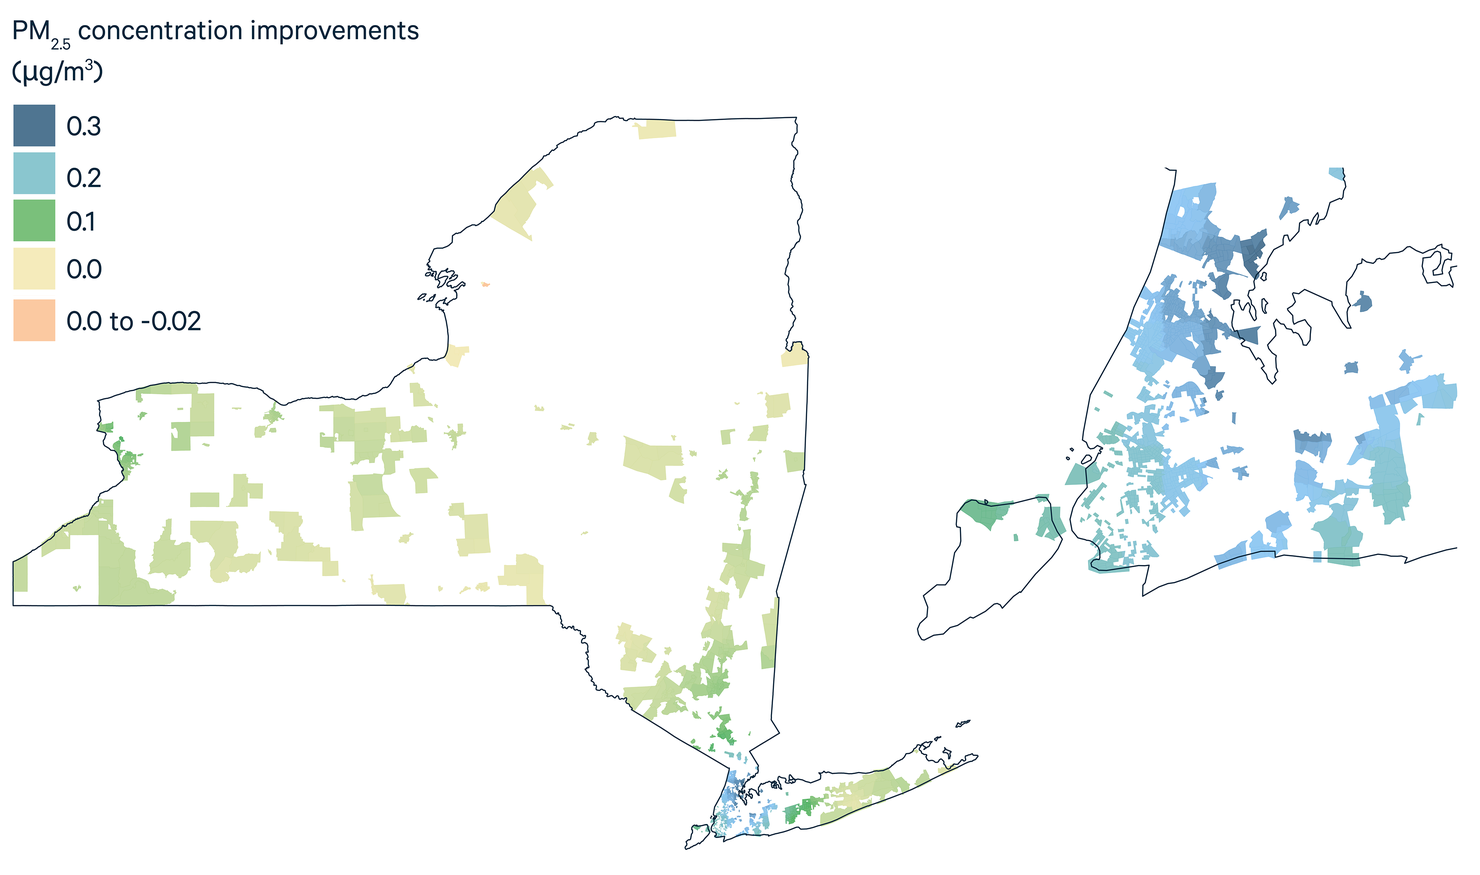
10B. Nondisadvantaged Communities, Statewide and NYC10B. Nondisadvantaged Communities, Statewide and NYC
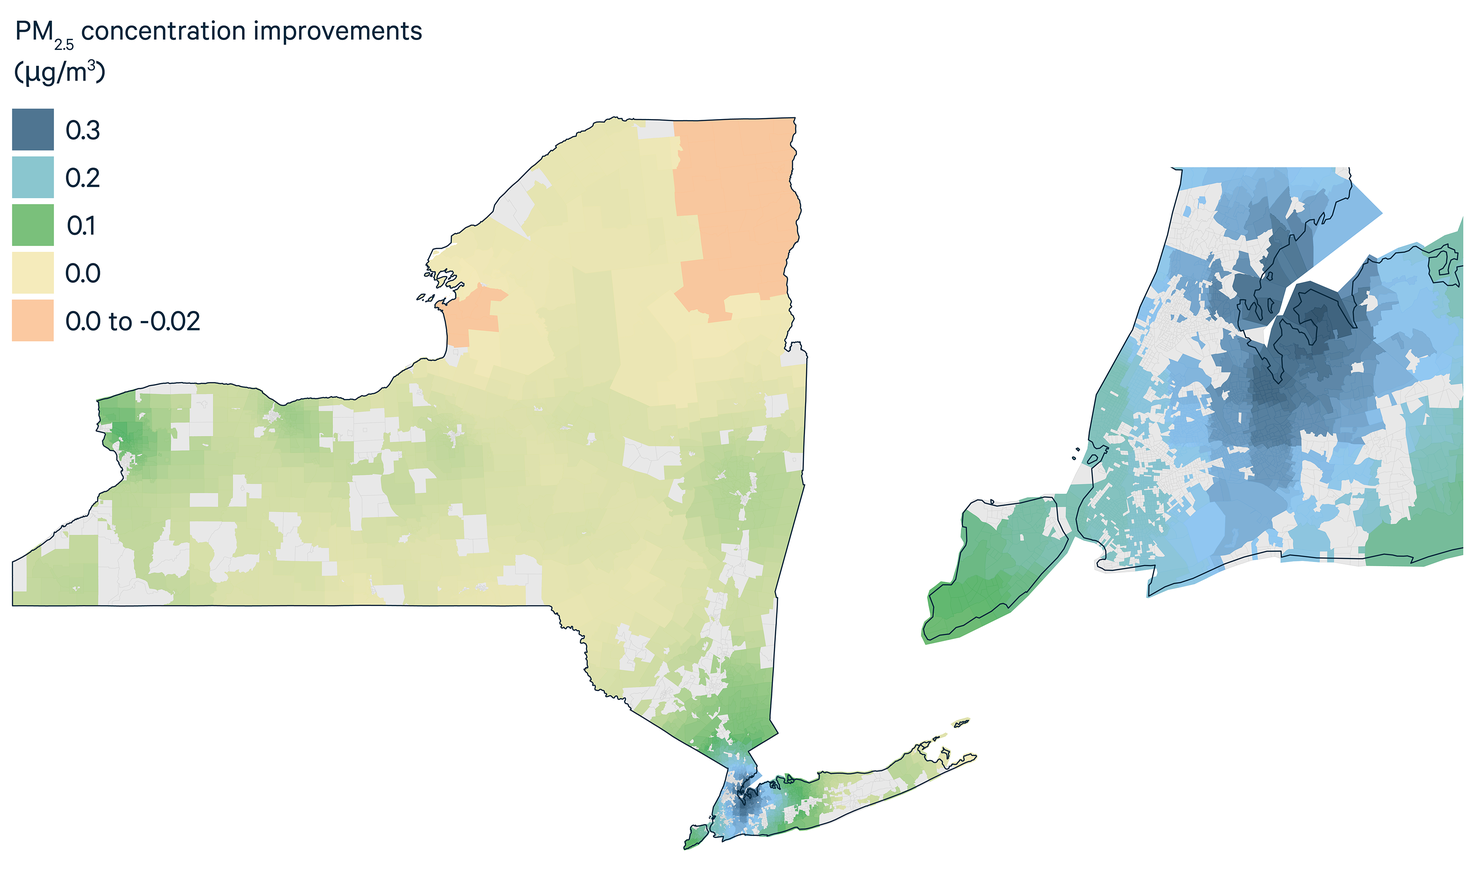
Key Findings for Figure 10
- Air quality improvements for DACs and non-DACs are more pronounced in the SPC.
- Greatest differences are observed in New York City, which has a high number of DACs.
- Differences in air quality improvements between communities are most strongly associated with their location in the state. The greatest improvements occur in the locations that have the highest baseline emissions and the poorest baseline air quality.
Figure 10 presents two maps of New York State, highlighting DACs (page 28) compared to all other communities (page 29). This helps illustrate how air quality differences are distributed across community types when comparing the CPC and SPC.
The average difference in PM2.5 concentrations between the CPC and SPC for DACs is 0.15 µg/m3, favoring the SPC. This is compared with an average difference of 0.14 µg/m3 for non-DACs, still favoring the SPC. These findings indicate that the additional air quality benefits associated with the SPC are relatively evenly distributed across DACs and non-DACs, as defined by the CJWG. More information on variation in air quality improvements for DACs and non-DACs can be found in Appendix L.
Table 2 shows more specific population-weighted improvements by subcategories of communities. These findings indicate that although the SPC improves air quality relatively equally among DACs and non-DACs, certain subcategories of disadvantaged communities see particularly pronounced improvements. We find that implementing the SPC (compared with the CPC) would provide higher-than-average benefits to communities with high socioeconomic vulnerability and communities with historically high PM2.5 exposure. (Population characteristics and vulnerability index are defined in Appendix D.)
Table 2. Population-Weighted Air Quality Improvements, by Community Type (PM2.5 µg/m3)
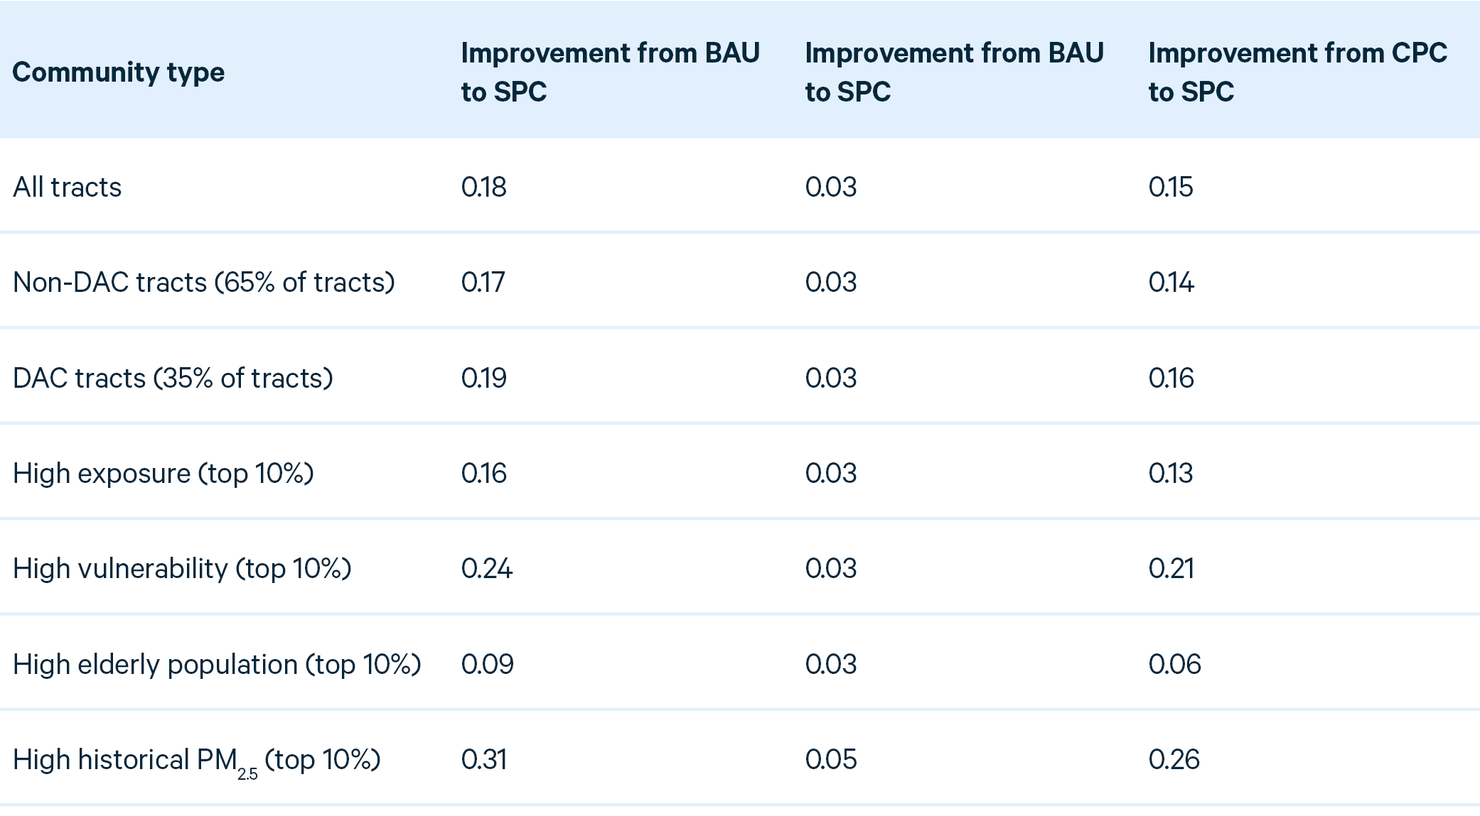
These findings indicate that a broad definition of disadvantaged communities that combines a long list of vulnerabilities and exposures could obscure dramatic changes in communities that are particularly vulnerable in only a few dimensions.
A final important finding is that even under the SPC, where air quality improvements are greater for DACs than for non-DACs, the improvements are not large enough to eliminate disparities in pollution exposure. Under the BAU, 2030 average hourly pollution exposure in DACs is 0.20 µg/m3 higher than in non-DACs, and this difference declines by only one one-hundredth (to 0.19 µg/m3) under the SPC. This same trend is evident when comparing non-DACs with high-exposure and high-vulnerability tracts; however, the relative improvements are greater for these groups. Note that this difference is smaller compared with our 2012 baseline, where PM2.5 concentrations in DACs were approximately 0.50 µg/m3 higher than in non-DACs.
5.4.3. Contextualizing Air Quality Changes
Despite very significant reductions in direct PM2.5 and its precursor emissions under the policy cases compared with the BAU, the changes in average hourly PM2.5 concentrations can be characterized as “small”—around 0.18 µg/m3 in the SPC against a baseline PM2.5 concentration around 7 µg/m3. Appendix K offers a variety of explanations for why this number may be more modest than expected. In this section, we provide context for the health implications of these changes, suggesting they still have significant benefits, particularly for Black New Yorkers.
Exposure to PM2.5 is a well-known killer leading to premature mortality in the over-30 population (Di et al. 2017; Krewski et al. 2009; Lepuele et al. 2012). Studies show that for a 10 µg/m3 reduction in PM2.5 concentrations, mortality risks to those 30 and older fall 6 to 14 percent from baseline mortality rates. Of course, 10 µg/m3 is a huge change in PM2.5: the National Ambient Air Quality Standard for PM2.5 is 12 µg/m3.
To contextualize our findings, we wanted to roughly estimate how the expected air quality changes could improve health outcomes. To do this, we consider the difference in the population-weighted change of PM2.5 concentrations we see across the state in the SPC compared with the BAU—around 0.18 µg/m3. Holding constant the state’s current over-30 population of 15 million people and using the national death rate of 800/100,000 people, the total deaths avoided by implementing the SPC would range from 13 to 302 every year in which this change in air quality persists (relative to the BAU).
We can provide additional context if we focus on the data we have on New York City’s elderly (65 and over) population by race and ethnicity. We focus on the city because this area would see the largest reductions in PM2.5 concentrations—around 0.4 µg/m3. In addition, there are profound racial and age differences in both the mortality rates and the relationship we noted above between PM2.5 and the percentage change in mortality rates (termed a concentration-response factor, or CRF; see Di et al. 2017). To make these new calculations, we use population by age and race, CRFs by age and race, and baseline mortality by age and race, as well as the New York City PM2.5 change in the SPC of 0.4 µg/m3 compared with the BAU. We have age and race population data for the city’s five counties, we have national-level CRFs from a major PM2.5–mortality study (Di et al. 2017) for people 65 and over and for five racial categories: white (non-Hispanic), Black (non-Hispanic), Hispanic, Asian, and Native American. The CRFs for the national population are shown in Table 3 and are far larger for Blacks than for other groups, with whites having the lowest CRF.
Table 3. Concentration-Response Factors and Mortality Rates, by Race and Ethnicity
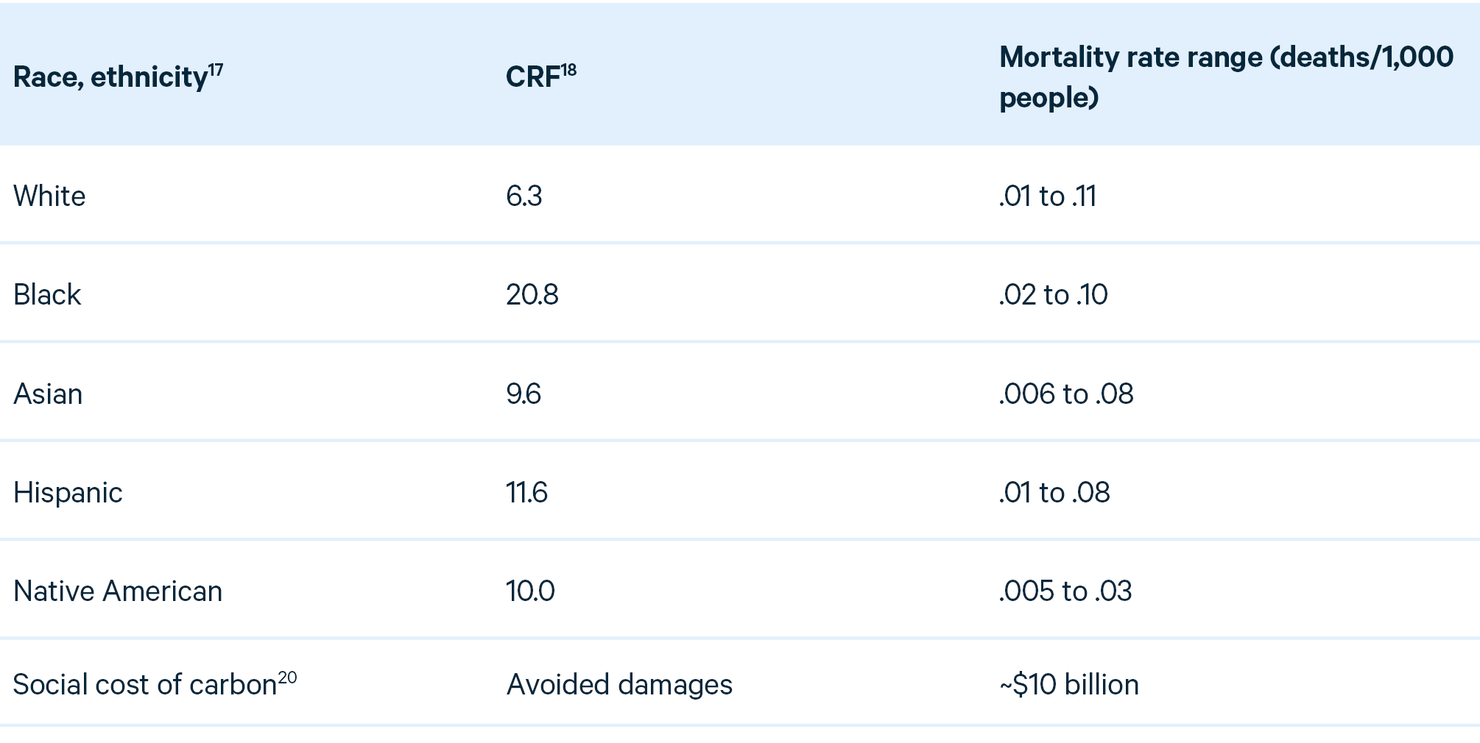
We include racial and ethnic groups for which we have data. In terms of statistical significance of the CRFs by race, Di et al. (2017) show in their Figure 2 that the CRF for Blacks is significantly larger than for all other groups and that the CRF for whites is significantly smaller than those for all other groups. CRFs for Native Americans, Asians, and Hispanics appear to be not statistically different from one another.
We also obtained mortality rates by age and race or ethnicity from the NYC death micro SAS datasets. Here again, we see that Blacks have another disadvantage compared with whites, Hispanics, and Asians, since their baseline mortality rates are higher than for these other groups for all three age categories. With PM2.5 being reduced, Blacks gain more health benefits than other groups. We apply these national data for the 65-and-over group to New York City’s elderly population, The baseline mortality rates are available by race or by age for NYC counties, but not both. Because of the complication that “white” and “Black” include Hispanics, we rely on Spiller et al. (2021), who estimated national mortality rates by race and ethnicity for whites, Blacks, and Hispanics age 65 and older. We use the available New York City data for Asians and Native Americans and scale the national data for Blacks, whites, and Hispanics to be applicable to New York City by adjusting these rates for the proportional difference between the Asian death rate nationally and Asian death rate in the city. which is 1.3 million people.
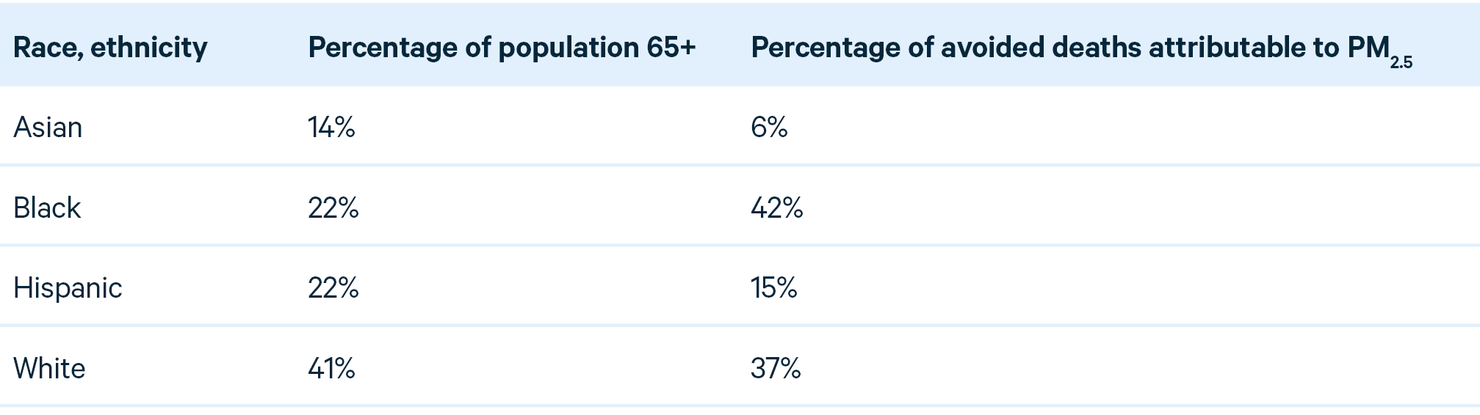
The bottom line: by implementing the SPC rather than the BAU, 160 deaths among New York City’s elderly are avoided in 2030, and the disparity by race or ethnicity disproportionately benefits Black New Yorkers. With Black New Yorkers making up approximately 22 percent of the city’s over-65 population, the deaths avoided for this group are 42 percent of the 160 total. In contrast, white New Yorkers make up 41 percent of the city’s over-65 population, with deaths avoided only 37 percent of all deaths avoided (Table 4).
Table 4. Avoided Deaths in New York City, by Race and Ethnicity, SPC Relative to BAU
In addition to estimating mortality effects of policy implementation, we investigate how a number of other health outcomes (“morbidity indicators”) would be affected by the SPC. To do this, we simply show the relationship between mortality avoided and various other health effects avoided, including asthma attacks, lost workdays, and restricted activity days. This relationship is taken from a table of results (Table 5-5) in the PM2.5 NAAQS Regulatory Impact Analysis for 2012 (EPA 2013). Using the ratio of the number of deaths avoided to the number of other health impacts avoided and multiplying by the approximately 206 deaths avoided in New York State from the SPC, we get the results shown in Table 5. The reduced number of asthma attacks, cases of chronic respiratory diseases, and restricted activity days is 100 times to almost 1,000 times greater than deaths avoided (Table 5).
Table 5. Annual PM2.5 and GHG Impacts, SPC relative to BAU
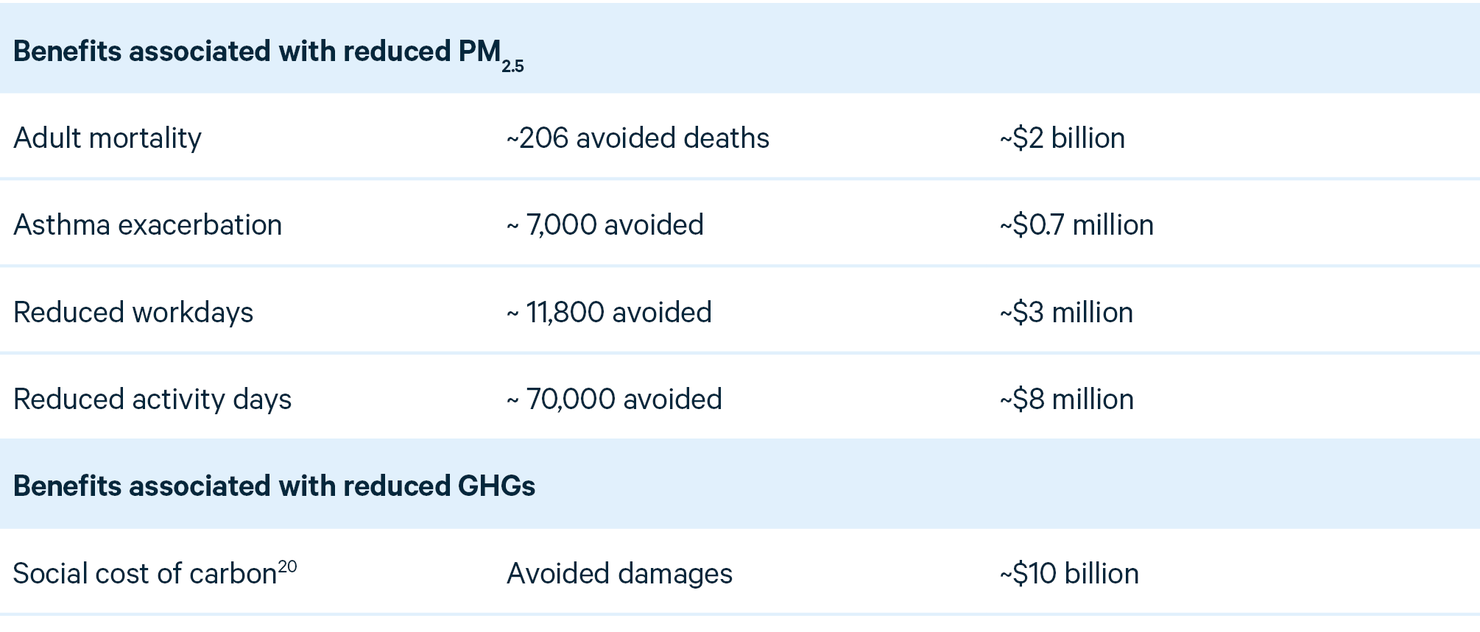
This is based on the NY social cost of carbon with a 2 percent discount rate ($137 in 2030).
We also quantify the health impacts as monetary savings, as the US Environmental Protection Agency did in its 2013 report. The mortality impacts are quantified using the value of statistical life, which is about $10 million (EPA 2023). The other health effects are quantified through cost savings, such as reduced hospital visits and recovered workdays. We estimate annual monetary savings associated with the SPC public health benefits we calculate (there are others) in the rightmost column of Table 5. Finally, the monetary benefits of the reductions in CO2 and methane emissions (81 MMT, see appendix I) are shown in the last row of the table, using New York State’s estimate of the social cost of carbon ($137/ton CO2 in 2030). Therefore, comparing the SPC with the BAU, the social benefits of GHG reductions would exceed $10 billion, and the health benefits of PM2.5 concentration reductions would exceed $2 billion.
6. Conclusion
This research project is one of the first to combine behavioral economic modeling with geospatially granular air quality modeling and stakeholder-driven demographic mapping to examine the air quality impacts of New York’s Climate Leadership and Community Protection Act for disadvantaged communities. One of the key goals for the research project is to assess which set of policies would maximize air quality benefits to DACs. Two implementations of the CLCPA are considered: a set of policies based on the New York Climate Action Council scoping plan, and a set of policies favored by the environmental justice stakeholder community, convened by our partners at NYC Environmental Justice Alliance. Our research reveals several insights about how implementation of the CLCPA may affect technology adoption, emissions, and subsequent air quality across the state between DACs and non-DACs. Generally, our research showed greater improvements for DACs in the stakeholder policy case compared with the CAC-inspired case.
Both cases result in substantial reductions in GHG emissions relative to a business-as-usual scenario modeled for the year 2030. But the stakeholder policy case results in greater reductions, not only in GHGs but also in emissions of NOx, SO2, VOCs, and direct PM2.5, which translates into greater reductions in PM2.5 concentrations across the state.
These results occur because the stakeholder case features more stringent policies than the CAC-inspired case, and because in most cases policies that reduce GHGs also reduce copollutants (including those traditionally referred to under the Clean Air Act as criteria air pollutants). Key policy drivers of the greater improvements in the stakeholder case are a higher price on carbon and copollutants, more generous subsidies for heat pumps targeted at low-income households, and stricter phaseouts of fossil fuels in the electricity and residential sectors.
In the strict letter of the law, both cases meet the CLCPA regulatory mandate to “not result in a net increase in co-pollutant emissions or otherwise disproportionately burden disadvantaged communities,” defining burden in terms of air pollution concentrations. However, although there is no statewide net increase in copollutant emissions, under both cases some communities (at the census tract level) do experience a worsening of air quality. And although this occurs in about 4 percent of DACs under the CAC-inspired case, no DACs are affected in the stakeholder case.
In general, DACs do better than non-DACs under the stakeholder case compared with the CAC-inspired case. This differential effect occurs in part because New York City and other cities experience disproportional PM2.5 concentration reductions compared with other parts of the state, and cities have a higher concentration of DACs.
Furthermore, if we focus on the communities that are the most vulnerable (according to a range of metrics), say in the 10th percentile of the state’s measure of social vulnerability, the stakeholder policies deliver even more favorable air quality improvements compared with the CAC-inspired policy set.
However, even though both policy cases make air quality improvements in DACs, neither reverses the historical disparity in air pollution: overall air quality in DACs continues to be worse compared with non-DACs, and this difference is even more pronounced in high-vulnerability communities (where air quality tends to be the worst).
Our focus is on air quality impacts, and it can be difficult to understand the importance of even small air quality differences. Therefore, as an aid in contextualizing our results, we approximate some public health implications of our estimated PM2.5 concentration changes, including, most prominently, annual deaths avoided. We also look closely at the elderly Black population in New York City relative to the elderly of other races and ethnicities, to account for this group’s increased vulnerability to poor air quality. We find that the greater air quality improvements in New York City, combined with its higher Black population and their greater vulnerability, lead to even greater health improvements than the statewide average would indicate.
Given all the benefits of the stakeholder case over the CAC-inspired case, it should not be surprising to see that this stakeholder case requires greater investment than the CAC-inspired case: its policies are more rigorous and offer more generous subsidies. For example, for residential heating, to achieve the much higher penetration of heat pumps observed in the stakeholder case, government subsidies need to be far higher than in the CAC-inspired case. In the power sector, a higher carbon price and a ban on new fossil fuel generation leads to slightly higher electricity prices. Although a full cost-benefit analysis was outside the scope of this work, previous regulatory analyses that evaluate stringency of GHG and air pollution policies often find that the environmental and health benefits of added stringency outweigh the costs. See recent regulatory impact analyses from the US Environmental Protection Agency, including Table ES-4 in the agency’s assessment of national air pollution standards for coal plants completed in 2023:
We see through this analysis that more ambitious policies are effective at decreasing emissions and improving air quality on a greater scale than more moderate policies. We also see that some disadvantaged communities benefit from the more aggressive policy case and begin to make up their deficit in environmental protection relative to non-DAC communities, although nearly all communities see benefits. By considering the impact on environmental justice communities, policymakers can ensure that historically underserved neighborhoods are protected and are able to experience the intended benefits of environmental policies.
Our findings show that more ambitious and more targeted climate policies yield the greatest benefits in climate change mitigation. The higher New York sets its policy sights, the greater the capacity for decreasing emissions and poor air quality. Because of these greater improvements in air quality and emissions, NYC Environmental Justice Alliance encourages the use of more ambitious and targeted approaches, like the policies modeled in the stakeholder policy case. These options provide a larger capacity for emissions reductions, which is critical to addressing the climate change crisis expeditiously.
Disadvantaged communities have so much to lose if these targets are not met or if mitigation efforts are not directed toward those who are at greatest risk. These at-risk communities also have so much to gain if their policy requests are implemented and their safety is prioritized as policymakers and community leaders work to undo the historical damage that they have been forced to accept as their legacy. By prioritizing environmental justice communities’ leadership in this space, communities can fully benefit from the positive impacts their visions of the future can yield when put into practice.
This work has revealed new insights on community-level improvements associated with New York’s landmark climate act. The boundaries of this work have also revealed ripe areas for future research. Interested readers should consult Appendix G on the limitations of our work, but three areas offer the greatest opportunity for future research.
First, being able to predict economic behavior requires sophisticated models for all parts of the economy. Our models cover electric utilities, home heating, and heavy-duty and light-duty vehicles. Agriculture, manufacturing, and commercial heating are missing from our analysis but contribute significantly to emissions and air pollution. Because some of the policies being discussed in New York will be economy-wide, we miss the reactions of those sectors and probably underestimate how much the CLCPA will affect air quality and emissions. It would be valuable for future work to build and apply these models.
A second limitation is that we model conditions only in 2030 (with and without the CAC-inspired and stakeholder policies). Many policies, such as incentives to encourage EV adoption, take time to have a significant effect. Had we run the models for a longer period (say, to 2040 or 2050), CO2 and copollutant emissions would have declined more. However, the further in the future forecasts are made, the more uncertain they become. We opted to minimize such uncertainty. Future analyses could run the models further into the century.
Finally, the expense associated with operating a full-complexity air quality model (compared with reduced-complexity models) limited the number of cases we could complete in this phase of work. As a result, we could not test the air quality impact of individual policies housed in each policy case, or attribute pollution concentration changes to specific emissions sources (source attribution). In our next phase of work, we hope to conduct more focused policy analysis highlighting the air quality impacts of one specific policy: economy-wide carbon pricing through a carbon cap.
This work offers unique insights into the distributional air quality impacts of CLCPA implementation. It provides a framework for evaluating future policies that affect the magnitude and location of emissions changes through addressing economic behavior and methods that can be useful in evaluating how environmental justice communities in particular will be affected. Though in its early stages, work in this field presents many opportunities for future research still to explore.


