Benefits of Energy Technology Innovation Part 1: Power Sector Modeling Results
The first in a series on the effects of cost reductions for advanced energy technologies, this working paper uses a power sector model to assess the potential societal benefits of reducing the costs of five advanced energy technologies.
Executive Summary
Policies and funding programs that support research, development, and demonstration (RD&D) for advanced energy technologies are critical elements of an overall strategy for advancing clean energy and decarbonization of the economy. In contrast to direct emissions reduction and technology deployment policies (e.g., standards, financial incentives), however, there have been limited efforts to quantitatively assess the impacts of proposed energy RD&D policies to help inform decisions. An important reason for this information gap is that it has been difficult to estimate (1) how much proposed policies will advance the technologies of interest and (2) how much such technology advances will be worth to society.
This study addresses the latter of these questions by estimating the net benefits to society that come from reducing the costs of five different advanced energy technologies. (We refer to these five technologies as the AETs). The AETs are each included in the American Energy Innovation Act (AEIA), which has been introduced in the US Senate, and are as follows:
- advanced nuclear fission power generation (hereafter, “nuclear”)
- natural gas power generation with carbon capture and sequestration (NG-CCS)
- enhanced geothermal power generation (“geothermal”)
- grid-connected diurnal electricity storage (“storage”)
- direct air capture of carbon dioxide (DAC)
This study estimates the net benefits of reducing the costs of these AETs under scenarios with and without a national clean electricity standard. The components of total net benefits include reduced electricity consumer bills, changes in generator profits and government revenue, health benefits from reduced air pollution, and climate benefits from reduced greenhouse gas emissions. We will refer to the sum of the estimated dollar values of all these impacts as the “net benefits.” Sometimes one or more of the components is negative. When that is the case, it reduces the net benefits. However, the term “net benefits,” as we use it here, does not account for the costs of the technology innovation itself, such as RD&D spending. Instead, one can compare the net benefits estimated here with the associated RD&D spending necessary to achieve those cost reductions, in order to get an overall sense of net value to society.
Analytic Approach
This assessment employs the Engineering, Economic, and Environmental Electricity Simulation Tool (E4ST), a highly realistic simulation model of the US electric power sector. We use the model to determine how different magnitudes of cost reduction for each AET would influence its deployment in the electricity system, as well as the consequences of that deployment. E4ST predicts construction and retirement of grid-serving electricity generating units and hourly operation of the grid and the generating units in future years, under policies, prices, and other conditions specified by the user. The model begins with a highly detailed representation of the current grid, generating units, electricity demand, and hourly, location-by-location wind and solar data. Among the model’s outputs are hourly locational electricity prices; emissions of carbon dioxide (CO₂), methane, sulfur dioxide (SO₂), and nitrogen oxides (NOₓ); and all the components of total net benefits noted above.
The five AETs are incorporated in E4ST using high-quality data and an emphasis on rep-resenting how they will respond to different potential circumstances. For example, for any given NG-CCS or DAC plant, the cost of transporting and sequestering carbon dioxide is determined by a network model of the potential future carbon dioxide transportation system and of the estimated supply curve for sequestration in each state or offshore area with high sequestration potential. For enhanced geothermal, we use the model of enhanced geothermal supply curves in 134 US zones from the National Renewable Energy Laboratory (NREL). For diurnal storage, we explicitly model optimal charging and discharging for 52 representative hours and 16 representative days. New nuclear plants can be built at only about 300 locations that pass a suitability screen.
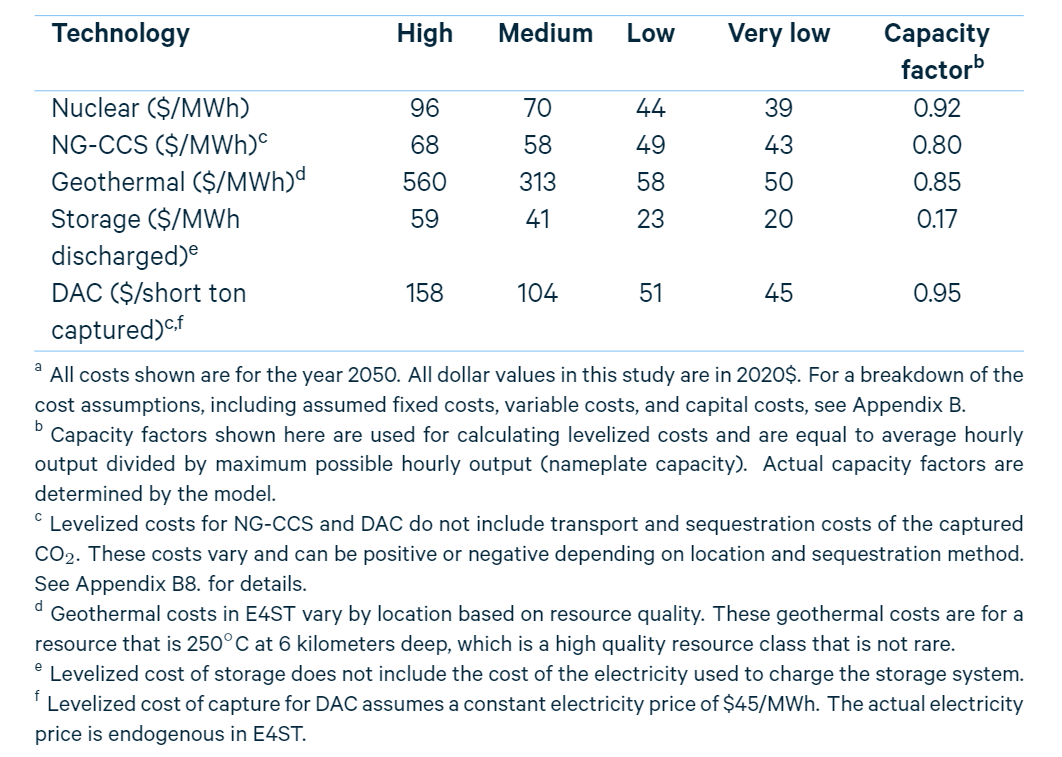
For each AET, we simulate five cost levels while holding the costs of the other four AETs constant. The five cost levels are the four shown in Table ES-1 plus a fifth which is higher than ”high” and is sufficiently high that none of that technology can be built. We simulate the year 2050, and all cost levels shown are projections for 2050. For each technology, “high” is a projection, based on a highly credible source in the literature, of the cost of each technology in 2050 if it undergoes only minimal learning-by-doing. For storage, the ”high” cost level assumes some commercial deployment. For the other four AETs, high costs do not assume any commercial deployment. For all AETs except geothermal, the high 2050 cost is still lower than current cost due to assumed cost reductions resulting from a baseline amount of RD&D. “Low” cost is based on the lowest estimate of potential future cost we found from a highly credible source. The low cost tends to include substantial learning through deployment in addition to RD&D. Appendix B gives the sources of these estimates. “Medium” cost is halfway in between the high and low costs. As a further sensitivity, “very low” cost is uniformly 12.5 percent below low cost and can be motivated as a moderate degree of additional learning beyond low cost (see, e.g., Larsen et al. (2019), in which 12.5% is the central estimate of cost reduction from a doubling of cumulative capacity built).
Note that the high and low cost assumptions assessed for each technology are only rough indicators of how levelized costs might evolve with differing magnitudes of RD&D and deployment. This is partly because it is impossible to know with certainty how easily the cost of each technology can be reduced and partly because our low-cost projections for different technologies come from different sources, since no single source provides suitable projections for all the AETs.
Table ES-1. Technology levelized cost assumptions for 2050 (in 2020$)ª
In addition to varying the cost assumptions for each AET, we also consider two different background policy settings that vary the degree of assumed clean energy required in the power sector in 2050. We can thereby estimate how the expected net benefits of AET cost reductions vary depending on the stringency of policies that drive clean power deployment and emissions reductions. For instance, low-cost AETs are likely to be more valuable when policies call for rapid clean power deployment and decarbonization of the power sector than otherwise. In our power sector modeling, the two policy scenarios we simulate are (1) one without any new environmental policies by the US government and (2) one with a national clean electricity standard (CES) mandating that generation from “clean” sources must equal 100 percent of US retail electricity sales by 2050. In our power sector modeling, we use a CES rather than a carbon tax or a carbon cap because a CES approach currently has more attention as a power sector–specific policy option. In the CES, generators earn credit in proportion to how far their CO2-equivalent emissions are below 0.82 metric tons (0.9 short tons) per megawatt-hour (MWh). The emissions counted are smokestack CO2 emissions and estimated upstream methane emissions associated with natural gas and coal extraction and transportation. Appendix C2. describes the CES policy in greater detail. We henceforth refer to these two scenarios as the “Without CES” and “With CES” scenarios, respectively.
Net Benefits of Technology Cost Reductions
Figure ES-1 shows projected annual net benefits to the United States of each of the power-generating AETs (nuclear, NG-CCS, geothermal), as a function of its cost in 2050, holding other assumptions constant. For example, the nuclear curves in Figure ES-1 show how societal net benefits are affected by varying the cost of nuclear power from very high (such that no new nuclear can be built) to very low. In these scenarios, the costs of the other AETs are held at their medium levels. The top panel shows the results assuming no national CES is in place, while the bottom panel assumes there is a national CES.
For each of these three technologies, as with all technologies, there is a cost above which the technology provides little or no benefit to society because it is not cost-competitive to deploy, given other available options. We estimate that this cost level is roughly $60 per MWh without a national CES and $65-80 per MWh with a CES. Detailed numerical results, including these, depend on the specific assumptions of the model. We strive to use central tendencies for input values. Natural gas price assumptions are influential and our average natural gas price in each region is from the 2019 Annual Energy Outlook’s ”High Oil and Gas Resource and Technology” case, which matches natural gas futures prices better than the EIA ”Reference” case prices do. The costs at which AETs become competitive vary by technology, but consistently are higher with a national CES than without (see Section 5.2.2. for details). At costs sufficiently below these levels, each of the technologies becomes widely cost-competitive and produces billions of dollars of net benefits per year. The top panel of Figure ES-1 shows that this is the outcome even without a national CES, while the bottom panel shows even larger benefits of clean power innovation if there is a national CES.
In the cost ranges for which the nuclear, NG-CCS, and geothermal benefit curves overlap, their net benefits are similar. The maximum net benefit shown for each technology is thus partly a function of the lowest cost simulated.
Focusing on nuclear, for example, at its high and medium costs, the net benefits of new nuclear are near zero because few nuclear plants are built, and the costs of those that are built are approximately equal to their benefits. At its low or very low costs, however, the net benefits of nuclear are approximately $8 billion and $31 billion per year, respectively, assuming no national CES (Panel A). With a national CES (Panel B), the net benefits of nuclear at its low and very low costs are substantially higher, at approximately $28 billion and $38 billion, respectively. The net benefits from NG-CCS and geothermal follow a similar pattern, but with a less steep slope in the cost range shown because in our model the costs of NG-CCS and geothermal vary more based on location than the costs of nuclear do. The negative benefits from NG-CCS at its high costs are a result of a simplifying assumption in our modeling for this project, that NG-CCS receives full credit in utility clean energy policies and in the California and New Mexico CES policies. Hence NG-CCS can fully substitute for zero-emitting generation such as solar or nuclear. When this occurs, NG-CCS increases environmental damages because it still has some emissions. This leads to the observed negative net benefits, which are likely to be avoided in reality if those policies, once fully defined, give NG-CCS less than full credit.
Figure ES-1. Annual net benefits of cost reductions for each technology, assuming medium costs for all other technologies
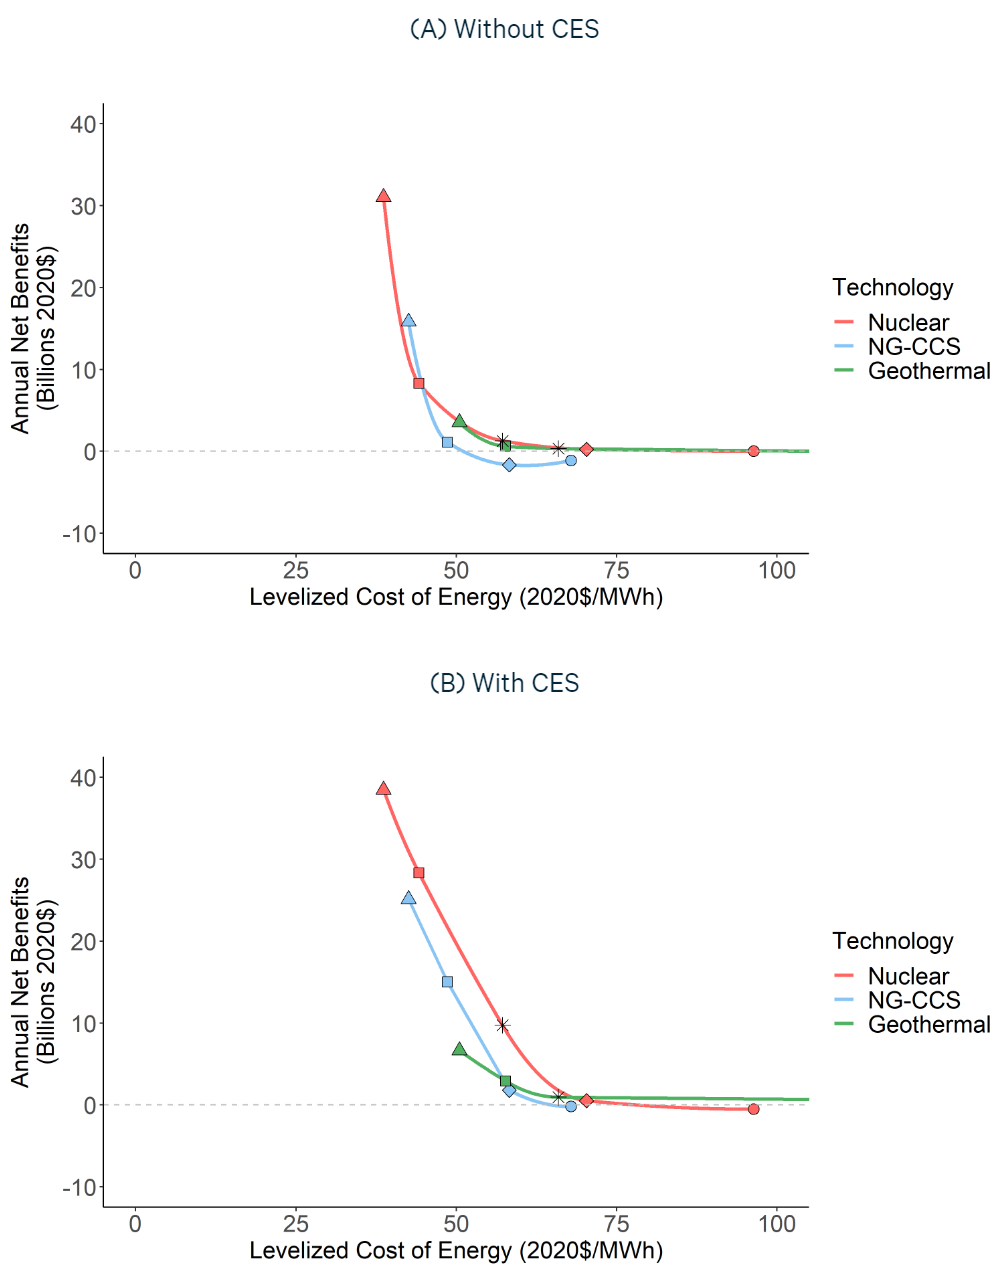
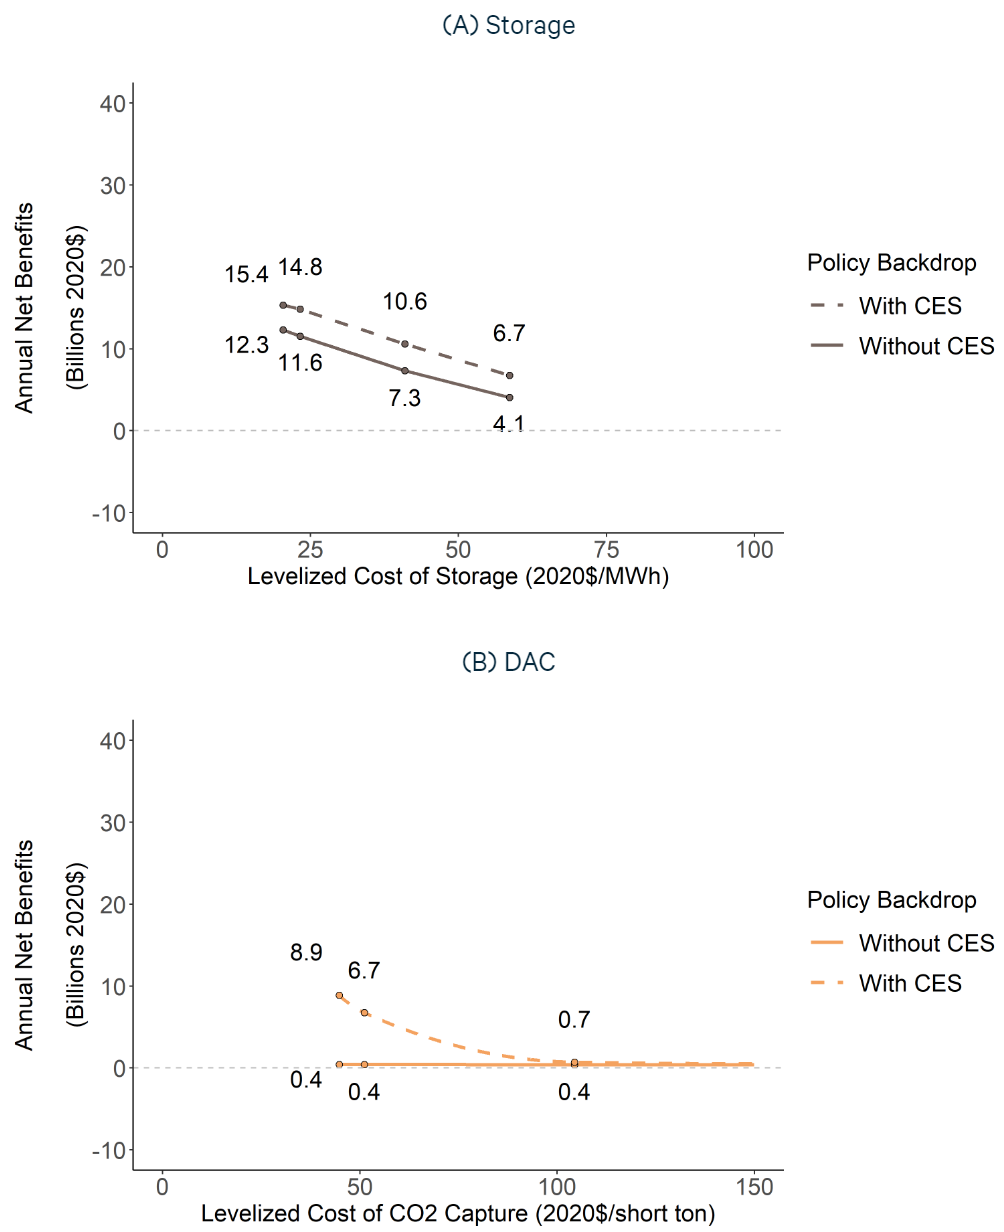
Figure ES-2. Annual net benefits of cost reductions for (A) diurnal storage and (B) DAC
The slopes of the curves in Figure ES-1 (and ES-2) indicate the estimated net benefit per dollar of reduction of each technology’s levelized cost per MWh. The steepest segment is for nuclear between low and very low costs, without a national CES. This is the steepest segment because, without a national CES, cost reductions within that range displace large amounts of conventional natural gas– and coal-fired generation and their associated harmful emissions. Within that nuclear cost range, the average benefit from a $1/MWh reduction in levelized cost is $4.1 billion annually.
Figure ES-2 shows similar benefit curves for storage and DAC. Storage is widely deployed under the various cost scenarios and provides billions of dollars of net benefits annually, even at its high cost and without a national CES. Consequently, storage cost reductions are projected to be beneficial even if they only attain the high cost levels, because solar and storage together become competitive with thermal generators, especially natural gas combined cycle. The net benefits of DAC in 2050 are $370 million to $420 million in the case with no national CES, increasing within that range as its cost decreases. In that case, DAC is used in the state with the most stringent emissions policy, which is a net-zero limit on in-state power sector CO₂e emissions. In that state, DAC enables NG-CCS and coal CCS generation, offsetting the resulting emissions. In the scenarios with a national CES, the benefits of DAC increase at lower levelized costs. As the cost of DAC decreases, it becomes competitive with other AETs for CES credits in multiple parts of the country.
Figure ES-3 shows a decomposition of the net benefits of reducing each AET’s cost from medium to low individually, while holding other technologies at their medium costs. Furthermore, Table ES-2 and the rightmost column of Figure ES-3 show a similar decom-position of the net benefits resulting from reducing all AETs’ costs from medium to low simultaneously. The figure shows the total net benefits with a short horizontal black line, and also divides them into five different benefit categories: electricity users (consumer savings), generator profits (electricity producers), government revenue, health benefits (SO₂ and NOₓ emissions reductions), and climate benefits (CO₂ and methane emissions reductions). Panel A shows the scenario without a national CES, and Panel B shows the scenario with a CES.
Figure ES-3. Composition of annual net benefits in 2050 from reducing AET costs from medium to low
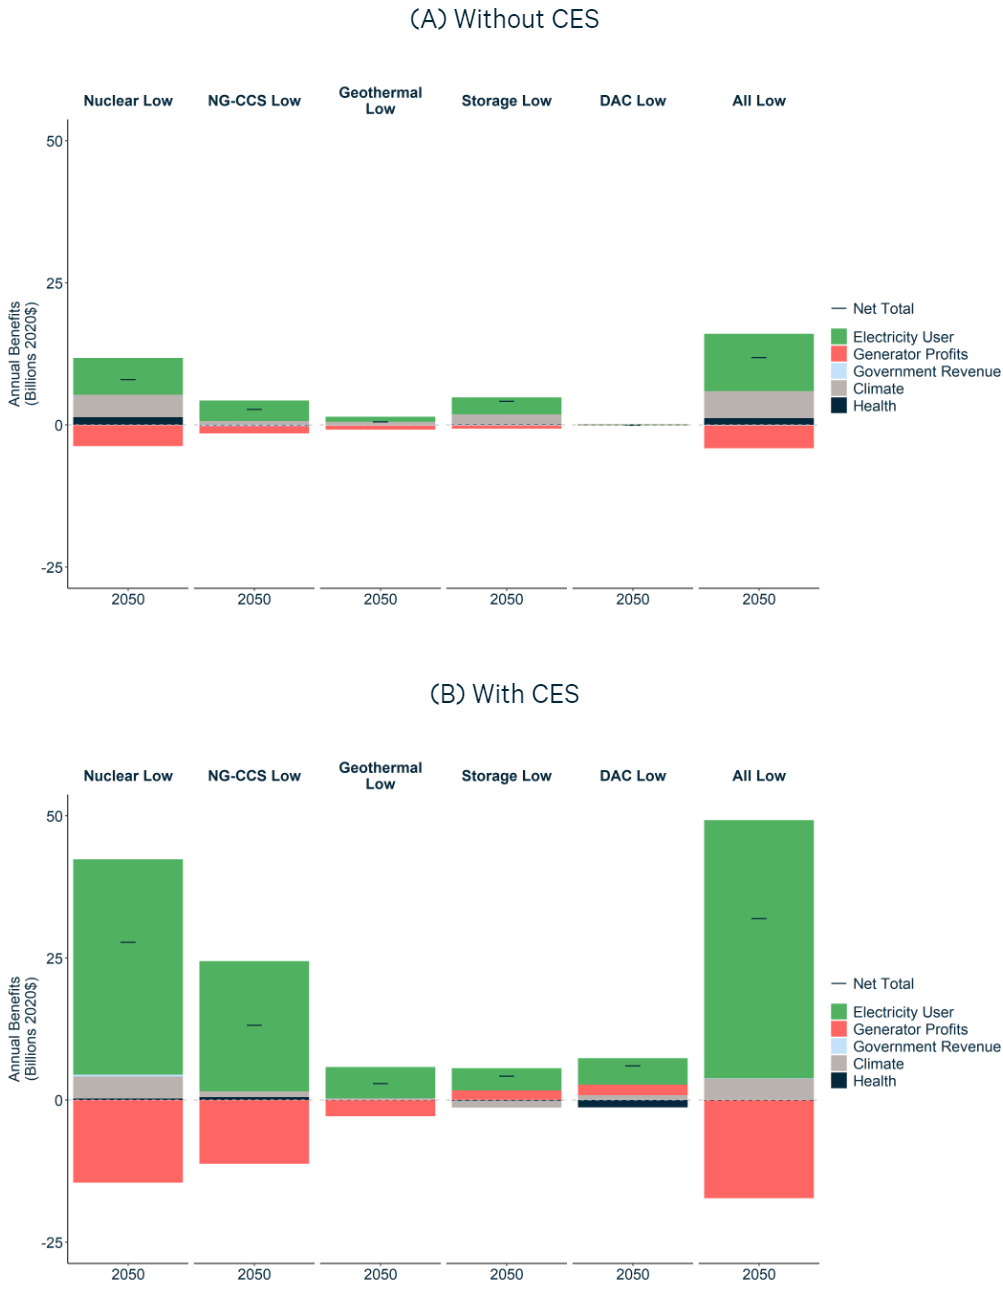
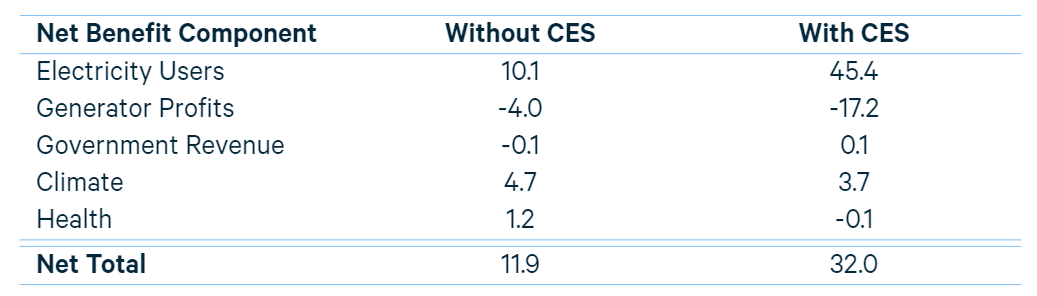
Table ES-2. Annual net benefits in 2050 of reducing all the AETs from their medium to low costs (billions of 2020$)
Without a national CES, benefits are split between bill savings for electricity users and reduced emissions damage. The AET cost reductions lower prices proportionally more than they reduce generation costs, boosting electricity user savings and correspondingly reducing generator profits, as shown by the red segments below the zero axis.
With a national CES, climate benefits and health benefits from AET cost reductions together are in no case more than a seventh of total net benefits, reflecting the fact that with the national CES policy as a backdrop, emissions are largely determined by the CES (as are the associated emissions reduction benefits). Instead, benefits in the form of bill savings to electricity users dominate the AET innovation benefits, reflecting bene-fits from lower electricity rates due to lower costs of generating clean power. In other words, lower-cost AETs allow electric utilities to meet the national CES and state and utility clean energy requirements at lower cost. Nuclear, NG-CCS, and geothermal cost re-ductions lower prices proportionally more than they reduce generation costs, increasing electricity user savings and correspondingly reducing generator profits. The decrease in generator profits could be offset or reversed by policies from federal, state, and local governments. The ability of energy policies to affect profits is, for instance, shown by the national CES. We estimate that at high and medium AET costs, the CES has a positive impact on annual generator profits of $24 billion and $11 billion, respectively, which is not shown in Figure ES-3. Overall, the highest net benefits to society are achieved in cases where there is a national CES and the AETs are at their low cost levels.
Figure ES-3 and Table ES-2 just discussed present the net benefits of reducing the costs of the AETs from their medium to their low levels. We also calculated the net benefits of reducing them from their high to their low costs. The estimated annual net benefits of reducing the five AETs, together, from their high to their low costs are $15.9 billion without the national CES and $47.4 billion with the national CES. The reduction in retail electricity price from reducing the costs of the AETs from high to low results in aver-age per-household electricity bill savings of $3 per month without the CES, and $16 per month with the CES. With the CES, low-cost AETs reduce the electricity price enough to almost entirely offset the increase in price caused by the CES.
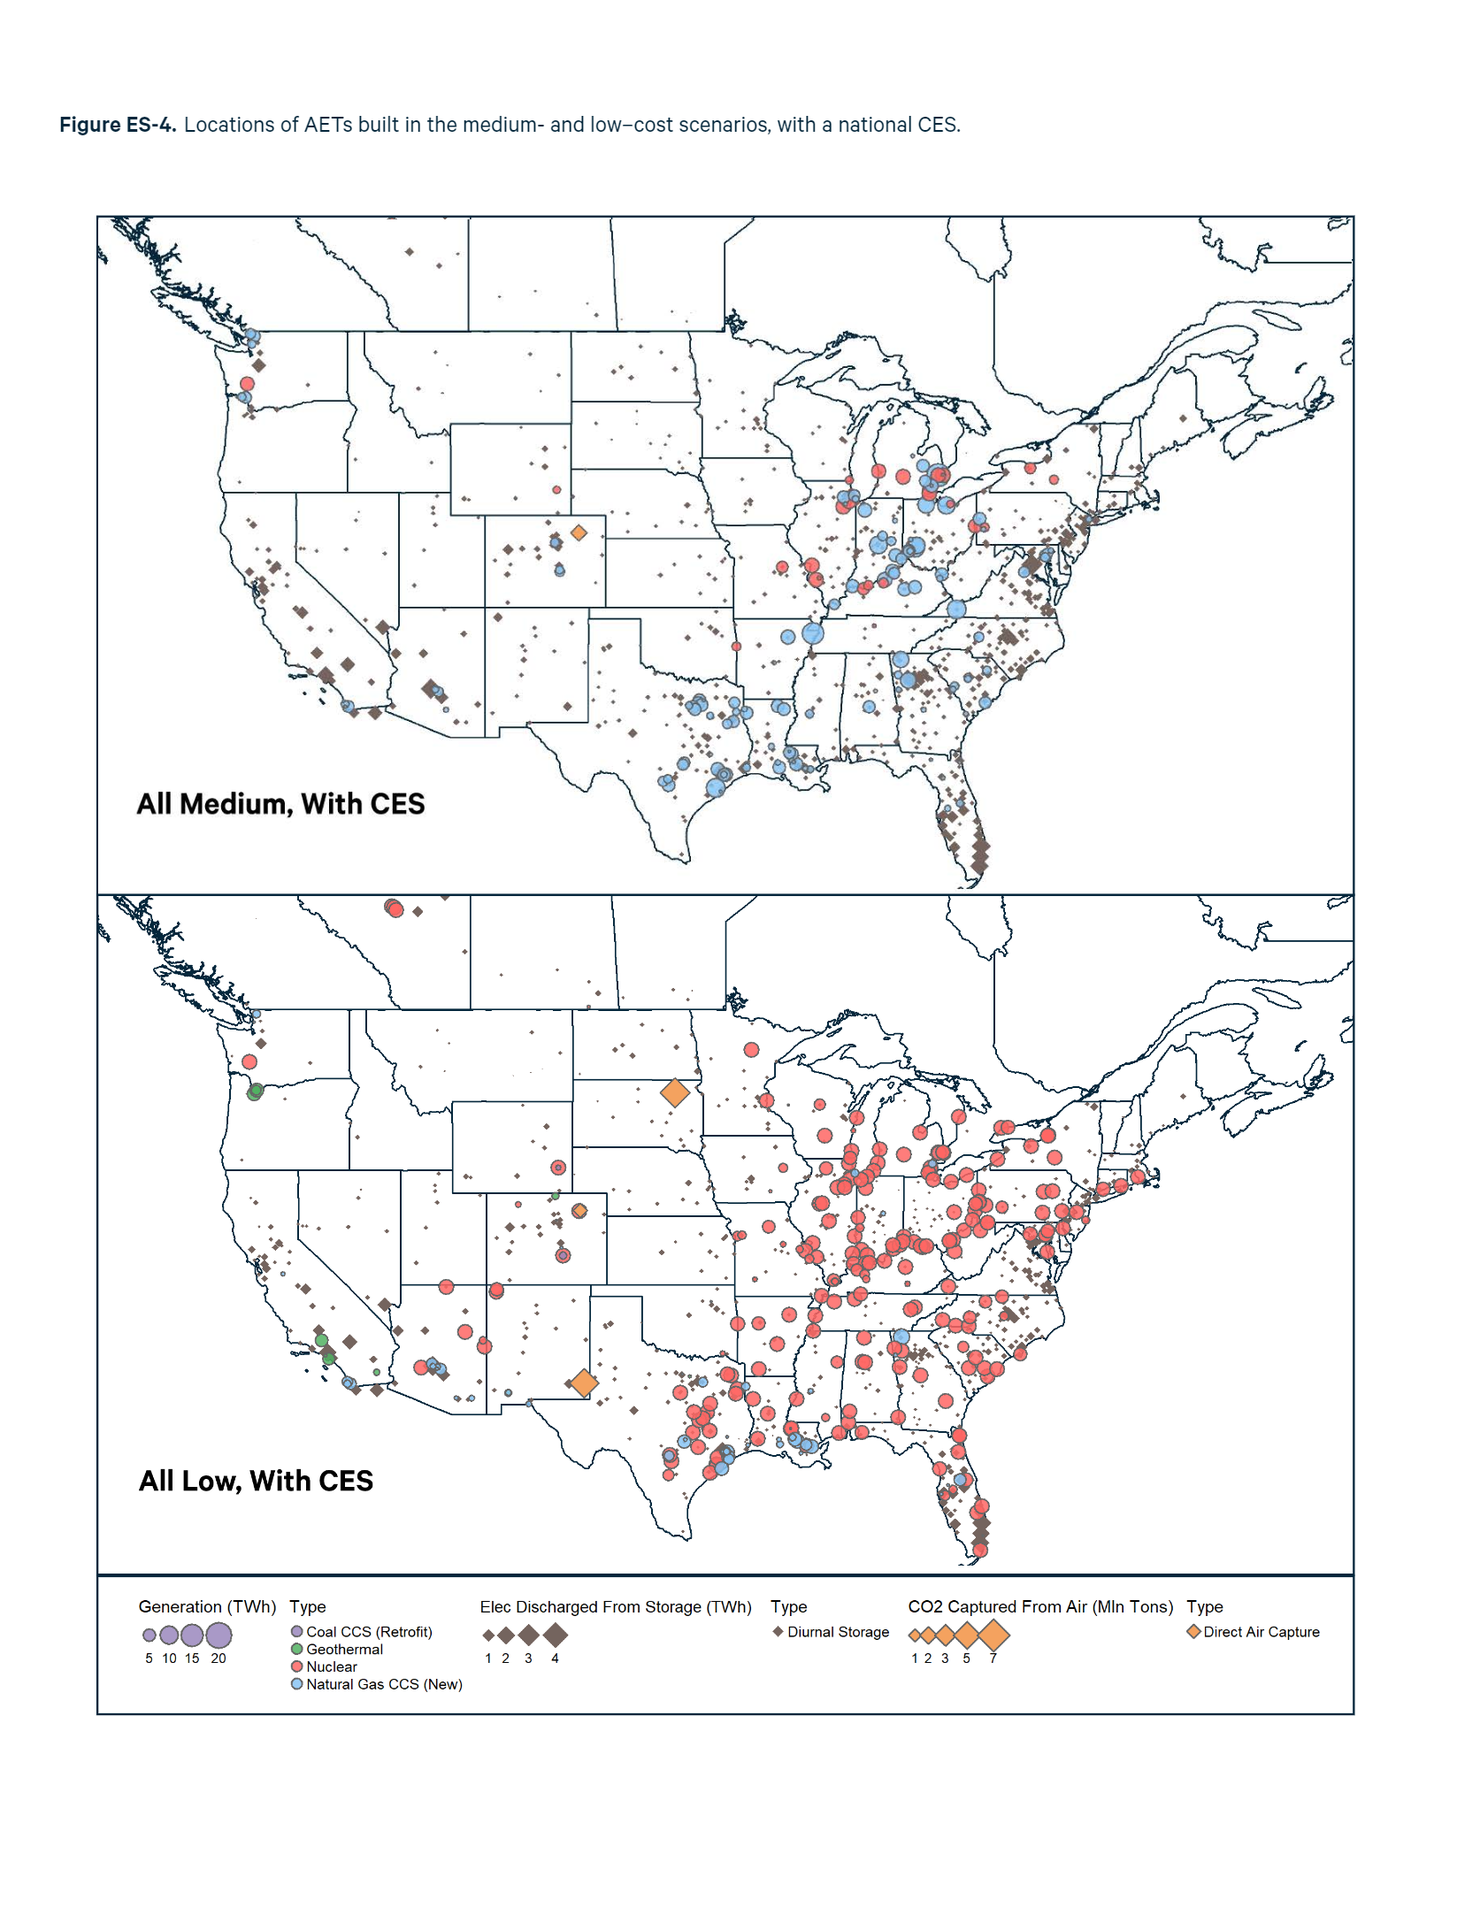
To further illustrate the results, the maps in Figure ES-4 show where the AETs are built and operated under the scenarios with a national CES and with all AETs at their medium costs (top panel) or at their low costs (bottom panel). In addition to illustrating the widespread geographic deployment of the AETs in specific locations appropriate to each AET, the different cost scenarios illustrate how particular AETs (e.g., nuclear and NG-CCS) compete with one another and face deployment prospects that depend consider-ably on the relative cost of other clean energy technologies. (Note that the maps show only the AETs and not other technologies that either already exist or are newly built in the simulations.)
Our estimates of the net benefits of the AETs are conservative in several respects. First, cost reductions for the AETs can produce substantial benefits outside the power sector as well. For example, storage technologies can be deployed in transportation; direct air capture can offset emissions from difficult-to-decarbonize sectors such as industry and fuels; and geothermal, NG-CCS, and nuclear can provide heat for industry and buildings. These benefits outside the power sector are not captured in this study.
A parallel RFF report assesses the benefits of the broader application of one of the AETs, DAC, using an economy-wide computable general equilibrium model (see Hafstead (2020)). That analysis finds that the annual net benefits of DAC being at its low cost level (rather than its high level) would be $57 billion in 2050, assuming a cumulative carbon reduction target consistent with a pathway to 2050 emissions that are 80% below 2005 levels. These economy-wide benefits of DAC innovation are 9 times as large as the corresponding net benefits estimated solely in the power sector applications detailed in this report, which have a national CES as the policy backdrop.
Other factors also contribute to our estimates being conservative. The net benefits presented here are benefits only to the United States, and we omit the benefits from the use of the less costly AETs outside the country. The United States accounts for only about one-fifth of world power generation. In addition, we omit the benefits to the US economy of greater exports if the less costly advanced energy technologies are exported by US companies. Finally, geothermal and, to a lesser extent, nuclear allow for storing heat at times of low electricity demand and then generating more power at later times of high demand. This capability makes those technologies more valuable, but we have not yet represented this feature in the model.
The full report provides substantially more detail on the methodological approach and assumptions employed, as well as the results. In addition, a follow-on report will include experts’ estimates of the effect of the AEIA on the costs of the five AETs considered here, so that one can better understand the degree to which the AEIA could help advance the innovation and cost reductions assessed in this report.
Figure ES-4.Locations of AETs built in the medium- and low–cost scenarios, with a national CES