Value of Science 109: The VALUABLES Impact Assessment Framework, Step 3: Identifying How Decisions Influence Outcomes for People and the Environment
In the third step of the VALUABLES Impact Assessment Framework, we explore the impact of decisionmaking processes on people and the environment.
In the previous explainer, we explored how differences in information may influence a decisionmaker’s choice of action. The final step in framing a VALUABLES impact assessment is to identify and compare the consequences of these actions for people or the environment. This step is represented in row three of the framework (Figure 1), which compares outcomes when improved information is either available to the decisionmaker or when it is not. Researchers can use this comparison to make a compelling empirical case for why their work brings value to the world.
Figure 1. The VALUABLES Impact Assessment Framework

Finding the Right Metric
The success of the third, final step hinges on identifying appropriate metrics to describe the outcomes of a decisionmaking process. A useful starting point is to ask the overarching question, “What is the main impact that the project aims to have on people or the environment?” It’s important to be as specific as possible, avoiding a “mega-outcome”—something too vague to serve as a foundation for measuring impacts. (Recall the nebulous goal of “informing water quality management” from the Value of Science 105 explainer.) Also note that a project may have the potential to achieve multiple goals. For the purposes of framing impact assessments, we encourage focusing on a single achievable impact at a time. We can always map out additional impact assessment frameworks to evaluate the other goals.
Returning to our everyday GPS example from the previous impact assessment explainers, remember that the decision context was to choose between the highway or side roads to run errands downtown. GPS with real-time traffic information (the reference case) warned of a major traffic jam on the highway, so we chose to take the side roads. Our alternative source of information—GPS with no live traffic information (the counterfactual)—would not have warned us of the backup, and we would have chosen the highway.
The motivating factor in this example is to choose the quickest (rather than shortest) route. So an appropriate metric to express the outcomes under the two scenarios is time spent on the road.
In our research example, recreational managers monitored Utah Lake for harmful algal blooms using weekly satellite data, monthly field tests, lab tests, and visitor reports (the reference case, in blue) or just the latter three information sources (the counterfactual case, in red). Managers could issue warnings or prohibit access to the lake, depending on the severity of the event, with the aim of preventing visitors from getting sick. So, the researchers conducting the experiment chose to measure outcomes in terms of human illnesses.
Describing and Comparing Outcomes
The next step is to compare the outcomes with and without access to the improved information. Key questions include:
- How do the outcomes of the decisionmaker’s actions that are taken in response to improved information differ from the outcomes that arise when the actions are taken in response to alternative sources of information?
- Can the outcome metric identified be used to quantify the change in the outcome?
As we learned in the Value of Science 103 explainer, changes in outcomes can be quantifiable—such as lives saved, additional acres conserved, or increased crop yields—or the changes in outcomes may be nonquantifiable because of privacy concerns, for example, or lack of key evidence. The most compelling cases arguably arise from quantifiable outcomes expressed in absolute terms. Imagine, in our GPS example, that the GPS with real-time traffic updates provides ETAs for the two routes we’re choosing between. In this case, we can document exactly how many minutes each route is estimated to take. Then, we can use the third row of the impact assessment framework to describe these outcomes. The number of minutes it would take to travel the route chosen using live traffic information would be written in the blue column, while the number of minutes associated with taking the route chosen without live traffic information would be written in the red column.
At this point, we finally arrive at the “impact” part of an impact assessment. Specifically, by comparing the outcomes that we’ve written in the two columns in the third row of the framework, we can describe the change in outcomes for people and/or the environment. This change in outcomes is the “delta” that we have been searching for. In the GPS example, comparing the difference in the number of minutes of travel time written in the two columns gives us the amount of time we can save by taking the side roads. This time saved is the change in outcome that matters to people, enabled by the GPS with live traffic information.
The third row of the framework can be useful even if we cannot quantify the outcomes in terms of metrics such as minutes of travel time. Both quantifiable and nonquantifiable benefits may be compared in relative terms by describing qualitatively how the magnitude of benefits may change as a result of the improved information. For instance, if the GPS did not provide estimated arrival times, we could simply write “Less time” in the blue column and “More time” in the red column. This qualitative comparison still allows us to be specific about the change in outcome—time savings, in the GPS example.
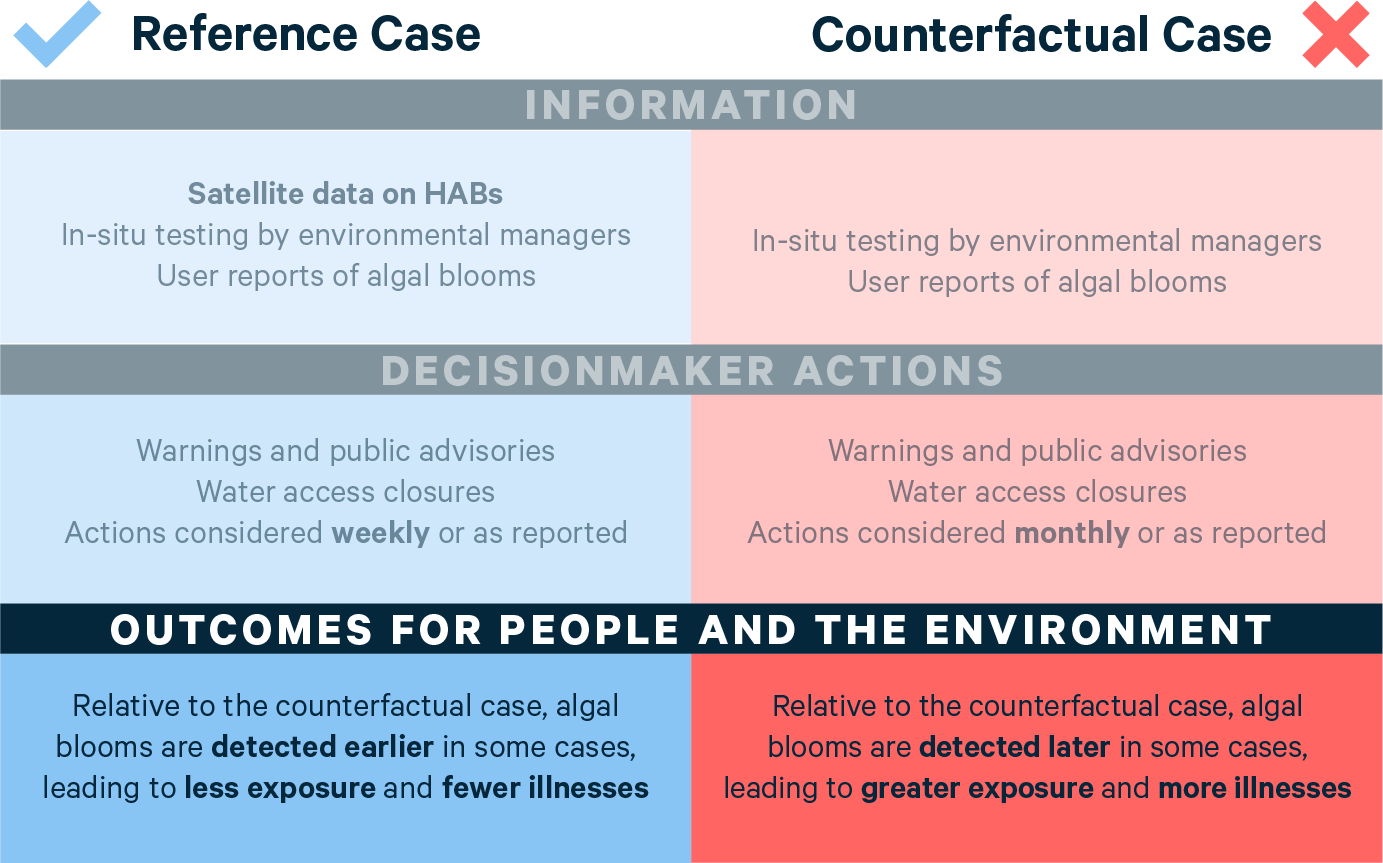
Similarly, in our research example, the health benefits of using satellite information to detect harmful algal blooms can be described in the framework in qualitative or quantitative terms. Because the satellite data are available on a more frequent basis than field tests, lab tests, and visitor reports, the researchers report, decisionmakers are able to detect algal blooms earlier in some cases, leading to decreased exposure to toxic blooms and fewer illnesses in the reference case (blue) than in the counterfactual case (red) without the satellite data. Figure 2 illustrates an example of an impact assessment framework that uses a qualitative description of outcomes in the reference and counterfactual cases. (Note that the framework illustrated in this figure has been slightly modified from the version that appears in the journal article published by Stroming et al. in 2020.)
Figure 2. VALUABLES Impact Assessment Framework: An Example Using Qualitative Description of Outcomes
In their journal article, Stroming et al. go on to estimate the number of hospitalizations avoided during a specific algal bloom event in 2017 and express the result in terms of health-care costs saved. This allows the outcomes to be described in quantitative terms, as we do in the third row in Figure 3.
Figure 3. VALUABLES Impact Assessment Framework: An Example Using Quantitative Description of Outcomes

Placing a dollar value on outcomes can be a particularly powerful way to communicate the value of improved satellite data, allowing an apples-to-apples comparison of the costs and benefits of a suite of policy interventions. Even in cases where an impact assessment uses relative terms to measure the differences in outcomes, scientists are taking an important step in demonstrating the logic behind how improved information benefits society.
Concluding Thoughts
In this 100-level explainer series about the value of science and information, we have explored how economists conceptualize value and how Earth scientists can harness economic methods to measure the value of improved information from satellite data. At the core of the series, the three-step VALUABLES impact assessment framework offers a powerful tool to demonstrate how satellite information benefits people and the environment when it is used to make decisions.
In our upcoming 200-level explainer series, we will take a more in-depth look at methods that Earth scientists can employ while conducting impact assessments, including how to quantify their results in monetary terms. We also will discuss barriers that can arise for scientists and decisionmakers when they collaborate on impact assessments. What happens when decisionmakers are hesitant to participate in an ex-post impact assessment, for example, which might suggest they could have made better decisions? And does new information have value, even if it doesn’t change a decision?
Satellite data increasingly contribute to decisions that matter for society, whether to manage water resources, wildfire response, conservation efforts, health and air pollution, and more. Measuring the socioeconomic benefits that these Earth observations provide is an important way for scientists to understand and communicate the value of their work and for society to best harness this information and capture its value.


