Value of Science 202: Quantitative Methods for Impact Assessments
This installment of our Value of Science explainer series describes how differences in outcomes between references and counterfactual cases can be expressed quantitatively to aid decisionmakers.
The 100-level Value of Science explainer series walks through the three steps of assessing the socioeconomic impacts of improved scientific information, which ultimately allows you to describe how this information influences outcomes for people and the environment. The recommended approach to completing these steps is to fill out the VALUABLES Impact Assessment Framework. To complete the last row in the framework, you need to identify the outcomes for people and the environment in the following two scenarios: a world in which the improved information is available to the decisionmaker, and one in which the information is not available. Moreover, Value of Science 109 describes how differences in outcomes between the two worlds—the “delta” between the reference and counterfactual cases—can be expressed quantitatively.
Figure 1. VALUABLES Impact Assessment Framework: An Example Using Qualitative Description of Outcomes
At this point, you might be asking yourself how one goes about characterizing these outcomes in quantitative terms. Credibly estimating socioeconomic outcomes can be a complex and time-consuming task and, in many cases, you will need a trained social scientist to help you. Several methodologies can be employed to quantify differences in outcomes, each with its own pros and cons, depending on the type of scientific information that is assessed. Entire graduate-level university courses have been dedicated to training people in these methods, and social scientists have spent decades refining these methods, both in the peer-reviewed academic literature and through practical use in real-world evaluation settings. As such, it is beyond the scope of this explainer to train you to implement these methods. However, we hope the descriptions that follow give you a better appreciation of the various methods that are available for quantifying differences in outcomes and a more nuanced understanding of the basic logic behind how each one works.
Method 1: Quantification Based on Decisionmaker Testimonials
As described in Value of Science 107, as part of the process of identifying the decisionmaker and the decision context, opportunities may arise to survey or interview the decisionmakers who use the improved information. Through these interactions, it may be possible to ask the decisionmakers to describe the actions they would have taken with and without the improved information. This kind of testimonial can serve as evidence of how decisionmaker actions differ in the reference and counterfactual cases—as long as the testimonial is credible and reliable.
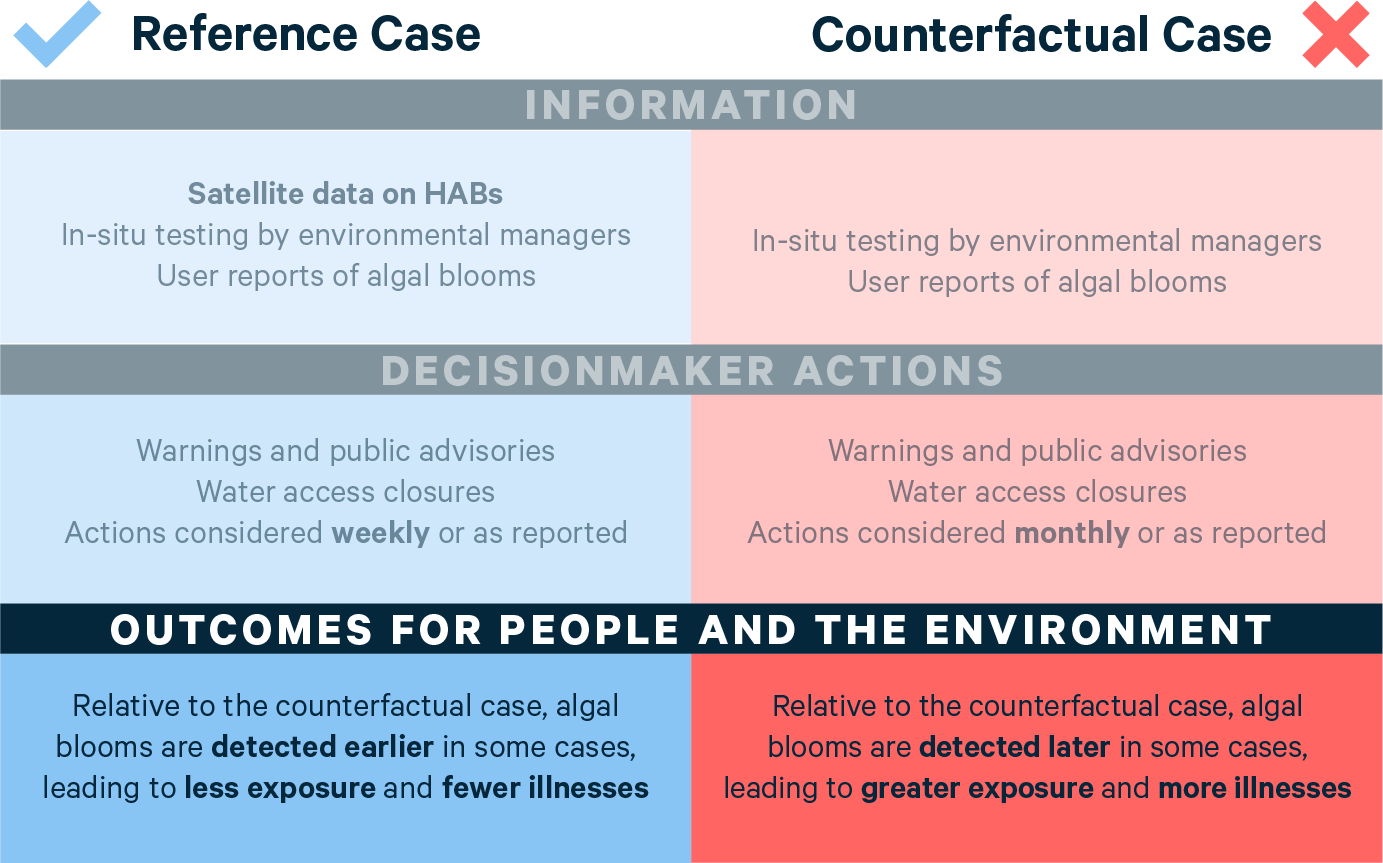
Recall that, in our research example of Stroming et al. 2020, recreational managers use satellite data as one source of information to monitor Utah Lake for harmful algal blooms. The researchers who conducted the impact assessment of that satellite-based algal bloom information interviewed the managers and learned that the managers were able to take action more quickly with the satellite data. This observation led the impact assessment team to focus on a scenario in which the satellite data allowed the managers to issue warnings and public advisories a week earlier than they would have in the absence of the satellite data.
Once this difference in actions between the reference and counterfactual cases can be established through decisionmaker testimonials, the researchers conducting the impact assessment can search for supplemental information that allows them to characterize the consequences of those actions, in each of the two cases, on outcomes for people and the environment.
For example, in the Utah Lake study, the researchers estimated that, when the managers had access to satellite data (the reference case), recreational advisories were posted immediately after the algal bloom first appeared, so visitors avoided exposure to the algal bloom and no resulting illnesses were documented. Then, based on the information that the lack of satellite data would have led to a one-week delay in posting advisories, the researchers estimated that, during that one-week period, about 8,000 people would have been exposed to the algal bloom, with 400 of those 8,000 people hypothetically experiencing symptoms. Findings from the decisionmaker testimonials provided evidence about how the decisionmakers would have acted differently in the reference and counterfactual cases. Linking these findings to estimates of the difference in outcomes for people and the environment (i.e., the difference in the number of illnesses between the reference and counterfactual cases) required the impact assessment researchers to incorporate supplemental information. This supplemental information included, for instance, the typical number of visitors to Utah Lake (from agency visitation data) and the likelihood of experiencing symptoms given that an individual was exposed to a harmful algal bloom (from health research).
The box below provides another example in which decisionmaker testimonials played a crucial role in allowing the impact assessment researchers to estimate the value of a scientific data product.
Example: The Value of NOAA's Digital Coast
Cleary et al. (2021) estimated the value of two data products provided by the National Oceanic and Atmospheric Administration (NOAA)—the Sea Level Rise Viewer and the Coastal Flood Exposure Mapper—in the planning process to relocate two wastewater treatment plants in Jackson County, Mississippi. The researchers relied on decisionmaker testimonials, collected through interviews of the Jackson County Utility Authority, which revealed that the availability of the data products early in the process of relocating the plants saved approximately one to two years of planning efforts. This information from the decisionmaker testimonials was combined with information on expected damages from the plants remaining in their current locations for an additional one to two years due to potential storm surge from hurricanes, yielding an estimate of benefits attributable to the use of the Digital Coast products of approximately $1,117,000 (for one year of avoided damages) to $2,213,000 (for two years of avoided damages) in 2014 dollars.
Relying on decisionmaker testimonials as a quantification approach in impact assessment comes with some benefits. First, this method involves primary research, which allows the impact assessment team to gain firsthand knowledge about how the improved information influences decisions. Second, interviewing decisionmakers is a feasible method of impact assessment when relatively few decisionmakers will use the improved information. For example, the use of decisionmaker testimonials may be the only way to quantify the societal benefits of some types of information applied by just a handful of government agencies or that are used infrequently (e.g., the use of data in natural disaster management). In contrast, most of the alternative methods described below rely on an impact assessment team’s ability to observe a large number of decisionmakers and the many actions they take in response to the improved information.
While interviewing decisionmakers can elicit important information for impact assessment teams, researchers should be mindful of potential challenges they might encounter while using this approach. First, it is important to recognize that impact assessments are not typically part of a decisionmaker’s job; organizational incentives for the decisionmaker to participate in these activities may be absent and make it difficult for them to provide the testimonials you need. Second, when planning interviews, researchers should be prepared to plan assessment activities around decisionmakers’ schedules, particularly in cases where interviewees are involved in emergency response or seasonal activities. In the case of the Utah Lake study described above, for example, the study team tried to avoid making demands on decisionmakers’ time during the peak summer months when more harmful algal blooms occur. Finally, researchers should be mindful that their impact assessment may show that one source of information is better than another, that a better decision could have been made, or that the decisionmaker should invest money and effort in adopting a new source of information. Each of these outcomes can pose practical challenges for the decisionmaker who participates in the assessment.
Method 2: Stated Preference
In Value of Science 201, we learned about stated preference methods, which can quantify people’s willingness to pay for a particular good or service by asking them directly how much they would pay to maintain or improve a nonmarket good. As it turns out, stated preference methods are useful not only for describing differences in outcomes for people and the environment in monetary terms, but also for directly eliciting the value of improved information from decisionmakers.
In this sense, stated preference methods rely on information collected directly from decisionmakers who use the improved information, much like in Method 1 above. But unlike Method 1, in which impact assessment researchers obtain information about differences in decisionmaker actions across the reference and counterfactual cases, stated preference studies directly ask respondents about the value that respondents place on a source of information, using survey questions such as, What would you be willing to pay to access this improved information?
The questions in stated preference surveys are designed so decisionmakers’ answers provide an estimate of the difference in the value of outcomes between the reference and counterfactual cases, from the decisionmaker’s perspective. By posing the questions to a large number of decisionmakers, the researchers can estimate the value of the improved information to the average decisionmaker. This value then can be extrapolated to estimate the total value of the information to all users; for example, by multiplying the average per-decisionmaker value by the number of decisionmakers who accessed the information, as recorded in website downloads.
Example: The Societal Benefits of Landsat Imagery
Straub et al. (2019) used contingent valuation—a stated preference method—to estimate the annual benefit of Landsat imagery to users in the United States. The key survey question asked by the researchers is the following:
“In the event that Landsat imagery was no longer available, you may have to obtain imagery elsewhere. Assume that you are restricted to your current project or organization budget level and that the money to pay any cost for replacement imagery and additional software or training would have to come out of your existing budget. If you had to pay for imagery that was equivalent to currently available Landsat imagery, would you pay $X for one scene covering the area equivalent to a Landsat scene?”
In this question, the researchers varied the “$X” across 13 different amounts. This, combined with the survey respondents’ “Yes” or “No” response to various dollar amounts, allowed the researchers to estimate the value of a Landsat scene for the average user. These survey results were combined with information from annual Landsat downloads to yield an estimated $3.45 billion in benefits in 2017 for domestic and international users
One of the strengths of stated preference methods is that they can be used to quantify a broad array of benefits that stem from a wide variety of decision contexts. Because decisionmakers are asked to provide a monetized value of the information, the impact assessment team need not obtain information about every decision context in which the information is used; the quantification of the value of the information in decisions is left up to the survey respondents. A potential weakness of stated preference methods is that some audiences may put less faith in estimates generated by these methods, due to concerns about questionnaire design or the perceived subjective nature of interviewees’ responses.
Method 3: Experimental Approaches
These studies use an experimental approach, usually in a lab or field setting, that randomly provides improved information to some decisionmakers and withholds the information from others. This randomized design allows the impact assessment researchers to observe the first group of decisionmakers as the “treated” group and the other group as a “control” group. Researchers then can compare the actions taken by decisionmakers who receive the information to the actions taken by decisionmakers who do not receive the information.
The observed differences in actions (if any) can be combined with supplemental information to estimate the difference in outcomes for people and the environment, much like in Method 1 above. Many social scientists consider randomized approaches to be the “gold standard” for evaluating the impacts of a project or program, given that the randomization mimics the ideal conditions of clinical trials and other scientific laboratory experiments, which control for confounding factors that might influence the outcome of interest.
Example: A Field Experiment to Quantify the Benefits of a Satellite-Derived Cholera Early Warning System
In an ongoing study supported by VALUABLES’ Grants to Assess the Benefits of Satellites (GABS) program, a research team led by Sonia Aziz (Moravian College) is conducting a field experiment that provides a satellite data–driven early warning system for cholera in Bangladesh through access to a cell phone app for a “treatment” community. Cholera rates and other outcome metrics will be compared to those of a “control” community that does not use the app.
While appealing in theory, experimental approaches may have limited applicability in practice, depending on the type of information that is being assessed. For example, in many decision contexts, it can be difficult to provide some decisionmakers with information while also withholding that information from other decisionmakers. There is a risk that decisionmakers who were provided the information will share it with other decisionmakers who did not receive the information, thus creating an inadequate control group and reducing the estimated impact of the information. Such “information spillovers” might be avoided if the experiment can be conducted in a lab setting, but that approach may in turn raise the question of whether the role of the improved information in decisionmaking that is observed in a lab is representative of the impacts of information in real-world use. In some cases, it may also be ethically questionable to withhold information from individuals, especially if the information can help individuals avoid harm.
Method 4: Quasi-experimental Approaches
One alternative to taking an experimental approach to impact assessment (Method 3) is to try to exploit what are known as natural experiments. These quasi-experimental approaches examine decisions and outcomes when scientific information is available only to certain decisionmakers over a certain period of time, and the conditions under which this happens arises “naturally,” as opposed to being dictated by the impact assessment researchers. This type of natural experiment allows researchers to observe groups of decisionmakers that have been “treated” by the availability of scientific information, along with a “control” group that does not have access to the information, much like in the experimental approach. This allows researchers to identify differences in outcomes for people and the environment that arise from decisions made by these two groups.
For the estimated difference in outcomes to be credible, the investigator conducting the study must ensure that any difference between the treatment and control groups beyond the degree of access to scientific information must be randomly distributed or accounted for. In other words, the unique access of certain decisionmakers to improved information should not be tangled up with any other factors that likewise could lead to different outcomes, but which the investigator isn’t able to observe. If factors outside of the improved information end up influencing the outcome, and the investigator does not account for those additional factors, then a difference in outcomes may be attributed to the value of the information—when really, the outcome was influenced by something else altogether that the investigator did not consider..
For example, consider an assessment that seeks to quantify the degree to which a satellite-based data product increases the work efficiency of firms or agencies. An investigator could assess the output of firms that have access to the data, compared to the output of firms that do not have access to the data. For this to be a true natural experiment, a firm’s ability to access the data cannot be related to other, unobserved attributes which also could influence the firm’s productivity. If, for example, firms that already are inherently more productive are the ones that accessed the data (perhaps because they have twice as many employees on average), then comparing the output of these firms to the (less productive) firms that did not have access to the data would overestimate the impact of the data on firm productivity. The example in the box below provides a great case study in which an impact assessment team exploited a natural experiment that avoided this kind of confounding effect.
Example: Landsat Imagery and Gold Discoveries
Nagaraj (2022) exploits a natural experiment created by the fact that Landsat occasionally generates unusable images due to cloud cover, despite being designed to have consistent global coverage. The author uses this variation in data availability to understand gold exploration activity in places where Landsat data are available, compared to places where the data are not available. Crucial to this being a natural experiment is that the factor that drives the availability of data—cloud cover—is not directly related to gold discovery. The author finds that Landsat data nearly doubles the rate of significant gold discoveries and increases the market share of new entrants by about 15 percent.
Despite their appeal, quasi-experimental approaches can be limited in their applicability. As we saw with experimental approaches, conditions for a natural experiment are not always available for each scenario in which researchers may wish to study the value of a particular source of improved information.
Method 5: Exploiting Information on Transactions in Financial Markets
One way in which scientific information is valuable, but which cannot easily be captured in the VALUABLES Impact Assessment Framework, is that new information can reduce uncertainty about something that a decisionmaker needs to take action on. For example, reduced uncertainty about the weather can help farmers reduce the risks they are exposed to when making decisions about planting, irrigation, and harvesting.
Financial markets have mechanisms for trading risks between those who will pay to remove a risk and those who will accept payment to assume that risk. An example is the corn futures market. Farmers need to purchase seed corn before planting. Because the future price of seed corn is uncertain, farmers are willing to pay a premium in September to guarantee that they can purchase a specific quantity of seed in April of the following year at a set price. The farmer can obtain this guarantee by purchasing a futures option. If the actual price of seed corn in April is below the price that was paid for the futures option in September, the seller of the futures option makes money, as they can buy seed corn at the market and sell for a higher price to the farmer. If the actual price of seed corn is above the price that was paid for the futures option in September, the seller loses money. In any event, the farmer purchases the seed corn at the price established in September.
How does the price of the futures option relate to uncertainty regarding the future price of seed corn? Intuitively, as the uncertainty of the April price increases, so does the price of the futures option. The farmer is willing to pay more in September to secure a price for seed corn, and the seller will need to be paid more in order to take on the additional risk associated with greater uncertainty in future seed corn prices.
Thus, examining prices in futures markets can reveal people’s perception of uncertainty and tell us how much they are willing to pay to reduce that uncertainty. Quantifying this willingness to pay to reduce uncertainty, in turn, reflects the value of the information.
Example: What Is the Societal Value of SMAP Information?
The Soil Moisture Active Passive (SMAP) mission, launched by NASA in 2015, cost $916 million to design, develop, launch, and operate. What can society expect in return for this investment? Research is still underway to develop improved model predictions using information collected by SMAP, but tools to quantify the societal value of SMAP information already exist. Cooke and Golub (2020) link the societal value of SMAP information to its ability to reduce uncertainty in predicting soil moisture, and therefore its ability to reduce uncertainty in weather-related components that influence corn and soybean yields. They find that if SMAP can reduce the weather-related component of uncertainty in corn and soybean futures by 30 percent, the annual benefit to US consumers would be $1.44 billion.
Using transactions in financial markets to quantify the value of information has several benefits. First, much like with stated preference methods (Method 2 above), the impact assessment team doesn’t need to know about specific decision contexts and the mechanisms through which improved information leads to improved outcomes in those contexts. Decisionmakers who benefit from the information already have revealed the value of the information by purchasing or selling futures at given prices. Second, these methods allow impact assessment teams to quantify the value of information related to the degree to which the information reduces uncertainty for decisionmakers—and not just the degree to which the information influences actions and outcomes. As we will learn in a future explainer, scientific information can have value even if it does not change the actions of decisionmakers.
A major downside of this approach of using transactions in financial markets is, again, its limited applicability. The value of benefits associated with the information—e.g., the reduced cost of procuring seed corn—must in some way be transacted in a financial market in order for the impact assessment team to capture that value.
Conclusion
Which method should an impact assessment researcher choose to quantify the benefits of new information? It really depends on the type of information being assessed, including how decisionmakers use the information and whether the researcher can determine what actions the decisionmakers chose. Each method has its pros and cons; the impact assessment researcher must determine which method has the most pros and fewest cons for a particular application.
For example, experimental and quasi-experimental approaches probably are not suitable for assessing the value of information that is difficult to withhold from subsets of decisionmakers. In these situations, quantification based on decisionmaker testimonials, or stated preference methods, may work better. As mentioned earlier, consulting a social scientist may be the best route when making decisions about impact assessment design—but we hope this explainer has helped you gain a better understanding of the different approaches that are available for quantifying the differences in socioeconomically meaningful outcomes.
References
Cleary, K., Krupnick, A., Villaneuva, S., & Thompson, A. (2021). The Societal Value of NOAA's Digital Coast. RFF Report 21-03. Washington, DC: Resources for the Future.
Cooke, R., & Golub, A. (2020). Market-based methods for monetizing uncertainty reduction. Environment Systems and Decisions, 40(1), 3-13.
Nagaraj, A. (2022). The private impact of public data: Landsat satellite maps increased gold discoveries and encouraged entry. Management Science, 68(1), 564-582.
Straub, C. L., Koontz, S. R., & Loomis, J. B. (2019). Economic Valuation of Landsat Imagery. USGS Open-File Report 2019–1112. Reston, VA: US Geological Survey.
Stroming, S., Robertson, M., Mabee, B., Kuwayama, Y., & Schaeffer, B. (2020). Quantifying the human health benefits of using satellite information to detect cyanobacterial harmful algal blooms and manage recreational advisories in US Lakes. GeoHealth, 4(9), e2020GH000254.


