Climate Insights 2020: Opinion in the States
A public opinion survey reveals the state-level attitudes, opinions, and beliefs on climate change and policies designed to mitigate its effects.
Introduction
In prior installments in this report series, we showed that majorities of Americans believe that the earth has been warming, that this warming is caused by humans, and that Americans largely support public carbon pricing policies and tax incentives to address issues related to climate change.
Do those preferences shape public policy? According to some political theorists, democracies only function effectively if elected representatives enact the policies that their polities support (Dahl 1989). This is thought to lead to popular support of government and confidence in the democratic process. Public opinion can shape policy-making through at least two mechanisms: (1) elected representatives can learn the policy preferences of all of their constituents through representative sample surveys, and (2) constituents with passionate opinions on an issue can shape their representatives’ policy pursuits by voting, sending letters and making telephone calls to their representatives, attending protests, and more.
Public opinion surveys can transmit information to elected officials about their constituents’ wishes, and evidence suggests that representatives have at least sometimes been responsive to such data (Hulland, Baumgartner, and Smith 2018; Jacobs and Shapiro 2000). Yet it is hard to blame elected officials if they do not follow the will of the public, because useful survey data are rarely available. Government officials deal with numerous issues at any one time, and public opinion surveys rarely document opinions on all of those issues. More importantly, most surveys are of the nation as a whole, whereas no one in the US Congress represents the entire country. Instead, each representative is sent to the nation’s capital to represent a state or congressional district. Surveys measuring the opinions of residents of such limited geographic areas are even more rare and limited in scope than are national surveys. So to allow representatives to consider the views of all of their constituents, a new type of data must be provided to them.
In this report, we propose a new technique for generating such data, using high quality national surveys of representative samples of American adults to yield accurate assessments of opinions in the US states. We refer to this method as the aggregation-disaggregation technique (ADT). To implement the ADT, an investigator must have a large set of national surveys for which respondents were selected using unclustered sampling methods. That requirement rules out the use of the vast majority of what are called “household surveys,” which involve multistage random sampling of homes in clusters located near one another, thereby minimizing travel for interviewers. Instead, population surveys must involve either random digit dialing to landlines and cell phones by human interviewers or mailing paper questionnaires to households selected via simple random sampling from all those in the country.
To implement the ADT, one must first collect a set of conventionally sized surveys of representative samples of a single population (e.g., all American adults) that have asked the same question with the same wording in each survey. Normally, the surveys would have been conducted repeatedly over a sustained period of years. Having collected these data, the next step of the ADT is aggregation–combining all the data into a single dataset. Next, the disaggregation phase involves producing separate estimates of public opinion in each state. To do so involves multivariate estimation that statistically adjusts for changes in opinions over time to yield estimates of public opinion in each state in each year when a survey was conducted.
The ADT is built on two important assumptions that have foundations in the literatures on American public opinion and survey methodology. First, the ADT assumes that public opinion changes slowly over time, and that shifts at the national level are likely to occur roughly evenly across each of the states. Support for this presumption comes from research by Page and Shapiro (1992), who demonstrated first that public opinion is rarely subject to dramatic shifts over time. Furthermore, they found that different subgroups of the American population (as defined by demographics, for example) do not drift apart on issues of public policy and instead changed in sync with one another. Page and Shapiro (1992) referred to this phenomenon as “parallel publics,” whereby a change in public opinion in one subgroup was found in all other subgroups. Of special interest for the present inquiry, Page and Shapiro (1992) examined differences between geographic subgroups (Northerners vs. Southerners, Urban vs. Rural) on a multitude of issues and rarely found different trend lines in such groups. Their overwhelming body of evidence shows that public opinion shifts in parallel fashions across geographic subgroups.
The second assumption of the ADT is that random samples, when sufficiently powered, should not only provide accurate estimates of national public opinion but should also provide accurate estimates within states. True random sampling requires that all individuals in a population have a known, non-zero chance of being selected, and so-called “base weights” must be used to equate those probabilities of selection across sample members. The most common form of this involves random digit dialing (RDD) of landlines and cellphones. Research has found that samples recruited using these methods continue to yield highly accurate estimates of the population under study (Callegaro et al. 2014; Chang and Krosnick 2009; Cornesse et al. 2020; MacInnis, Krosnick, and Cho 2018; Yeager et al. 2011). Although an individual national probability sample may not have a sufficient number of observations in each of the 50 states to provide precise estimates of public opinion, combining data from many surveys conducted over time using probability samples can produce sufficient numbers of observations. For detailed information on the methodology of the survey and data included in this report, please see the Climate Insights 2020: Opinion in the States Technical Report, available under “Methodology and Data” here. For state-by-state public opinion data, please see the Appendix of this report.
![State Report v8[23545]_Page_01.png](https://media.rff.org/images/State_Report_v823545_Page_01.2e16d0ba.fill-620x800.png)
Data and Methodology
This report details the results of ADT estimation using a series of surveys conducted by the Political Psychology Research Group (PPRG) at Stanford University between 1997 and 2020 (for a description of the surveys’ methodologies, see the Climate Insights 2020: Opinion in the States Technical Report, available under “Methodology and Data” here). Using these data, we estimated public opinion on a range of different matters related to global warming in US states and produced maps documenting our findings.
Over the course of more than two decades, PPRG surveys have documented that large majorities of Americans believed that the earth has been warming, that that warming has been due to human activities, that warming poses a serious threat, and that government should take action to reduce future warming (e.g., Krosnick et al. 2006; Krosnick and MacInnis 2020). These surveys involved interviewing truly random samples of the American adult population, so they provide legislators and advocacy groups with accurate snapshots of what the public wants from its government. In all, 22 questions were asked in enough surveys to allow the application of the ADT, tapping what we call “fundamental” beliefs about climate change, engagement in the issue, and policy preferences. The wordings of the survey questions were balanced and unbiased, and the question topics are roughly summarized below, along with the years when each question was asked (for exact question wordings, the technical report):
Fundamentals:
- Global warming has been happening (1997, 2006-2015, 2018, 2020)
- Warming will continue in the future (2010-2012, 2015, 2018, 2020)
- Past warming has been caused by humans (1997, 2006-2012, 2014-2015, 2018, 2020)
- Warming will be a serious problem for the United States (1997, 2006-2010, 2012, 2015, 2018, 2020)
- Warming will be a serious problem for the world (2006, 2009-2010, 2012; 2015, 2018, 2020)
- 5 degrees of warming in 75 years will be bad (2007-2010, 2012, 2015, 2018, 2020)
- The US government should do more to address global warming (1997, 2006-2010, 2012, 2015, 2018, 2020)
Engagement:
- Warming is extremely personally important to the respondent (1997, 2006-2012, 2015, 2018, 2020)
- Highly knowledgeable about global warming (1997, 2006-2010, 2012, 2018, 2020)
Policies:
- The US should take action on the issue regardless of what other countries do (2008, 2010, 2012, 2015)
- The US government should limit greenhouse gas emissions by businesses (2009-2010, 2012, 2015, 2018, 2020)
- Limit greenhouse gas emissions by power plants (2006-2007, 2009-2012, 2014-2015, 2018, 2020)
- Favor a national cap-and-trade program (2008-2010, 2012, 2015, 2020)
- Increase fuel efficiency of cars (2006, 2007, 2009-2012, 2015, 2018, 2020)
- Build more all-electric vehicles (2009-2012, 2015)
- Build appliances that use less electricity (2006, 2007, 2009-2012, 2015, 2018, 2020)
- Build more energy-efficient buildings (2006, 2007, 2009-2012, 2015, 2018, 2020)
- Tax breaks to produce renewable energy (2006, 2009-2012, 2015, 2018, 2020)
- Tax breaks to reduce air pollution from coal (2009-2012, 2015, 2018, 2020)
- Tax breaks for nuclear power (2006, 2007, 2009-2012, 2015, 2018, 2020)
- Increase consumption taxes on electricity (2006, 2007, 2009-2012, 2015, 2018, 2020)
- Increase consumption taxes on gasoline (2006, 2007, 2009-2012, 2015, 2018, 2020
Figures 1–22 present maps showing state-level public opinion for 20 survey items as of 2020. Two additional maps show state opinions as of 2015—the most recent year in which those two questions were asked (on unilateral action and on building more all-electric vehicles). In some maps, some states have no percentage because too few survey respondents in that state were asked the question to permit reliable estimation.
The surveys of nationally representative samples of American adults that we analyzed are listed by year of data collection in Table 1 of the technical report. Sponsors included Ohio State University, Stanford University, ABC News, Time Magazine, The Washington Post, New Scientist Magazine, Planet Green, and the Associated Press. Data were collected by Abt SRBI, GfK Custom Research (formerly known as Knowledge Networks), Ipsos, TNS, the American Life Panel, and the Ohio State University Center for Survey Research. In most of these surveys almost all of the questions posed were about global warming. The remaining surveys were so-called “omnibus surveys” that included questions on many different topics, only a few of which were about global warming. Most surveys involved random digit-dial telephone interviewing, and a few involved data collected from probability samples of adults who answered questions via the Internet, recruited by random digit dialing and by mail.
Data from a total of 27,661 respondents were analyzed. Results are not reported when fewer than 50 people answered a question in a state. The state estimates and their standard errors appear in the Appendix in the report.
To view the Appendix, which includes all estimates and standard error of state public opinion data, please download the full PDF of this report by clicking the "Download" button at the top of this page.
Fundamentals of Global Warming
Across all seven fundamental opinions, majorities of the residents in all analyzed states hold what might be called “green” opinions–they believe that warming has been happening, that it is attributable to human activities, and that it poses a threat to the welfare of the United States and the world. More than 70% of the residents of all states believe that warming has occurred. In a majority of the states, belief in the existence of warming is greater than 80%. The largest majority is in Massachusetts (88%), and the smallest is in Utah (71%).
Figure 1. Percentage of each state who believe global warming has been happening (2020)
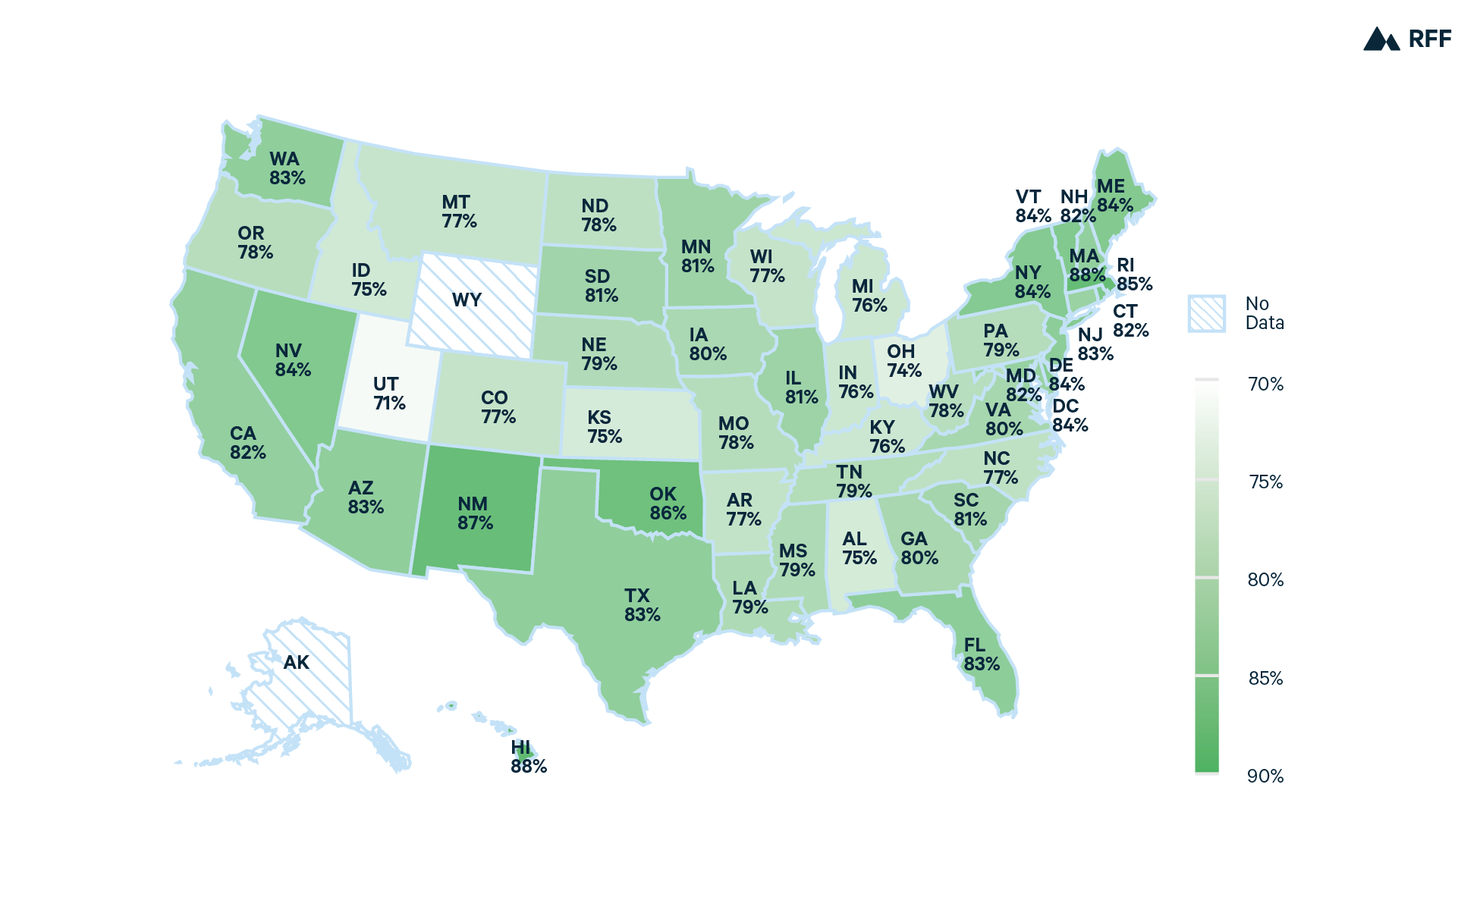
The largest majority of residents who believe that warming has been happening is in Massachusetts (88%).
Similarly, large majorities in all states believe that the world’s temperature will rise in the future if nothing is done to address it. The New England states of Rhode Island (86%) and Vermont (85%) have the largest majorities, and Idaho and Utah (both 61%) have the smallest. In only six states did fewer than 70% of residents believe that future warming will happen, and no states manifested majorities smaller than 60%.
Figure 2. Percentage of each state who believe that the earth will warm in the future (2020)

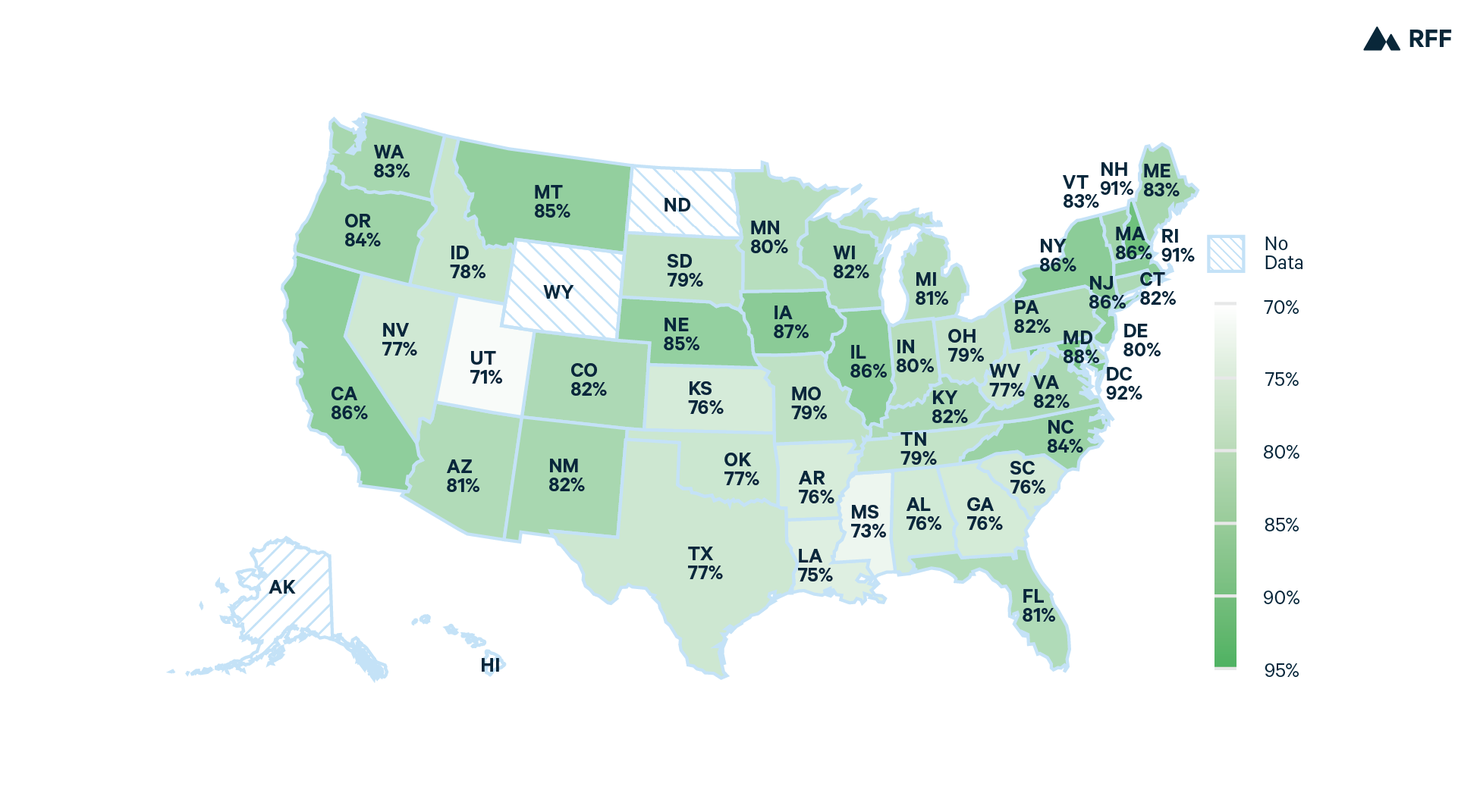
There is also widespread agreement that warming has been caused by human activity. The fraction of people expressing this opinion is never below 70% in any state. Utah has the smallest majority (71%), and Rhode Island and New Hampshire have the largest (91%). In general, greater levels of skepticism about people’s role in causing global warming appear in the South and in certain Midwestern and Western states.
Figure 3. Percentage of each state who believe past warming has been caused by humans (2020)
Majorities in all states believe that global warming will be a serious problem for both the United States and the world. Idaho has the smallest majorities holding these beliefs (60% and 62%, respectively), and Rhode Island leads the Northeastern states with the largest majorities (94% and 92%, respectively).
Figure 4. Percentage of each state who believe warming will be a serious problem for the United States (2020)
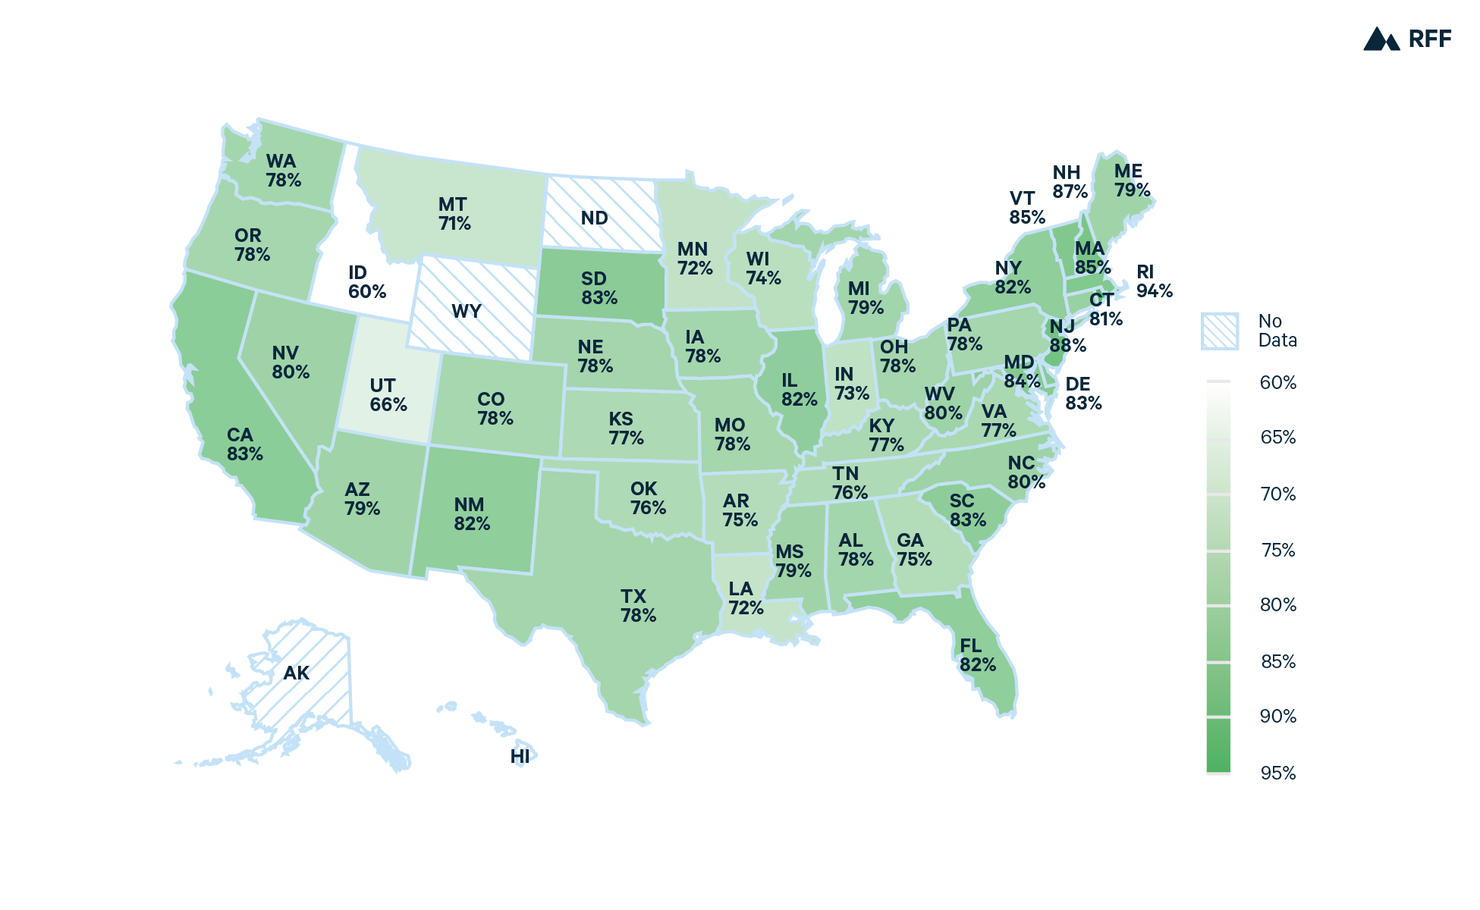
Figure 5. Percentage of each state who believe warming will be a serious problem for the world (2020)

Likewise, majorities of all states believe that 5 degrees of warming over the next 75 years will be bad. The smallest majorities appear in Idaho (58%) and Utah (55%), and most states are in the 60%-80% range. Large majorities appear in the Northeastern states, but the largest majorities appear in South Dakota (80%) and New Mexico (77%).
Figure 6. Percentage of each state who believe 5 degrees of warming will be bad (2020)

Sizable majorities of all states want the US government to do more than it is now to combat climate change. The smallest majorities appear in Western states like Idaho (53%), Utah (54%), and Nevada (60%), whereas the largest majorities are in Northeastern states like Rhode Island (82%) and New Jersey (77%).
Figure 7. Percentage of each state who believe government should do more to address global warming (2020)

Majorities of all states believe that 5 degrees of warming over the next 75 years will be bad, with the largest majorities in South Dakota (80%) and New Mexico (77%).
Public Engagement on Global Warming
The global warming “issue public” is the group of citizens who are passionate about the issue; do a great deal of thinking, talking, and learning about the issue; contribute money to lobbying groups to influence public policy on the issue; attend rallies to express their opinions; write letters to elected representatives for the same purpose; and vote based on the issue. In 2020, the global warming issue public reached an all-time high of 25%—more than 50 million adults. The size of the issue public varied across the states. The largest issue public is in Rhode Island (33%), and the smallest is in South Dakota (9%). Some states in the western portion of the country, such as California (31%), Arizona (31%), and New Mexico (31%), also have high levels of passion on the issue.
Figure 8. Percentage of each state for whom warming is extremely important personally (2020)

At least 60% of the residents of all states report having at least a moderate amount of knowledge about global warming, except South Dakota, where 53% report at least a moderate amount of knowledge about global warming. Majorities of 80% or more exist in 7 states, led by Vermont (85%).
Figure 9. Percentage of each state who say they are highly knowledgeable about global warming (2020)

Policy Preferences
Willingness for Active Government Action on Global Warming
Public opinion on matters of policy is often more divisive than that regarding the principles. For example, whereas large majorities of Americans favor equal rights, smaller groups of people favor specific policies designed to achieve equal rights. This is sometimes called the principle-implementation gap (Dixon, Durrheim, and Thomae, 2017). Such a gap is not generally present on the issue of global warming, though some policies to reduce warming in the future are more popular than others.
Large majorities across all states (as of 2015) do not see international cooperation as a pre-requisite for American action on global warming. Majorities that range from 63% in Indiana and Mississippi to 91% in New Hampshire favor US action regardless of what other countries are doing to reduce their emissions.
Figure 10. Percentage of each state who believe the United States should take action on climate change regardless of what other countries do (2015)

Support for Emissions Reduction and Carbon Pricing Policies
Huge majorities of over 70% in every state favor restrictions on businesses’ greenhouse gas emissions. These majorities range from a low of 71% in Mississippi to a high of 92% in Rhode Island. Majorities in all states also favor the government limiting power plant emissions. Support for government action to do so is no less than 68% in Utah, and support goes as high as 92% in Rhode Island.
Figure 11. Percentage of each state who believe the government should limit businesses' greenhouse gas emissions (2020)

Figure 12. Percentage of each state who favor the government requiring/encouraging power plants to lower emissions (2020)

Huge majorities of over 70% in every state favor restrictions on businesses’ greenhouse gas emissions.
Majorities of most states, but not all, favor a cap-and-trade system in which the government would sell permits to companies limiting the amount of greenhouse gases they can put out, while also allowing companies that emit more to purchase permits from companies that emit less. Relatively few are supportive of this in Western states like Idaho (39%), Nevada (47%), and Utah (48%). The program was much more popular in the Mid-Atlantic and Northeast regions. However, the highest levels of support are found in Washington (72%) and Nebraska (70%).
Figure 13. Percentage of each state who favor a national cap-and-trade program (2020)

Regulations, Tax Incentives, and Taxes
Next, we turn to policies that fall into three broad categories: business regulations intended to reduce emissions, tax incentives for industries to innovate, and taxes on individuals intended to reduce energy consumption.
Looking first at business regulations and tax incentives to combat global warming, we find high levels of support across the states. On issues related to the automobile industry, majorities in nearly every state support policies intended to increase fuel efficiency standards. On the topic of increasing fuel economy requirements—known as Corporate Average Fuel Economy, or CAFE Standards—more than 60% of respondents in every state favor raising them. Support ranges from 60% in Oklahoma to 79% in Washington, New Jersey, and Rhode Island (see Figure 14).
Figure 14. Percentage of each state who favor the government requiring/encouraging higher fuel economy standards (2020)

As of 2015, government encouragement for the manufacturing of all-electric cars was supported by majorities in all but four states. Support ranges from 43% in Alabama to 69% in Washington and New Hampshire.
Figure 15. Percentage of each state who favor the government requiring/encouraging all-electric vehicles (2015)

Encouraging or requiring more energy-efficient appliances draws majority support in all states surveyed, with majorities ranging from 52% in Idaho to the upper-70s in Northeastern states like New Hampshire (78%), New York (78%), and New Jersey (77%). Support for increasing the energy efficiency of buildings drew similar support: supportive majorities range from the low-60s in Western and Southern states like Idaho (62%), Mississippi (64%), Utah (65%), and Arkansas (66%), to the low-80s in states like West Virginia (84%) and Maryland (83%).
Figure 16. Percentage of each state who favor the government requiring/encouraging appliances that use less electricity (2020)

Figure 17. Percentage of each state who favor the government requiring/encouraging energy-efficient buildings (2020)

Majorities of all states favor tax breaks for utilities producing electricity from renewable sources. Even in Mississippi, the state with the weakest support, 71% of individuals favor these types of tax breaks, and support goes as high as 91% in Montana. Majorities in every state also support tax incentives to encourage the adoption of cleaner coal technologies. The majorities are the largest in coal-producing states like West Virginia (79%) and Kentucky (73%) and smallest in the states of Nevada (53%) and Vermont (54%). This pattern is consistent with the notion that coal-producing state residents would like to preserve their local industries by reducing the deleterious impact that those industries have on the environment.
Figure 18. Percentage of each state who favor tax breaks to produce renewable energy (2020)

Figure 19. Percentage of each state who favor tax breaks to reduce air pollution from coal (2020)

Majorities in every state support tax incentives to encourage the adoption of cleaner coal technologies. The majorities are the largest in coal-producing states like West Virginia (79%) and Kentucky (73%).
Providing tax breaks to encourage the construction of more nuclear power plants is an unpopular policy. A minority of respondents in all states except Idaho (51%) and South Carolina (54%) favor such tax breaks. Opposition to nuclear power tax breaks is greatest in states in the Northeast and Northwest. Residents of Rhode Island manifested the lowest levels of support for tax breaks for building nuclear policy (20%), followed by Oregon (28%), Washington (29%), Maine (30%), and Iowa (30%).
Figure 20. Percentage of each state who favor tax breaks to build nuclear power plants (2020)

The least popular policies are those that would involve consumer tax increases intended simply to manipulate people’s behavior with no stated use of the raised revenue. In no state did a majority of individuals favor increasing consumption taxes on electricity in order to cause people to use less of it, with support ranging from as low as 14% in New Hampshire and no higher than 37% in Colorado. Support for increasing taxes on gasoline in order to cause people to use less of it is slightly more popular. The minorities favoring this policy were especially small in rural states and Southern states, including Idaho (24%), Alabama (26%), South Carolina (26%), and Kansas (26%). Small majorities in favor appeared in some Western states like Colorado (57%) and Nevada (55%).
Figure 21. Percentage of each state who favor increased consumption taxes on electricity (2020)

Figure 22. Percentage of each state who favor increased consumption taxes on gasoline (2020)

Correlates of State-Level Public Opinion
As the maps show, the public largely believes that climate change is real and a threat to society, but notable variation exists between the states. Some states are reliably more environmentally conscious than others, and the sizes of the majorities shift from question to question.
What might influence state-level variation? Several plausible explanations spring to mind. First, there exists a documented gap in green attitudes between Democrats and Republicans (Krosnick, Holbrook, and Visser 2000; Nisbet 2009; Malka, Krosnick, and Langer 2009), which might manifest as a red/blue divide at the state level.
Temperature may also explain the variation. Warmer states–states that have a higher average temperature over the years–may experience much hotter summers than other states, making residents especially aware of the heat and how more extreme heat disrupts their lives and costs them money. Therefore, people in warmer states may be more likely to believe that global warming has been happening and that if unchecked, it will be a serious problem, leading to a greater level of acceptance in fundamentals. A greater level of acceptance of fundamentals may in turn lead to attaching more personal importance to the issue of global warming and in turn becoming more engaged in the issue. On the other hand, people living in hot states might believe that they have already learned to adapt (by making air conditioning available in most buildings) and can and will adapt to more heat from continued warming. So these people may not manifest greater support for policies to reduce future global warming.
Individuals living in states that have experienced high levels of damage caused by climate-related disasters may be more motivated to take action on climate change, since the negative consequences of climate impacts are not an abstract danger but a real and persistent threat.
On the other hand, if people believe that government regulations to limit greenhouse gas emissions would cause prices to rise in ways that hurt the economy, then people living in these states that are especially economically vulnerable might be especially resistant to such regulations. For example, people living in states with lower individual incomes might be more likely to object to emissions-limiting laws, and people in higher income states may be more likely to favor those policies, because higher income serves as an economic buffer to absorb the potential costs of these policies. People living in states where gasoline or electricity prices are highest and commuting is most pervasive might feel especially vulnerable to increasing fuel prices, so people in these states might be most resistant to emissions-limiting regulations.
The mitigation policies examined in this report are designed to reduce greenhouse gas emissions and shift the nation’s energy generation from coal, oil, and gas toward non-emitting sources. Therefore, these mitigation policies are likely to have more direct and stronger economic impacts on people in states in which a larger proportion of jobs are in the oil, coal, or gas sectors.
Coal production has been steadily declining, with increasingly more coal power plants closing, while natural gas production has been rapidly expanding. This shift has been attributed, in part, to higher cost of coal production compared to natural gas production, with economists and other scholars predicting that the decline in US coal production (closing coal power plants and reduced output from existing coal power plants) is irreversible and will continue. Confronting the continued contraction of the coal market and attributing natural gas production to be its main competitor on jobs, people in states with higher coal production may favor a complete switch toward clean energy rather than a more expanded natural gas production, thus conferring enhanced enthusiasm for the mitigation policies. By the same token, protecting the rising economic strength of natural gas production and perceiving that clean energy is a competitor to which they may lose their jobs, people in states with more natural gas production may be more likely to oppose a complete switch toward clean energy, thus dampening their support for the mitigation policies.
Method
To explore potential explanations for variations in state-level opinion, we estimated the parameters of seemingly unrelated ordinary least squares (OLS) regression equations predicting opinions about global warming in the states using the aforementioned factors. We categorized the 20 global warming opinions in 2020 into three types as discussed earlier: fundamentals, engagement, and policy support, and created an index of each by averaging the measures within each category, thus yielding an index of the seven measures of fundamentals of global warming, an index of the two measures that measure engagement on the issue, and an index of the 11 policy measures for which we have estimates of public opinion in 2020. Hawaii and North Dakota were excluded from the analysis because these two states have estimates for only one of the fundamentals and no measures of the engagement or policy opinions.
The predictors are percentage of votes for President Trump in the 2016 election, which is to capture each state’s general political orientation; average temperature; economic damage due to climate disasters in the state; per capita income (to measure the economic buffer), consumer electricity costs and retail gasoline costs to measure energy costs; and the amount of coal production and natural gas production in the state (for the data sources and coding for these predictors, see the technical report).
Predicting Fundamentals
As expected, people in states that conferred more votes to President Trump in the 2016 election exhibited a lower level of acceptance of the fundamentals of global warming. The magnitude of the association of political orientation with the fundamentals is surprisingly small: a ten percentage points increase in the share of votes for President Trump in 2016 (ten percentage points was about the difference between Connecticut, in which President Trump received 41% of the votes, and Iowa, where President Trump received 51% of the votes) correlates with a decrease of 1.7 percentage points in the proportion of people accepting (or believing in) global warming fundamentals.
As expected, people in warmer states manifested more belief in fundamentals. The magnitude of the association of average temperature with fundamentals is considerable: a one-unit increase in the square root of average temperature (a one-unit increase in the square root of average temperature is about the difference between Texas, where the average temperature was 64.6 and its square root is 8, and Nevada, where the average temperature was 49.5 and its square root is 7) correlates with an increase of 2.2 percentage points in the proportion of people accepting (or believing in or embracing) global warming fundamentals.
Consistent with expectations, higher consumer electricity prices predict greater acceptance of global warming fundamentals. The magnitude of the influence of average temperature on fundamentals is markedly large: for every one percent increase in consumer energy prices, there is an 8.8 percentage point increase in the proportion of people accepting global warming fundamentals.
Other predictors, including per capita income, gas prices, economic damage due to climate disasters, and percentage of national coal and natural gas production attributable to the state, were not significantly related to more people accepting global warming fundamentals.
Figure 23. Predictors of acceptance of global warming fundamentals (2020)

Predicting Engagement
As expected, people in states that conferred more votes to President Trump in the 2016 election exhibited a lower level of engagement in the issue of global warming. A ten-percentage-point increase in the share of votes for President Trump in 2016 (ten percentage points was about the difference between Connecticut and Iowa) correlates with a decrease of 4.0 percentage points in engagement.
As expected, people in warmer states are more engaged in the issue of global warming. The magnitude of the association of average temperature with issue engagement is sizable: a one-unit increase in the square root of average temperature (a one-unit increase in the square root of average temperature was about the difference between Texas and Nevada) correlates with an increase of 2.8 percentage points in issue engagement.
The remaining predictors in the model were not significantly related to level of engagement on global warming. These included per capita income, residential energy prices, gas prices, economic damage due to climate disasters, and percent of GDP from coal and natural gas” to “percent of national coal and natural gas production attributable to the state.
Figure 24. Predictors of global warming issue engagement (2020)

Predicting Policy Support
As expected, people in states that conferred more votes to President Trump in the 2016 election exhibited a lower level of support for mitigation policies to reduce future global warming. The magnitude of the influence of political orientation on engagement is relatively small: a ten percentage point increase in the shares of votes for President Trump in 2016 (ten percentage points was about the difference between Connecticut and Iowa) correlates with a decrease of 1.6 percentage points in support for the mitigation polices.
Also consistent with expectations, higher-income states are more supportive of mitigation policies. The magnitude of the influence of income on policy support is quite large: for every one percent increase in consumer income, there is an associated 6.0 percentage point increase in the level of favoring those mitigation policies.
As hypothesized, people in states with higher coal production are more likely to embrace mitigation policies, and people in states with higher natural gas production are less likely to support mitigation policies. The magnitude of the influence of coal production on policy support is larger than that of natural gas production. For a two percentage point increase in coal production (approximately the difference between Texas, which has 3.3 percent in coal production and Montana, which has 5.1 percent in coal production), there is an approximately one percentage point increase in the level of favoring those mitigation policies. Likewise, a ten percentage point increase in natural gas production (approximately the difference between Oklahoma, which has 9.3 percent in natural gas production and Pennsylvania, which has 19.5 percent in natural gas production), there is an approximately 1.5 percentage point decrease in the level of favoring those mitigation policies.
The remaining predictors, including average state temperature, per capita income, residential energy prices, gas prices, and economic damage due to climate disasters, were not significantly related to more people favoring those mitigation policies.
Figure 25. Predictors of support for global warming mitigation policies (2020)

People in states with higher coal production are more likely to embrace mitigation policies, and people in states with higher natural gas production are less likely to support mitigation policies.
Representation of Public Opinion in Government
To what degree are the public opinion differences between states reflected in the voting behavior of their elected representatives in the US Congress? To assess the strength of this connection, we tested two models of representation simultaneously. The first model proposes that the opinions of all residents of a state might influence policymakers via surveys of representative samples of those individuals. The greener the state as a whole, the more likely its representatives might be to vote for policies intended to protect the natural environment. The second model proposes that members of the issue public may send signals directly and indirectly to elected representatives (via phones calls, letters, emails, visits to their offices, and participation in town halls). Thus, because the global warming issue public is more than 90% on the green side of the issue, the larger the issue public in a state, the more likely their representatives might be to vote for policies intended to protect the natural environment.
To test these models, we used these two attributes of each state (the entire population’s endorsement of mitigation policies and the size of the issue public) to predict green voting by members of Congress. The latter was gauged using the score for each member in the first session of the 116th Congress from the League of Conservation Voters (LCV). This LCV scorecard is based on the consensus of experts from approximately 20 environmental and conservation organizations who selected the key votes on which members of Congress should be scored, on climate change, energy, public health, public lands use and wildlife conservation, and spending for environmental programs (LCV 2019).
All US Senators and all House members were assigned a score ranging from 0 to 100, with 0 meaning the least pro-environmental voting and 100 meaning the most pro-environmental voting. These roll-call votes do not map perfectly on to the issues addressed in PPRG surveys; they capture legislative activity on environmental issues that seem likely to indicate support for or opposition to government efforts to protect the environment and reduce global warming. Each state produced three voting scores to be predicted: one for each of the two US Senators representing the state, and another the average of the scores of all the members of US House for the state. A total of 46 states were included in this analysis because they each had sufficient numbers of survey respondents to generate reliable measures of opinions.
An ordinary least squares regression predicting pro-environment voting in Congress lends support to both models of public representation in Congress (see Table 3 of the technical report). As expected, the larger the majority in the state endorsing global warming mitigation policies, the more likely their representatives were to vote for green policies. Every percentage point increase in green policy views was associated with a nearly 5.4-point increase in the grade assigned to the legislator by the LCV. And the larger the global warming issue public in the state, the more likely their representatives were to vote for green policies. Every extra percentage point of people in a state for whom global warming is personally extremely important was associated with a roughly 1.46-point increase in the LCV score.
Figure 26. Predictors of voting tendencies of US Members of Congress based on their states’ constituencies (2020)

Conclusion
There are various pieces of good news for democracy in America in this report. First, we have demonstrated the operation of a new statistical technique to combine survey data collected over decades from representative national samples asked the identical question to generate statistics of normative value for elected representatives. Instead of paying for one high quality survey in each state to generate reliable numbers, at substantial expense, it is possible to aggregate and disaggregate national survey data to yield needed characterizations of almost all states in the country. The ADT can be implemented, using the same methods employed here, to generate measures of state-based public opinion on a wide variety of issues of interest to legislators, as long as survey organizations have invested in conducting national surveys according to best practices and measuring opinions comparably.
Second, on the issue of global warming, we see here easily interpretable signals to policymakers about how their constituents would like them to vote on policy issues related to global warming. The maps characterize opinion in each state on each issue, and these distributions of opinions clearly differ across issues. Regarding some policies, majorities, large majorities, or huge majorities are in favor. Regarding other policies, sizable majorities are opposed. This is just the sort of guidance that policymakers can use if they wish to shape their voting decisions according to the will of their constituents.
Furthermore, the map showing the size of the issue public in each state is informative to policymakers as well. If they choose to act upon the desires of a passionate—and growing—base of climate action supporters, the numbers they need to see are in that map. As we showed in our earlier report in this series, at the time of elections, these are the individuals who can be roused to vote for a candidate who takes green positions on global warming. The issue public across the American states can inform a senator who espouses such positions on the size of the coalition of supporters he or she is likely to build from doing so. Aggregating other coalitions of voters by taking specific stands on other policy issues can be a pathway to electoral victory. Thus, candidates running for office have more incentive to spend time talking about endorsement of green policies in states where the issue public is larger.
Additional good news comes from evidence of the validity of the numbers in the maps. We tested a variety of hypotheses about the possible correlates of endorsement of fundamentals, engagement in the issue, and support for mitigation policies, and support for a number of these hypotheses appeared. This is substantively interesting for understanding how the physical and economic context of a state can shape the opinions of its residents. These sensible relations also reinforce confidence in the validity of the estimates produced by the ADT, because those estimates were produced completely independently of the values of the predictors used to test these hypotheses.
On the issue of global warming, we see here easily interpretable signals to policymakers about how their constituents would like them to vote on policy issues related to global warming.
Still more good news comes from the evidence that voting in the US Congress reflects public opinion. Specifically, we saw that the larger the majority of state residents who endorse mitigation policies, the more likely elected representatives were to vote for policies like them. And in addition, the larger the global warming issue public in a state, the more likely its members of Congress were to vote in green ways. If we had seen no such relations, that would have raised serious questions about whether public opinion has played any role in shaping federal policymaking. However, the fact that such relations do appear provides reassurance and incentives to Americans to express their opinions in surveys and directly to their legislations.
It is interesting to note that roll call votes are the byproduct of agenda setting by Senate and House leaders, who may choose not to bring drafted legislation up for a vote if they are worried that it will show representatives to be out of step with their constituents (Cox and McCubbins 1993; 2005). Through this procedural activity, policymakers have demonstrated a desire to not only use their votes to reflect the will of their district or state, but also to avoid voting on issues that might undermine or contradict the popular opinion of the constituents that they represent.
To be sure, examples of disconnect—of legislators who appear out-of-step with their constituents on global warming—do exist. Such disconnects are evidence of the breakdown of democratic representation in those states, and may result from forces, and sometimes very strong forces, other than public opinion influencing legislators’ behavior. We should not presume that legislators will always vote as the majority of their constituents want, because even if public opinion does exert an influence, campaign contributions, party leaders and the White House, educational efforts of lobbying experts, logrolling, and other forces can and do shape the votes of members of Congress as well (Jacobs and Shapiro, 2000).
Thus, disconnects between public opinion and policymaker voting persist and should come as no surprise. But as we have seen here, at least on the issue of global warming, the views of general publics and of issue publics appear to be reflected in, though not determinative of, the policymaking process.
Appendix
To view the Appendix, which includes all estimates and standard error of state public opinion data, please download the full PDF of this report by clicking the "Download" button at the top of this page.
Data Tool
Technical Report
References
Callegaro, Mario, Ana Villar, David Yeager, and Jon A. Krosnick. “A Critical Review of Studies Investigating the Quality of Data Obtained with Online Panels Based on Probability and Nonprobability Samples” in Online Panel Research: A Data Quality Perspective, Mario Callegaro, Reg Baker, Jelke Bethlehem, Anja Goritz, Jon A. Krosnick, Paul Lavrakas, eds. (Wiley & Sons, New York, 2014), pp. 23-53.
Chang, Linchiat and Jon A. Krosnick. 2009. “National Surveys Via RDD Telephone Interviewing Versus the Internet: Comparing Sample Representativeness and Response Quality,” Public Opinion Quarterly, 73(4): 641–678.
Cornesse, Carina, Annelies G. Blom, David Dutwin, Jon A. Krosnick, Edith D. DeLeeuw, Stephane Legleye, Josh Pasek, Darren Pennay, Benjamin Phillips, Joseph W. Sakshaug, Bella Struminskaya, and Alexander Wenz. 2020. “A Review of Conceptual Approaches and Empirical Evidence on Probability and Nonprobability Sample Survey Research.” Journal of Survey Statistics and Methodology, 8(1): 4-36.
Cox, Gary W. and Mathew D. McCubbins. 1993. Legislative Leviathan: Party Government in the House. Berkeley: University of California Press.
Cox, Gary W. and Mathew D. McCubbins. 2005. Setting the Agenda: Responsible Party Government in the US House of Representatives. New York: Cambridge University Press.
Dahl, Robert A. 1989. Democracy and Its Critics. New Haven: Yale University Press.
Dixon, John, Kevin Durrheim, and Manuela Thomae. 2017. “The Principle-Implementation Gap in Attitudes toward Racial Equality (and How to Close It).” Political Psychology, 38: 91-126
Hulland, John, Hans Baumgartner, and Keith Marion Smith. 2018. “Marketing Survey Research Best Practices: Evidence and Recommendations from a Review of JAMS Articles.” Journal of the Academy of Marketing Science, 17(1): 92-108.
Jacobs, Lawrence R. and Robert Shapiro. 2000. Politicians Don’t Pander: Political Manipulation and the Loss of Democratic Responsiveness. Chicago: University of Chicago Press.
Krosnick, Jon A., Allyson L. Holbrook, Laura Lowe, and Penny S. Visser. 2006. “The Origins and Consequences of Democratic Citizens’ Policy Agendas: A Study of Popular Concern about Global Warming.” Climatic Change, 77: 7-43.
Krosnick, Jon A., Allyson L. Holbrook, and Penny S. Visser. 2000. “The Impact of the Fall 1997 Debate about Global Warming on American Public Opinion.” Public Understanding of Science, 9(3): 239-260.
LCV 2019. 2019 National Environmental LCV Scorecard – First Session of the 116th Congress. Available from scorecard.lcv.org.
MacInnis, Bo, Jon A Krosnick, Annabell S Ho, and Mu-Jung Cho. 2018 “The Accuracy of Measurements with Probability and Nonprobability Survey Samples: Replication and Extension,” Public Opinion Quarterly, 82(4): 707–744.
Malka, Ariel, Jon A. Krosnick, and Gary Langer. “The Association of Knowledge with Concern about Global Warming: Trusted Information Sources Shape Public Thinking.” Risk Analysis, 29(5): 633-647.
Nisbet, Matthew C. 2009. “Communicating Climate Change: Why Frames Matter for Public Engagement,” Environment: Science and Policy for Sustainable Development, 51(2): 12-23
Page, Benjamin I. and Robert Y. Shapiro. 1992. The Rational Public: Fifty Years of Trends in American Policy Preferences. Chicago: University of Chicago Press.
Villar, Ana and Jon A. Krosnick. 2011. “Global Warming vs. Climate Change, Taxes vs. Prices: Does Word Choice Matter?” Climatic Change, 105: 1-12.
Yeager, David S., Jon A. Krosnick, Linchiat Chang, Harold S. Javitz, Matthew S. Levendusky, Alberto Simpser, and Rui Wang. 2011. “Comparing the Accuracy of RDD Telephone Surveys and Internet Surveys Conducted with Probability and Non-probability Samples.” Public Opinion Quarterly, 75(4): 709–747.


