Global Energy Outlook 2024: Peaks or Plateaus?
RFF's annual Global Energy Outlook harmonizes a range of long-term energy projections to find key trends in global energy consumption, emissions, and geopolitics.


1. Introduction
The future of the global energy system is deeply uncertain, and the choices that are made in the coming years will have enormous consequences for the future of the climate and, indeed, human civilization. To understand how our energy system is changing, each year a variety of organizations produce long-term projections that imagine a wide range of futures based on divergent visions about policies, technologies, prices, and geopolitics.
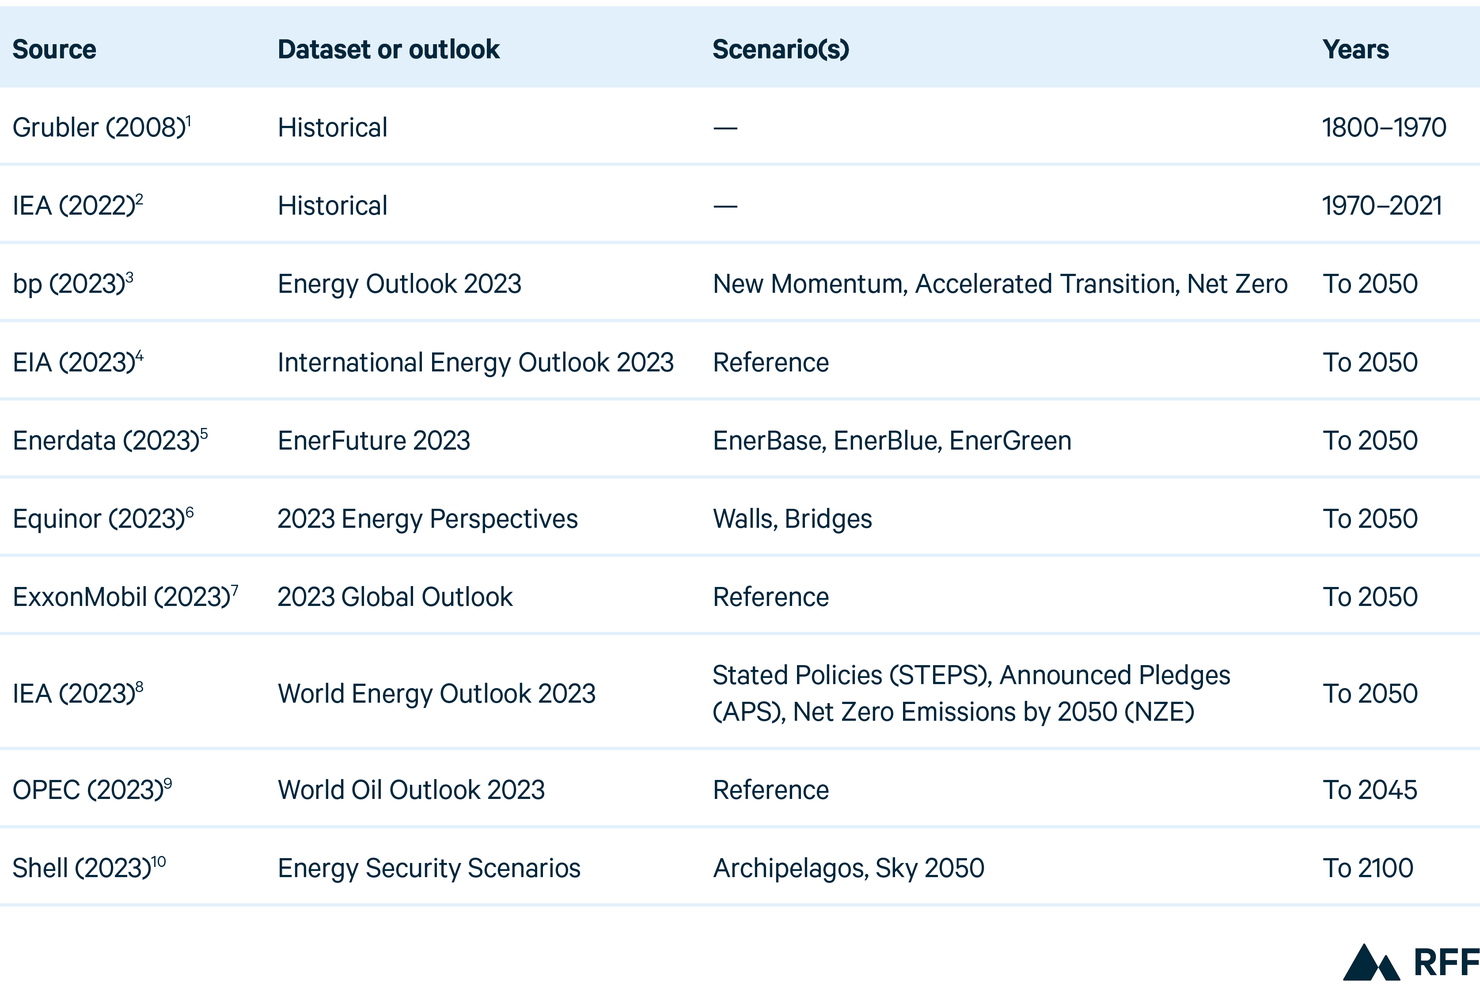
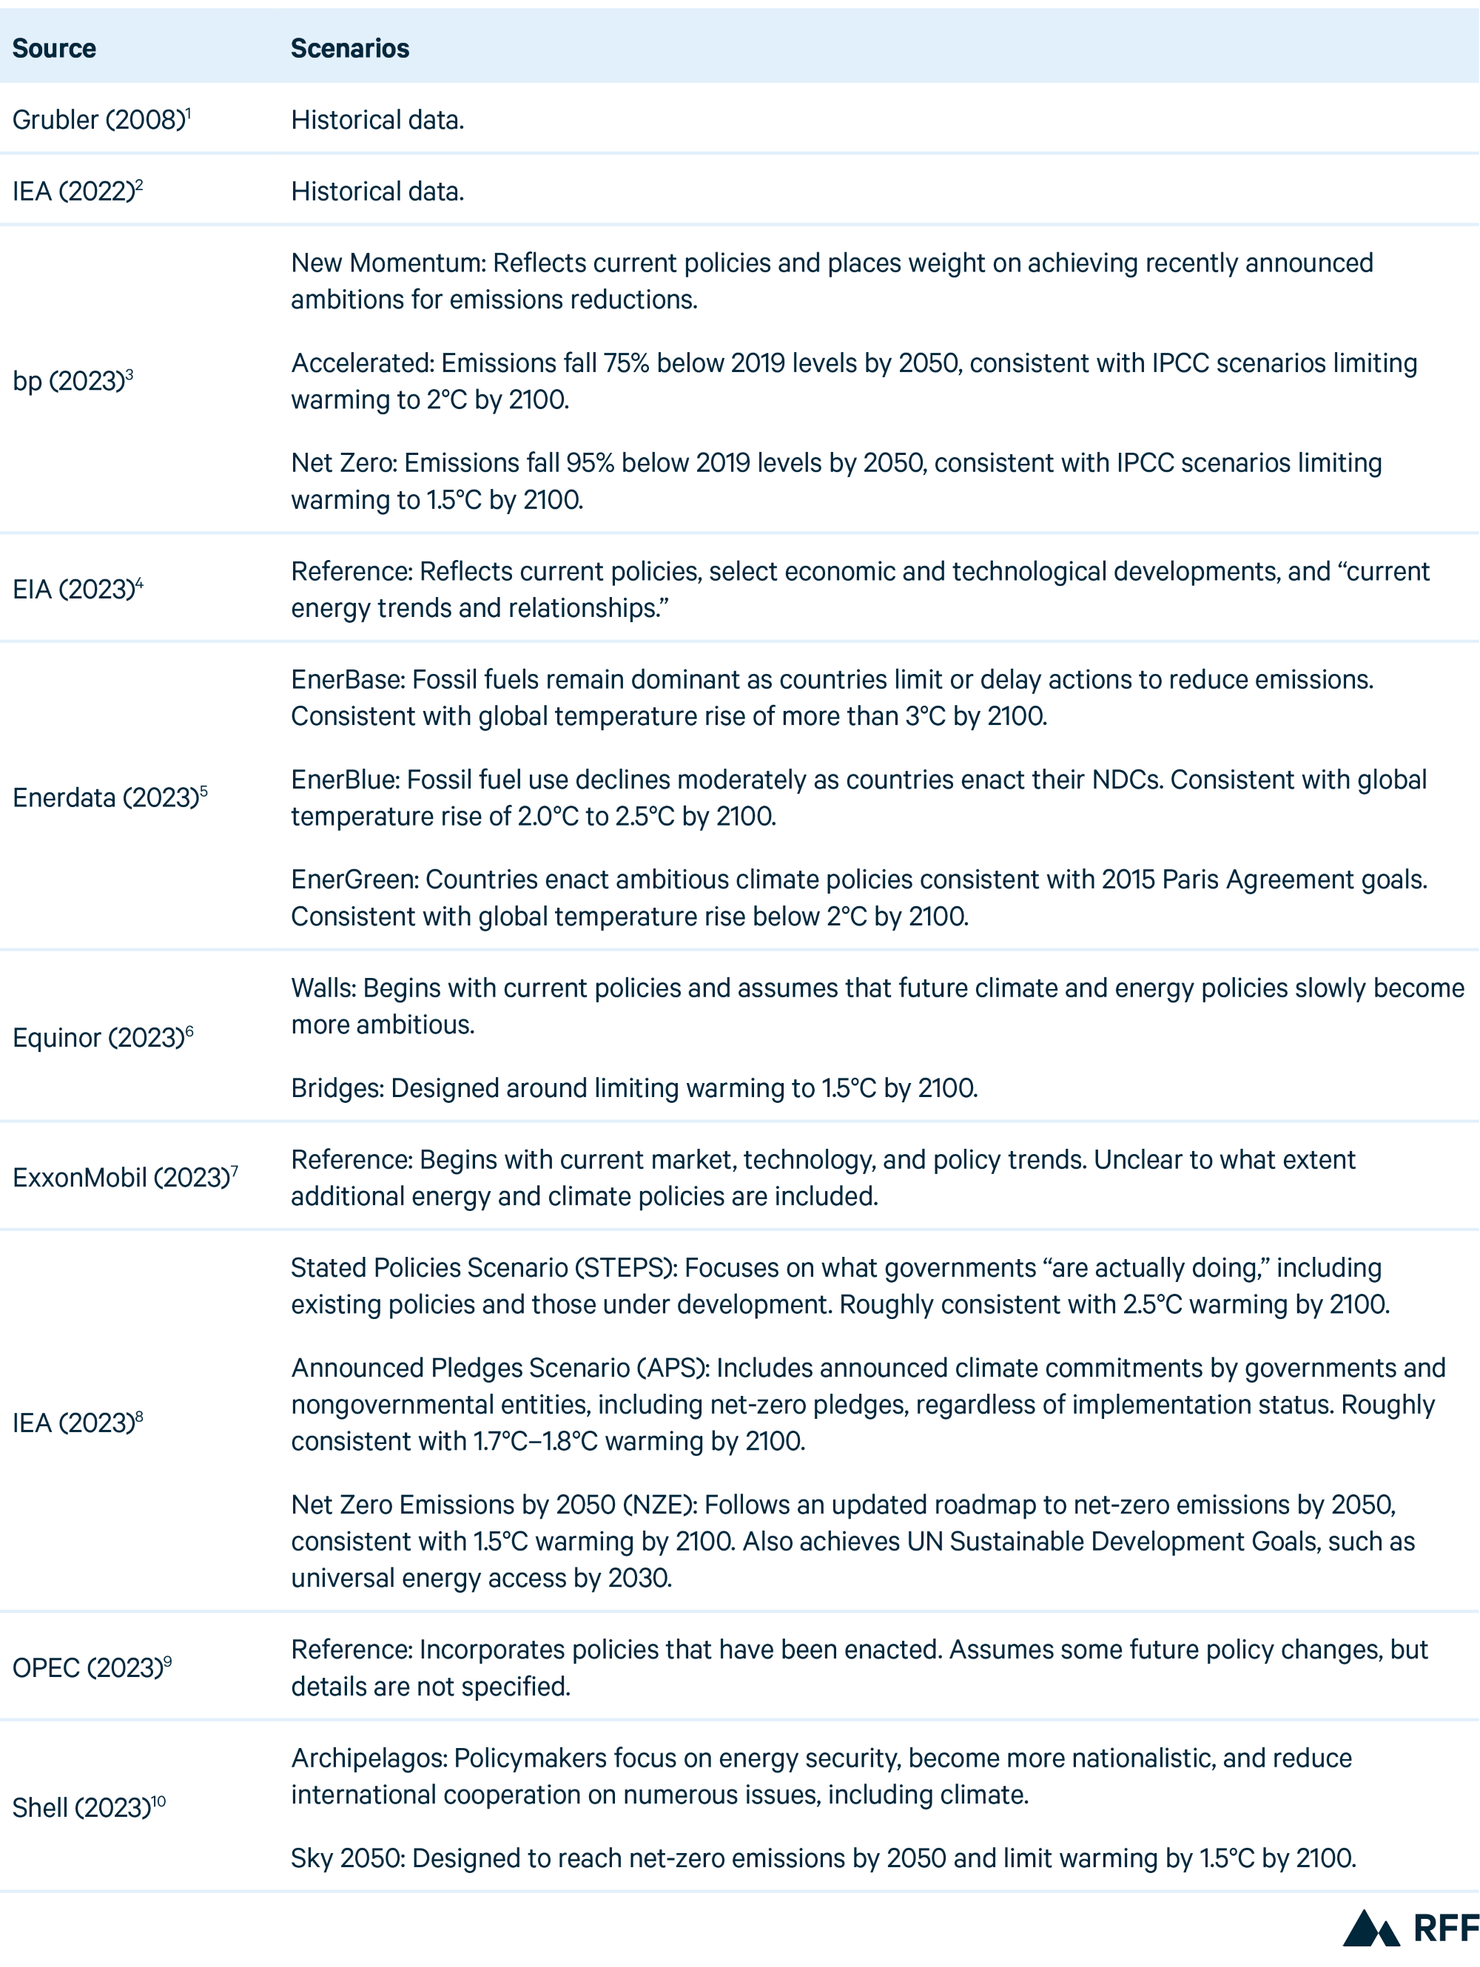
Because these projections vary widely and depend heavily on their varied assumptions and methodologies, they are difficult to compare on an apples-to-apples basis. In this report, we apply a detailed harmonization process to compare 16 scenarios across eight energy outlooks published in 2023, as well as two historical data sources. Taken together, these scenarios offer a broad scope of potential changes to the energy system as envisioned by some of its most knowledgeable organizations. Table 1 lists the historical datasets, outlooks, and scenarios examined here, and additional detail is provided in Section 4.
Table 1. Datasets, Outlooks, and Scenarios Examined in This Report
A brief description of our methodology is provided in Section 4, with select indicators in Section 5. For the full methodology and interactive graphing tools, visit www.rff.org/geo.
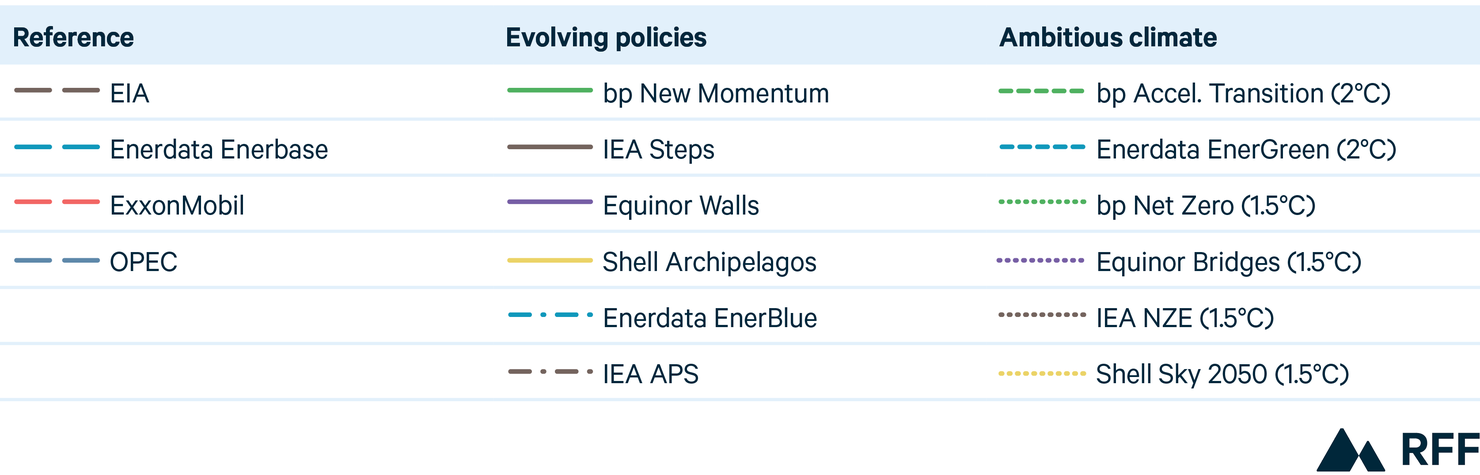
Throughout the figures included in this report, we use a consistent labeling system that distinguishes among the different types of scenarios (see Table 2):
- For Reference scenarios, which assume limited or no new policies, we use long-dashed lines; this set comprises Reference scenarios from the US Energy Information Administration (EIA), Enerdata’s EnerBase, ExxonMobil, and OPEC.
- For Evolving Policies scenarios, which assume that policies and technologies develop according to recent trends or the expert views of the team producing the outlook, we use solid lines; this set comprises bp New Momentum and IEA STEPS. Although they do not follow the same sets of assumptions, we also include Equinor Walls and Shell Archipelagos because their CO2 emissions trajectories are similar to those in other Evolving Policies scenarios. In addition, we include Enerdata’s EnerBlue and IEA’s APS, which assume governments implement their nationally determined contributions (NDCs) under the Paris Agreement; for these, we use dot-dash lines.
- Ambitious Climate scenarios are not designed around policies but instead are structured to achieve specific climate targets. For those that limit global mean temperature rise to below 2°C by 2100 (bp’s Accelerated Transition and Enerdata’s EnerGreen), we use short-dashed lines. For scenarios designed to limit global mean temperature rise to 1.5°C by 2100 or net-zero emissions by 2050 (bp Net Zero, Equinor Bridges, IEA NZE, and Shell’s Sky 2050), we use dotted lines.
Table 2. Legend for Different Scenario Types
Figures and tables in this report sometimes refer to regional groupings of East and West. Table 3 defines those regional groupings.
Table 3. Regional Definitions for "East" and "West"

2. Key Findings
At the 28th Conference of the Parties (COP28) to the United Nations Framework Convention on Climate Change held in Dubai, world leaders agreed to “transitioning away from fossil fuels in the energy system.” Some advocates, governments, and civil society figures have critiqued this agreement and argued instead for the total phaseout of fossil fuels to achieve long-term climate goals. However, all scenarios examined here, including those consistent with limiting warming to 1.5°C by 2100, show substantial global fossil fuel consumption through at least 2050, suggesting that a phaseout is not a prerequisite to achieving international climate goals.
Figure 1. Global Fossil Fuel Demand Peaks and Declines Rapidly in Ambitious Climate Scenarios
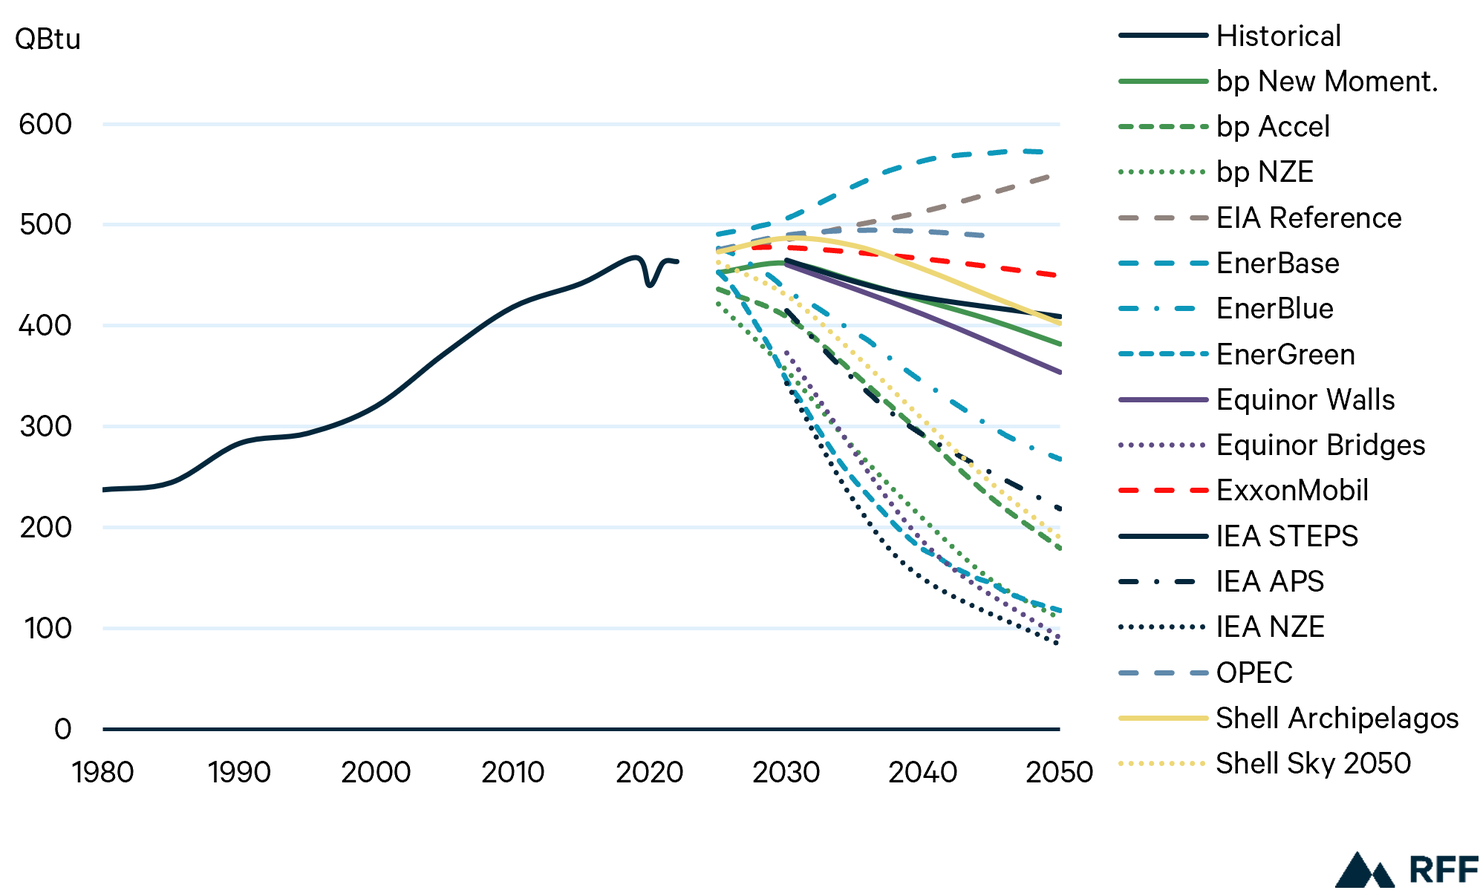
Note: Includes primary energy demand for coal, oil, and natural gas. Historical data from Shell.
As we have noted in previous Global Energy Outlooks, world primary energy demand has experienced a series of energy additions, not energy transitions, with newer technologies such as nuclear, wind, and solar building on top of incumbent sources such as biomass, coal, oil, and natural gas. To achieve international climate goals and limit warming to 1.5°C or 2°C by 2100, a true energy transition is needed. But does achieving such goals require phasing out fossil fuels entirely?
The scenarios we analyze in this report suggest that the answer is no. Like most scenarios published in recent years by the Intergovernmental Panel on Climate Change (IPCC), fossil fuel use declines but remains substantial through midcentury and beyond, even under scenarios that limit warming to 1.5°C. Several Ambitious Climate scenarios show global fossil fuel use of roughly 100 quadrillion British thermal units (QBtu) in 2050, slightly higher than total US primary energy demand. The wide range of projected fossil fuel demand also highlights the deep uncertainty of the future of the world energy system, with 2050 scenarios spanning 487 QBtu, roughly equivalent to global consumption of fossil fuels in 2022.
If fossil fuels are not phased out of the energy system, limiting warming to international climate targets implies a substantial scale-up of carbon removal technologies, including direct air capture (DAC), bioenergy with carbon capture and storage (CCS), and nature-based solutions, all of which will require robust monitoring, reporting, and verification. Although these technologies are controversial for a variety of reasons, their application at scale is an essential tool in reaching net-zero emissions in every Ambitious Climate scenario examined here.
Figure 2. World Carbon Capture, Use, and Storage Rises Sharply in Ambitious Climate Scenarios
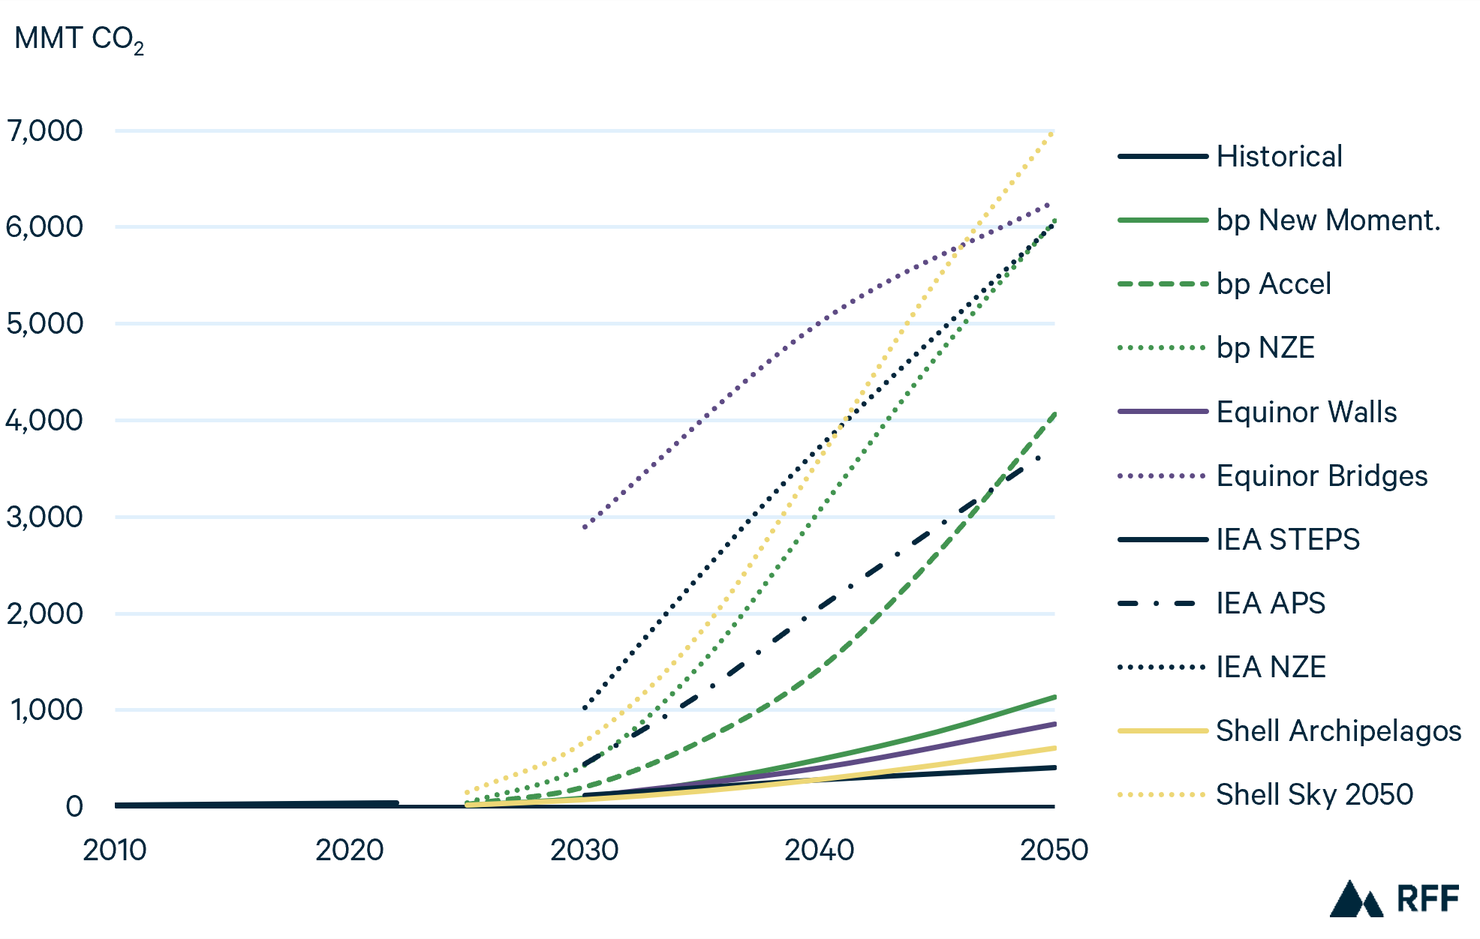
Note: Historical data from IEA. All scenarios except those from Equinor exclude nature-based solutions such as afforestation and reforestation.
In 2022, roughly 42 million metric tons of CO2 were captured by CCUS infrastructure around the world. Although this accounts for just 0.1 percent of annual global CO2 emissions, it also represents a near tripling of CCUS since 2010, a compound average annual growth rate (CAAGR) of 8.7 percent. Under Evolving Policies scenarios, comparable CAAGRs emerge through 2050, ranging from 8.2 percent (IEA STEPS) to 12.5 percent (bp New Momentum). Under Ambitious Climate scenarios, however, CCUS deployment increases by more than two orders of magnitude by 2050, growing by 14- to 16-fold, or a CAAGR of 19 to 20 percent.
Are these growth rates achievable? Technically speaking, the answer is yes. CCUS infrastructure and underground storage reservoirs are more than adequate to handle these volumes of CO2. However, the future costs of deploying these technologies, including to relatively novel sectors such as electric power generation (most CCUS today is used in the industrial sector), are not well understood.
In addition, CCUS technologies are controversial and may be unwelcome in some regions, in large part because they may not reduce, and in some cases may exacerbate, emissions of other air pollutants from point sources. They also do not reduce water pollution or other consequences of fossil fuel extraction, transportation, refining, and combustion.
As the global economy becomes more energy efficient, world primary energy demand grows slowly or declines under almost all scenarios examined here. This trend is seen most clearly in Ambitious Climate scenarios, where aggregate energy demand declines by as much as 33 percent (Equinor Bridges). Falling energy demand occurs primarily in high-income countries, with continued growth in energy consumption in many low-income nations. Some scenarios, such as the IEA’s NZE, highlight how expanding access to modern energy services in low-income regions can be consistent with declining global energy demand and achieving long-term sustainability goals.
Figure 3. World Primary Energy Demand Grows Modestly or Declines Under Most Scenarios
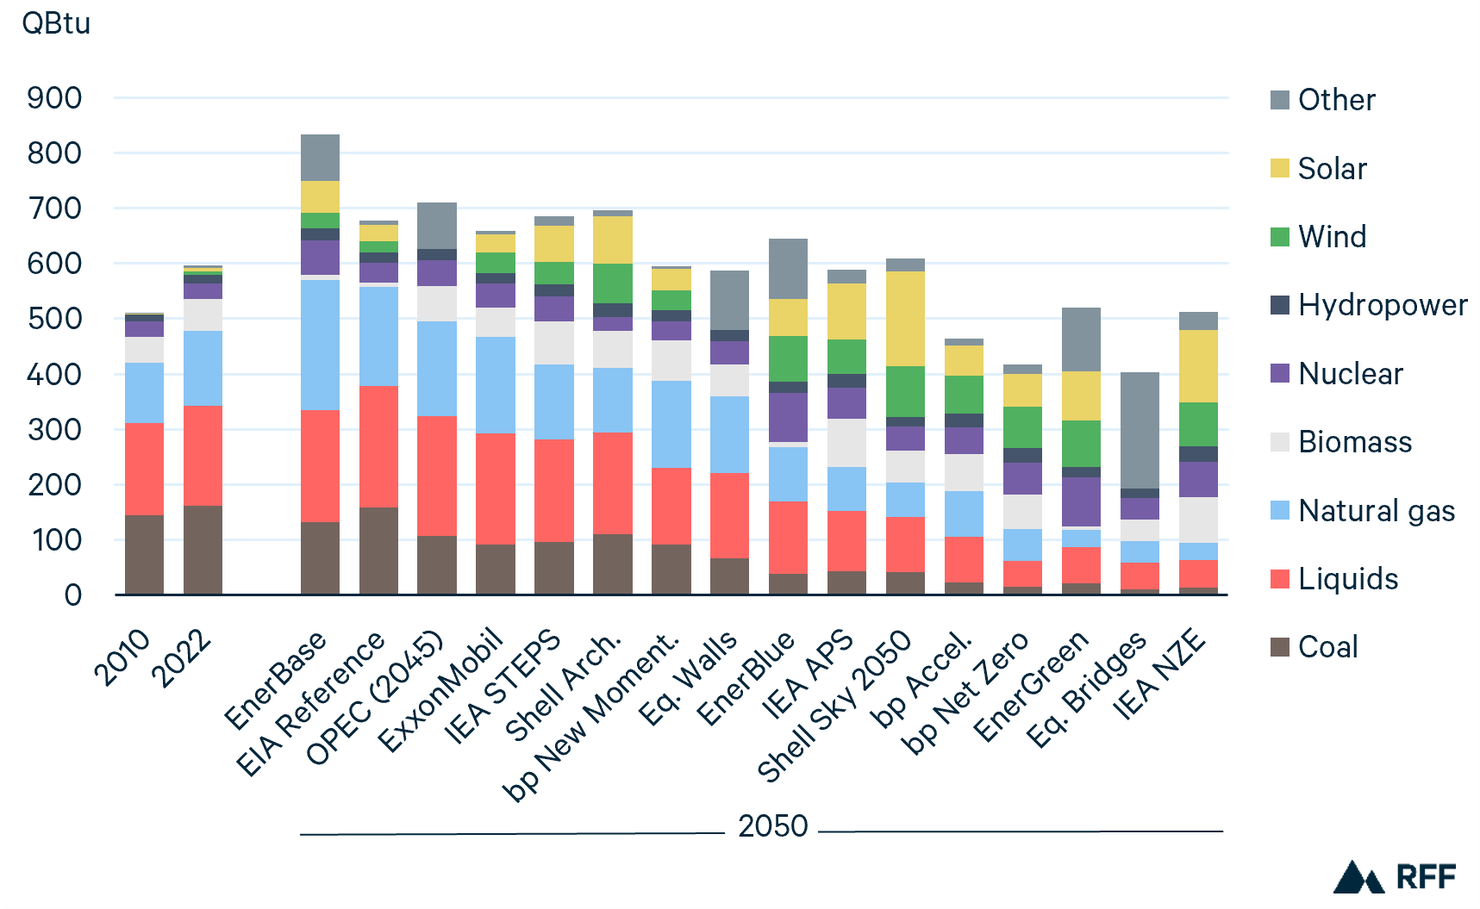
Note: Projections are ordered from highest to lowest demand for fossil fuels. Historical data from IEA. “Liquids” includes oil only for Enerdata scenarios. “Biomass” excludes biofuels, which are included in “Liquids.” OPEC projections are for 2045. “Other” includes wind and solar for Equinor and OPEC.
Coal demand declines relative to 2022 in every scenario examined here, ranging from 2 percent (EIA) to 93 percent (Equinor Bridges) lower by 2050. Similarly, oil demand is lower at the end of the projection period for all but four scenarios, where it grows slowly. Liquids demand, which incorporates biofuels, increases by 2050 in six scenarios (EIA, EnerBase, ExxonMobil, IEA STEPS, OPEC, and Shell Archipelagos). Projections for natural gas demand are more mixed, with roughly half showing growth and half showing reductions. Under all Ambitious Climate scenarios, global gas demand falls considerably, ranging from a drop of 59 percent (bp Net Zero) to 78 percent (EnerGreen and IEA NZE) relative to 2022 levels.
Wind and solar grow faster than any other sources in percentage terms under all scenarios, but with a wide range. For example, EIA projects global wind energy to roughly triple over the projection period, the most bearish scenario. Evolving Policies scenarios such as IEA STEPS show wind growing 5-fold, while solar grows more than 10-fold. Under Ambitious Climate scenarios, solar and wind together rise from 2 percent of the energy mix in 2022 to roughly one-third or more by 2050.
Over the last 40 years, the carbon intensity of the world’s primary energy mix has remained roughly flat, declining modestly from 2010 through today. In the decades ahead, carbon intensity is projected to continue this modest decline under Reference and most Evolving Policies scenarios. Achieving ambitious climate goals, however, will require an unprecedented reduction in the carbon intensity of energy.
Figure 4. Ambitious Climate Scenarios Envision Unprecedented Improvement in Carbon Intensity
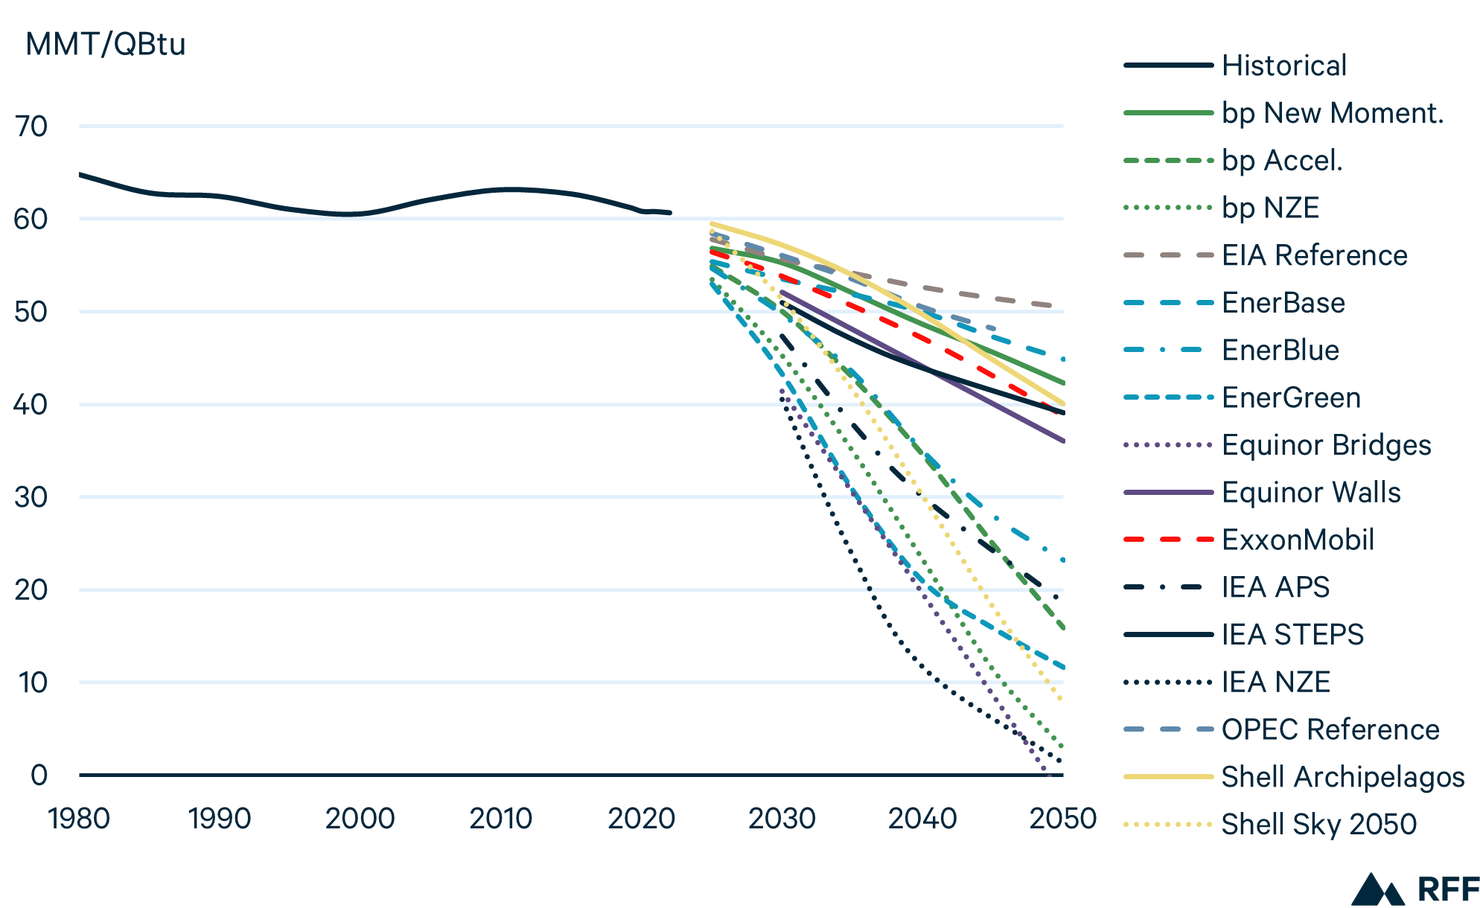
Note: Historical data from Shell. Net CO2 emissions (i.e., inclusive of negative emissions) per unit of primary energy demand are shown here.
From 2010 through 2021, global carbon intensity of primary energy fell by a CAAGR of 0.4 percent. This decline accelerates under all scenarios, ranging from a low of 0.6 percent on average annually (EIA) to a high of 12.8 percent or more on average annually from 2022 to 2050 (Equinor Bridges and IEA NZE).
Is there recent precedent for such rapid reductions in carbon intensity at a national or regional scale? Unfortunately, the answer is no. The United States, South Korea, and the UK respectively reduced their carbon intensities by an average of 1.1, 1.2, and 1.3 percent annually from 2010 through 2022. And in Sweden, carbon intensity declined by 1.9 percent on average during this period.
Other affluent nations experienced less progress, particularly due to the closure of nuclear power facilities. For example, Germany’s carbon intensity declined by only 0.2 percent on average per year from 2010 through 2022, while Japan’s increased by 0.9 percent annually on average. These figures highlight the scale of the challenge facing global policymakers and point to the importance of retaining low-carbon energy sources where they can continue operating safely.
World leaders at COP28 agreed to “tripling renewable energy capacity globally” to 11,000 gigawatts (GW) by 2030. Achieving this goal would require unprecedented growth across multiple technologies, particularly wind and solar. Three Ambitious Climate scenarios (IEA NZE, EnerGreen, and Shell Sky 2050) achieve the 2030 goal, but these scenarios are not based on existing or announced policies, highlighting the need for enhanced policy ambition if nations are to achieve their COP28 renewable energy goals.
Figure 5. Renewable Electricity Capacity Triples by 2030 Under Three Scenarios
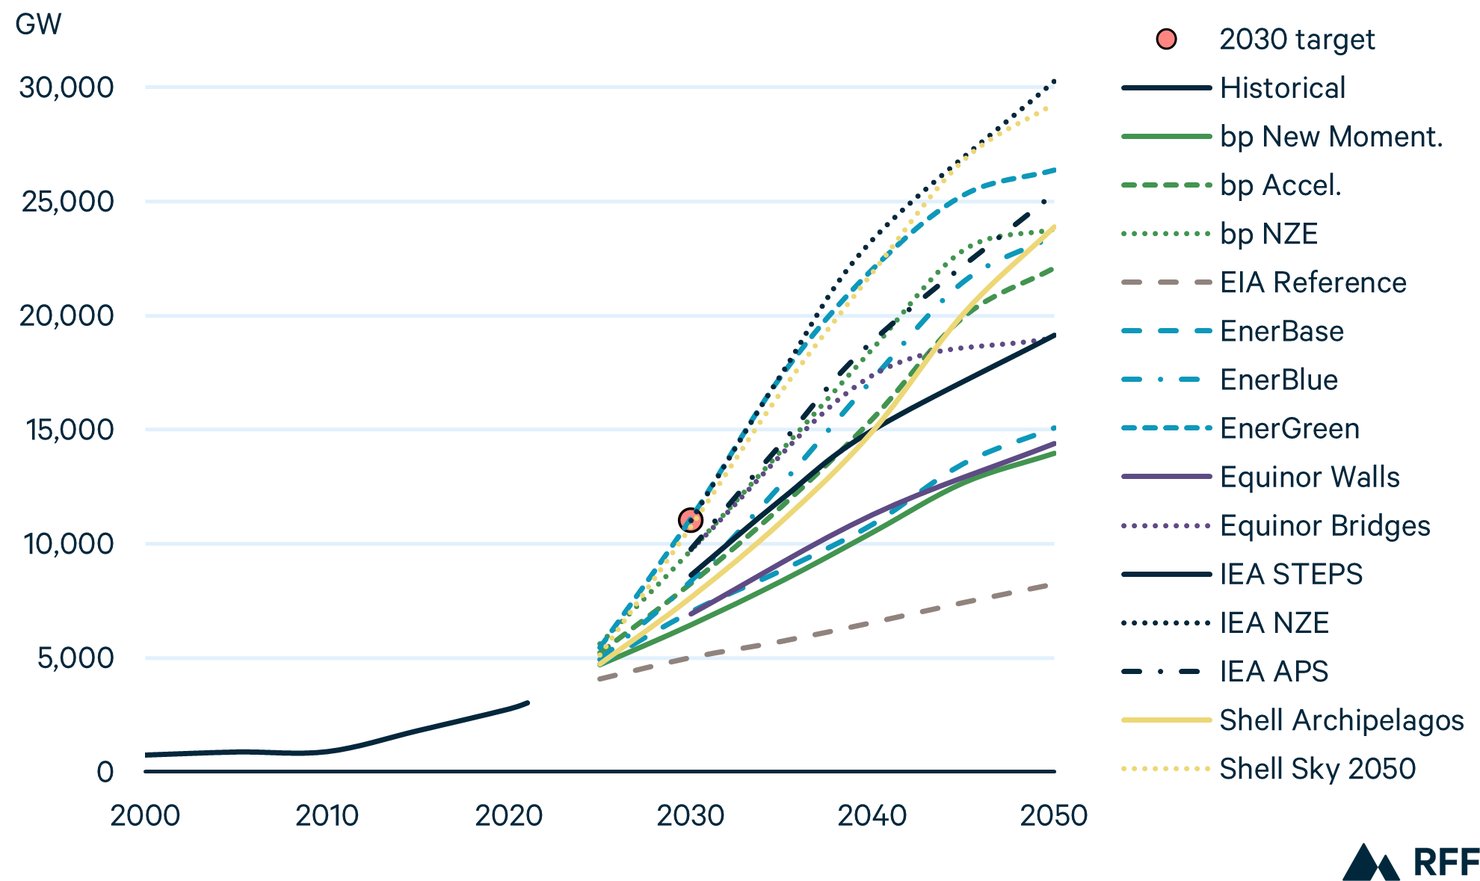
Note: Historical data from EIA. “Renewables” includes hydro, biomass, wind, solar, geothermal, and tidal energy. Projections are taken directly from EIA and IEA. Projections for other organizations are estimated based on renewable electricity generation projections from each organization, converted to capacity assuming capacity factors imputed from the IEA APS.
In 2010, renewable electricity was dominated by hydropower, which accounted for more than 75 percent of installed capacity worldwide. Over the next 10 years, renewable capacity more than doubled, growing by 125 percent, overwhelmingly led by wind and solar photovoltaic (PV), which accounted for more than 75 percent of capacity additions, followed by hydro at 18 percent.
From 2020 to 2022, solar led a further acceleration of renewables growth, which increased at an annual rate of more than 10 percent, or 320 GW per year. To reach 11,000 GW of renewable capacity by 2030, annual capacity additions would need to average roughly 800 GW per year from 2022. For perspective, in 2022, global wind capacity was 832 GW and solar was 892 GW, highlighting the unprecedented rate of growth needed to achieve the renewable energy goal agreed upon at COP28.
At COP28, 22 nations committed to tripling their nuclear energy capacity by 2050. Achieving this goal would require a fundamental change in the trajectory of nuclear energy for developed nations, as 12 of the 22 experienced declining nuclear energy production from 2012 through 2022, while 5 currently produce no nuclear power. In recent years, nuclear energy growth has been led by China and India. Although neither of these countries was part of the announcement at COP28, they were the top two nations for nuclear power plant construction as of December 2023. Globally, nuclear capacity is projected to grow modestly under most scenarios, and 2022 levels triple by 2050 in just two scenarios, both from Enerdata.
Figure 6. World Nuclear Power Capacity Triples by 2050 Under Just Two Scenarios
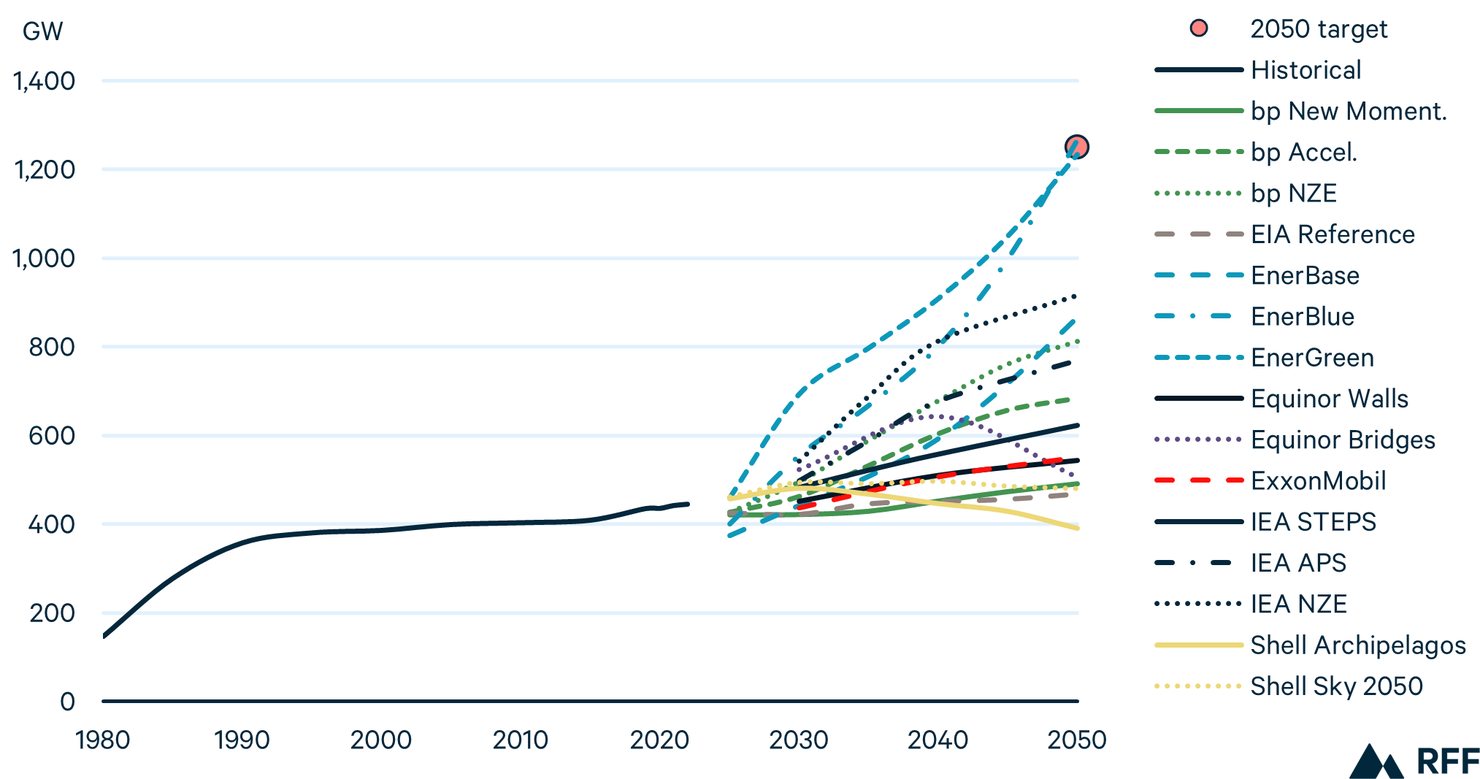
Note: Historical data from Shell. Capacity data are taken from original in EIA, IEA, and Shell and estimated based on nuclear electricity generation from bp, Enerdata, Equinor, and ExxonMobil, assuming plants operated at the average global capacity factor in 2020–22.
Projections for the growth of nuclear capacity span roughly 800 GW, nearly twice the installed capacity in 2022. Even across scenarios with similar CO2 emissions trajectories, projections vary widely. For example, Ambitious Climate scenarios show capacity growing by as little as 21 percent (Equinor Bridges) to tripling (EnerGreen) by 2050. Several Ambitious Climate scenarios, including those from IEA and Equinor, show rapid nuclear growth through 2040, followed by slower growth or declines in the following 10 years.
Similarly wide ranges emerge in Evolving Policies and Reference scenarios. This uncertainty over nuclear reflects a variety of factors. Unlike wind, solar, and battery storage, which will be key to achieving Ambitious Climate targets and whose costs have fallen consistently over the last few decades, the costs and timelines for nuclear projects in the developed world have often missed their targets—sometimes by wide margins.
To even approach the goal of tripling nuclear capacity, more than half of the 22 nations that committed to doing so will need to reverse current trends and rapidly deploy new nuclear power. From 2022 to 2050, a global tripling would require CAAGR of 4 percent. From 1980 to 1990, the world added nuclear at a CAAGR of 9.4 percent, falling to a CAAGR of just 0.8 percent the following decade. From 2010 to 2022, nuclear energy capacity grew by just 0.3 percent annually.
Global electricity demand is projected to grow substantially under all scenarios. At the same time, the share of electricity generated by fossil fuels declines across scenarios, from 58 percent in 2022 to 42 percent or lower by 2050. Renewables, especially wind and solar, account for roughly half or more of global power generation by 2050, exceeding 80 percent of the mix under Ambitious Climate scenarios.
Figure 7. World Electricity Demand Grows Rapidly, Led by Wind and Solar
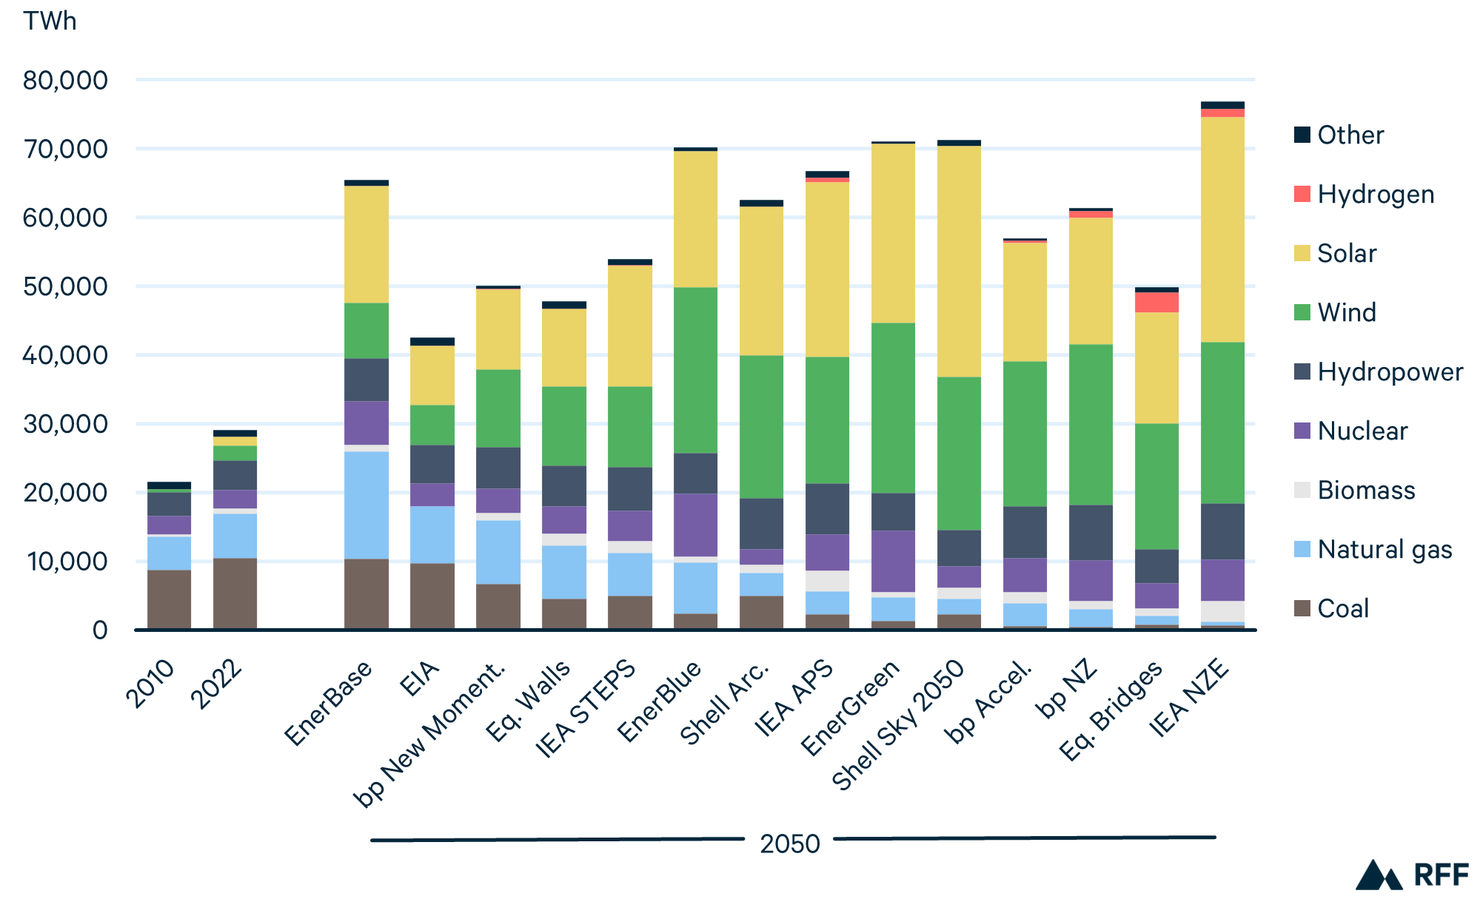
Note: 2050 scenarios ordered from highest to lowest total levels of fossil fuel generation.
This growth enables electricity to become a larger provider of energy services across the economy, particularly in the buildings and transportation sectors. In 2019, electricity accounted for roughly 20 percent of final energy consumption. By 2050, this share increases substantially under most scenarios. For example, bp and IEA’s Evolving Policies scenarios see electricity growing to roughly 30 percent of final consumption by 2050 and exceeding 50 percent under each organization’s Net Zero scenario.
However, there is wide variation, suggesting that the decarbonization of the global power grid is not inevitable. Coal declines under all scenarios, but this decline ranges from 1 percent (EnerBase) to 96 percent (bp NZ) relative to 2022. Natural gas demand in the power sector grows or remains roughly flat across most Evolving Policies and Reference scenarios but falls by half or more under all Ambitious Climate scenarios.
Wind and solar grow rapidly under all scenarios. In 2010, these two sources accounted for just 2 percent of global electricity generation. By 2050, they account for more than half of the power mix under 10 of the 14 scenarios examined here, including Evolving Policies scenarios such as IEA STEPS.
Global natural gas demand has grown by two-thirds since 2000, driven primarily by the United States, Asia, and the Middle East. Unlike coal and oil, which peak under most scenarios examined here, natural gas demand increases under roughly half of the scenarios. This divergence highlights the complex role that natural gas plays in the global energy system and highlights its potential to both mitigate and exacerbate greenhouse gas emissions from the energy system.
Figure 8. Projections for World Natural Gas Demand Vary Widely Across Scenarios
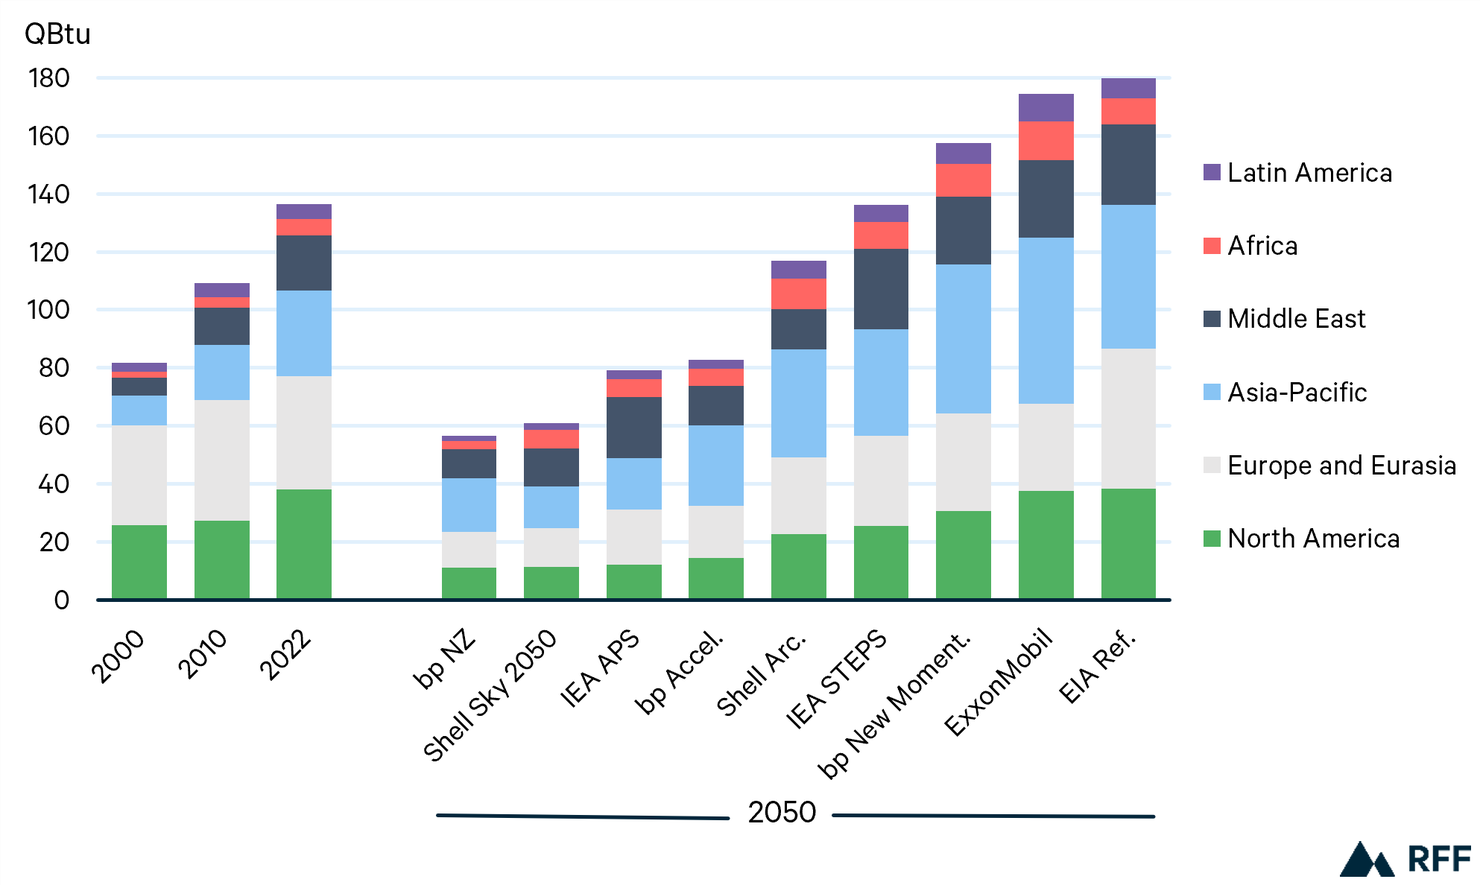
Note: Historical data from bp (2000) and IEA (2010, 2022). All scenarios except ExxonMobil exclude flared natural gas.
The future of global natural gas demand is highly uncertain and, like the future of most fuels and energy technologies, is highly dependent on public policies. Under Reference scenarios, global gas demand growth is robust, increasing by roughly 30 percent under ExxonMobil and EIA. In these scenarios, demand growth is led by the Asia-Pacific region, followed by the Middle East. However, demand declines in developed economies such as Europe and the United States under all scenarios other than EIA’s Reference.
Under Evolving Policies scenarios, considerable variation emerges across regions, in many cases highlighting the gaps between existing policies and the levels needed to achieve emissions reductions under NDCs. For example, gas demand in Asia-Pacific and Latin America grows by 24 and 14 percent respectively under IEA STEPS but falls by 40 and 36 percent under IEA’s APS. Similar gaps emerge for all other regional groupings shown in Figure 8.
Under most Ambitious Climate scenarios, gas demand declines across all regions by 2050 except Africa, where lack of access to affordable modern energy sources affects hundreds of millions of people. Under Net Zero scenarios from bp and Shell, natural gas demand falls by roughly 70 percent in North America and Europe-Eurasia and by at least one-third in Asia-Pacific, Latin America, and the Middle East.
From 2000 through 2010, China’s economy expanded extraordinarily, powered primarily by coal. Ten years ago, central projections from the EIA and IEA envisioned that expansion continuing, plateauing in the 2020s (for the IEA) or 2030s (for EIA). The projections in the 2023 outlooks, however, show considerable decline in projected Chinese coal demand due to a declining population, stagnating economy, and increasing availability of cleaner and cheaper alternatives.
Figure 9. China’s Projected Coal Demand Has Declined Dramatically Over the Last 10 Years
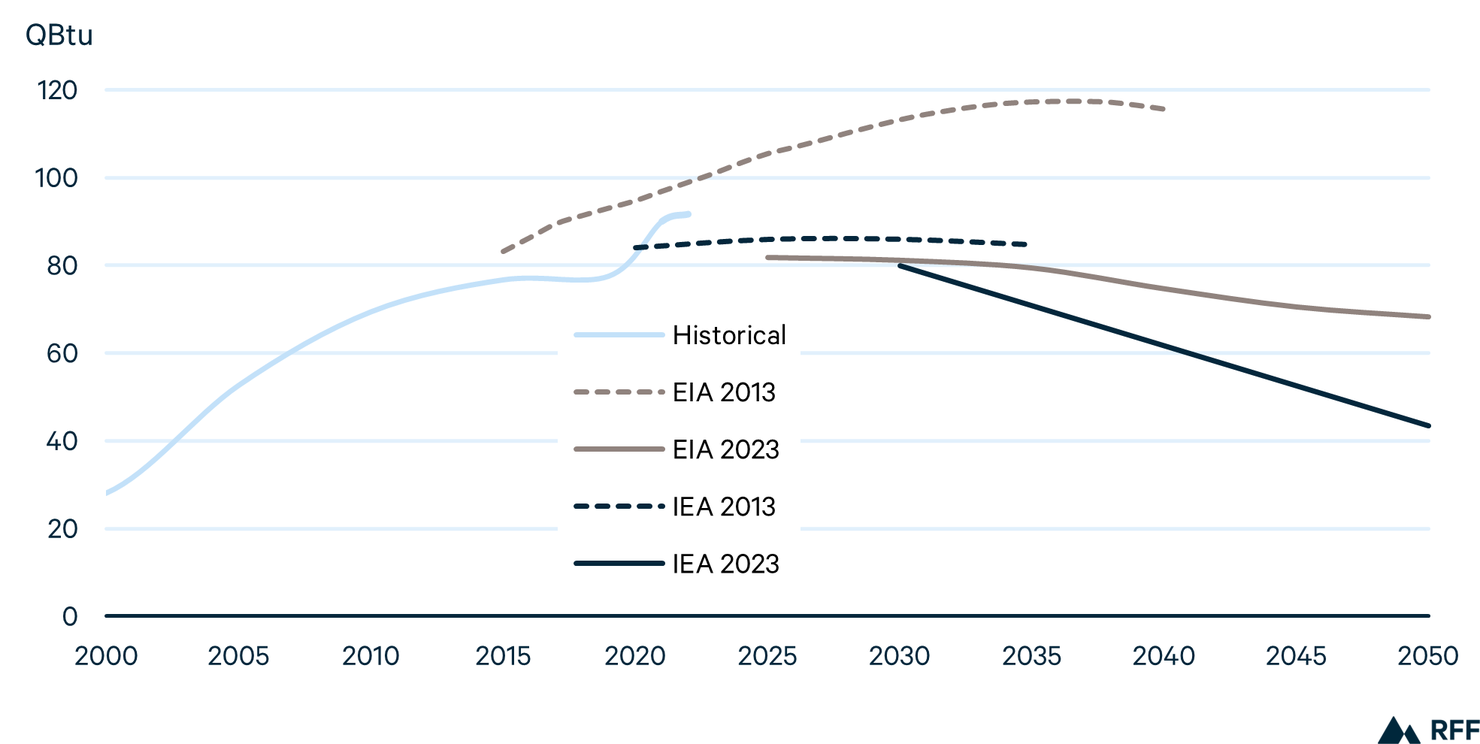
Note: IEA 2013 shows the New Policies scenario, which used assumptions similar to those in IEA’s more recent STEPS series. EIA shows the Reference scenario for both 2013 and 2023. Historical data from the 2023 Statistical Review of World Energy.
In the first two decades of the 21st century, China’s demand for coal more than tripled, making it the world’s largest energy consumer and emitter of CO2. In recent years, however, China has reduced its reliance on coal in the residential sector and implemented new policies to constrain emissions growth and boost alternatives such as hydro, nuclear, wind, and solar.
Looking forward, all scenarios examined in this year’s Global Energy Outlook project that coal will decline substantially in China. This decline is driven in part by policy, including China’s cap-and-trade program and robust government support of hydro, nuclear, wind, and solar. But it is also due to a slowing economy and a population that is projected to begin declining, falling from 1.4 billion today to 1.3 billion by 2030 under the UN’s median variant projection.21 The International Monetary Fund (IMF) projected that China’s economy will continue growing in 2024, but considerably more slowly than in most recent years, in large part due deep weakness in its real estate sector.
The EIA’s 2023 projection for Chinese coal demand is 35 percent lower in 2040 than 10 years prior. By 2050, the IEA projects that demand will fall by more than half relative to 2022, reaching 43 QBtu, a level last seen in the early 2000s. Although these projected declines will help reduce CO2 emissions, they are well above the levels needed to achieve international climate targets. We explore these topics in more depth in Section 3.1.
The physical inputs that power buildings, transportation, and industry are shifting. For most of human history, primary energy has been provided by a mix of solid, liquid, and gaseous fuels. But in a future where energy technologies such as wind, solar, and battery storage play a larger role in providing energy services, critical minerals will become central to powering the global economy. Demand for some of these minerals, which today are used in modest quantities, is projected to grow by orders of magnitude in the decades ahead, raising new questions about supply costs, geopolitics, and environmental impacts.
Figure 10. Demand for Some Critical Minerals Grows by Orders of Magnitude (2022=1, log scale)
Note: Projections from IEA
Throughout the fossil fuel era, fears of resource scarcity—particularly for oil—have worried analysts and policymakers alike. Although fossil fuels have exhibited considerable price volatility, concerns over physical scarcity have repeatedly been mollified by technological innovation, enhanced efficiency, and the discovery of new supplies. It is unclear whether, and to what extent, critical minerals will follow a similar path (although some major market players have voiced concerns about supply shortfalls by 2030).
As we discuss in detail in Section 3.3, most of the outlooks analyzed here acknowledge the importance of critical minerals and uncertainties over their future, but few provide detailed demand projections, and none provide an in-depth analysis of supply and cost. These omissions highlight the relatively recent emergence of critical minerals as a top priority for policymakers and the energy industry and demonstrate the need for new data collection, analysis, and modeling of this topic to better inform decisionmakers in the decades ahead. This includes not only information about supply and demand but also careful considerations of the environmental, social, and geopolitical consequences of increased reliance on certain minerals.
3. In Focus
3.1. China’s Evolving Energy Future against a Foreboding Economic Outlook
China has seen immense economic growth over the past few decades. Since 2010, the country has accounted for roughly 33 percent of the global growth in GDP and almost 60 percent of the growth in primary energy demand. However, because this growth has been powered primarily by coal, China accounted for over 80 percent of the global increase in CO2 emissions since 2010.8
In recent years, China’s leaders have sought to manage the unabated development of energy-intensive and high-emissions projects, mainly because of concerns over air quality and climate change. In 2020, China’s NDC committed to “aim to have CO2 emissions peak before 2030 and achieve carbon neutrality before 2060.” Following this pledge, China issued a national implementation plan for all ministries and provincial governments that outlines 43 tasks for sectors including energy and industry.
In the energy sector, China has committed to boosting energy efficiency, renewables, and nuclear while pursuing a reduction in fossil fuel consumption. For industry, the Ministry of Industry and Information Technology has outlined a roadmap to control emissions in steel, petrochemicals, metals, and concrete—the most emissions-intensive industries—in the 14th Five-Year Plan (FYP). Additionally, the plan outlined the use of cleaner energy sources in these industries, such as hydrogen and biofuels. FYPs provide strong indications of future directions, as historically, China has exceeded its climate objectives under the plans.27 Recent analysis suggests that the 14th FYP will put China on track to meet its goal of peaking emissions by 2030, although additional policies will be needed to meet carbon neutrality targets for 2060.
Macroeconomic factors, particularly an aging population and an unfolding property crisis, will have major implications for the future of energy and emissions in China. Although total population began declining in 2022, the working-age population (ages 15–59) peaked in 2011, slowing GDP growth relative to recent history.21 The working-age population is expected to decline 30 percent from its peak by 2050 (Figure 11).
Figure 11. Projected Gross Domestic Product and Working-Age Population in China
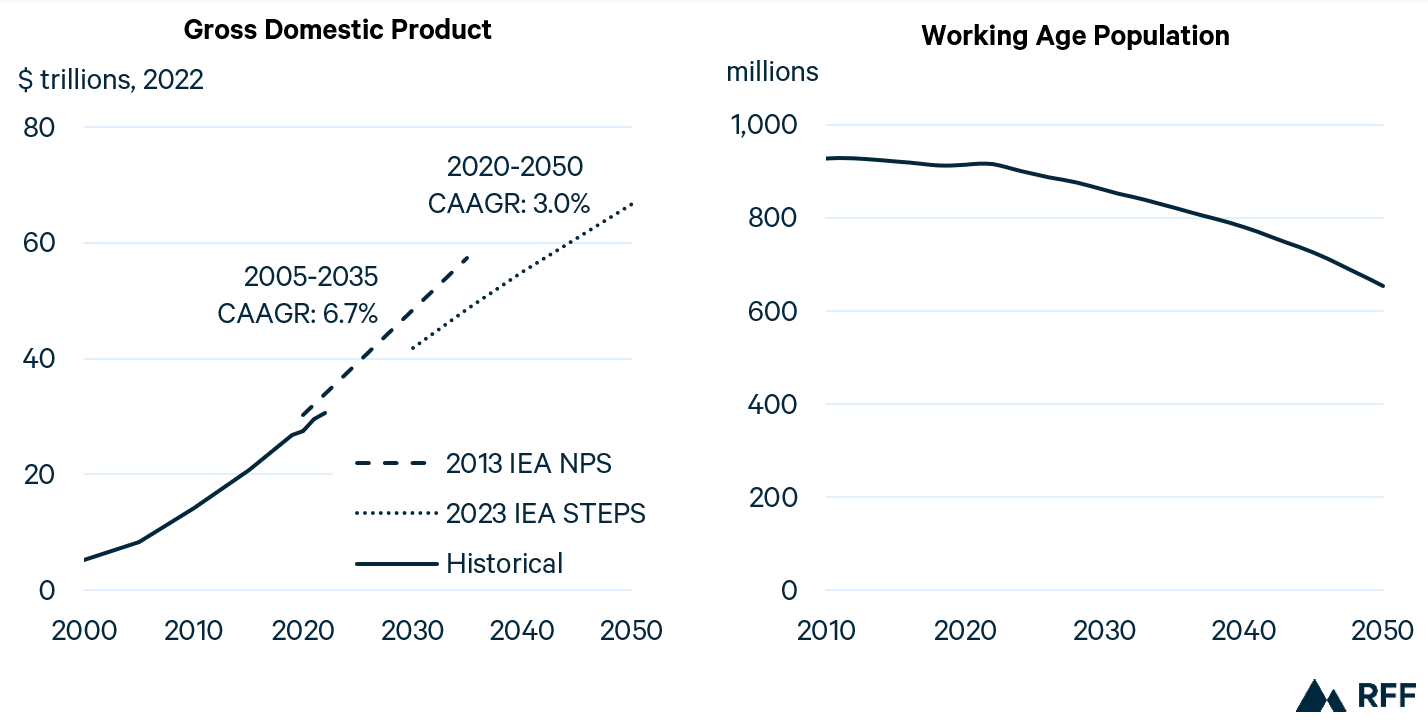
Source: Population projections from UN World Population Prospects 2022 (median variant).
Note: GDP data in purchasing power parities (PPP) terms.
Compounding these demographic trends is a financial crisis that is deeply affecting property developers. For the past few decades, the real estate market grew rapidly, viewed as a safe investment and the “main store of wealth for many Chinese families.” In 2020, the government, concerned about a potential housing bubble, instituted rules to curb excessive borrowing by developers. With reduced access to capital, China Evergrande, the second-largest property developer in the country, defaulted on payments in 2021; this cascaded into reduced confidence in the sector and a prolonged decline in new home sales. Since Evergrande’s default, over 50 property firms have defaulted on debt, further reducing investor confidence and deterring new investment.
Although the effects on demand for energy and building materials have been limited to date, the crisis may result in lower demand in the long term. At the same time, this crisis is indicative of a broader economic transition in the country as policymakers reportedly work to steer the economy away from real estate, which accounts for a quarter of China’s economy, and toward manufacturing sectors such as electric vehicles and semiconductors. The growth of these high-tech sectors, as well as continued rapid electrification, may continue to drive demand for energy—particularly electricity—even in the face of the property crisis.
Figure 12 compares the IEA’s and EIA’s 2023 projections for the consumption of coal, oil, natural gas, and renewable energy with those from 2019 and 2013.
Although China remains by far the world’s largest consumer of coal, 2023 outlooks project a coal peak followed by a decline, whereas 2013 and 2019 projections envisioned peaks (in some cases, much higher peaks) followed by extended plateaus. This is driven primarily by a shift away from coal in the power sector and improved efficiencies in industrial processes such as iron- and steelmaking.
Figure 12. Primary Energy Consumption in China
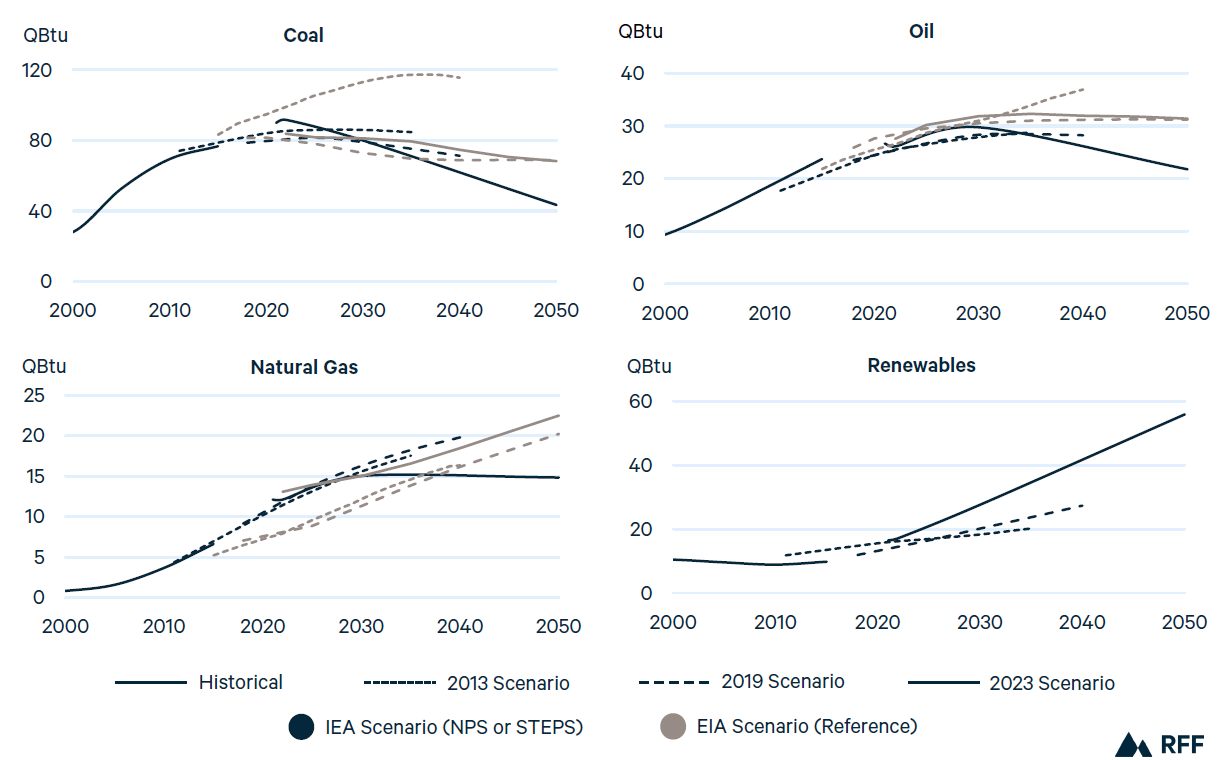
Note: EIA projections do not include nonmarketed biomass and are excluded from the “Renewables” figure.
In the power sector, IEA projects that while total coal-fired capacity will grow to 2030, capacity factors will decline substantially. IEA assumes that coal will gradually transition to providing grid flexibility, rather than delivering base load power, as new sources such as wind and solar come online. In the industrial sector, both outlooks project that iron and steel production will gradually reduce coal use as scrap metal becomes more available for secondary production, which is typically less energy intensive and can use electric arc furnaces (rather than coal-fired blast furnaces) for process heating.
China’s oil and gas demand has grown steadily over the past few decades. However, key policy initiatives have contributed to downward revisions of projections in the 2023 IEA scenario. The 14th FYP lays out key goals that will reduce natural gas demand in the buildings sector, such as retrofitting 350 million square meters of existing buildings through improvements such as building envelope insulation and electrification, along with greater energy efficiency in new construction. Additionally, an increased share of renewable generation on the grid, as well as a target to add 50 GW of renewable energy capacity through building-integrated and building-added PV, will dampen demand for natural gas. In the transportation sector, the New Energy Vehicle Industrial Development Plan targets a 20 percent share of new vehicle shares comprised of for “new energy vehicles” (battery electric vehicles, plug-in hybrid electric vehicles, and fuel cell vehicles) by 2025, which will reduce demand for petroleum products.
The upward revision for renewables demand in IEA’s 2023 scenario has been driven by solar PV and wind. While the 14th FYP outlines a goal of 1,200 GW of installed solar and wind capacity by 2030, China more than doubles that goal by 2030 in the IEA STEPS scenario.8 In fact, some project that China may reach its stated goal by 2025, driven by subsidies and an array of other policies.
Figure 13 shows the overall shift in projected 2030 primary energy demand from IEA and EIA scenarios from 2013 and 2023. Renewables have increased substantially, and fossil fuel demand (particularly coal) has declined, resulting in a peak in CO2 emissions by 2030. However, the majority of primary energy demand in the country is still served by fossil fuels. In both the EIA’s and IEA’s 2023 scenarios, roughly 80 percent of primary energy demand is served by fossil fuels in 2030, highlighting the gap between the policies implemented by the 14th FYP to peak CO2 emissions by 2030 and the longer-term goal of net zero by 2060.
Figure 13. China’s Primary Energy Demand Projections from 2013 to 2023
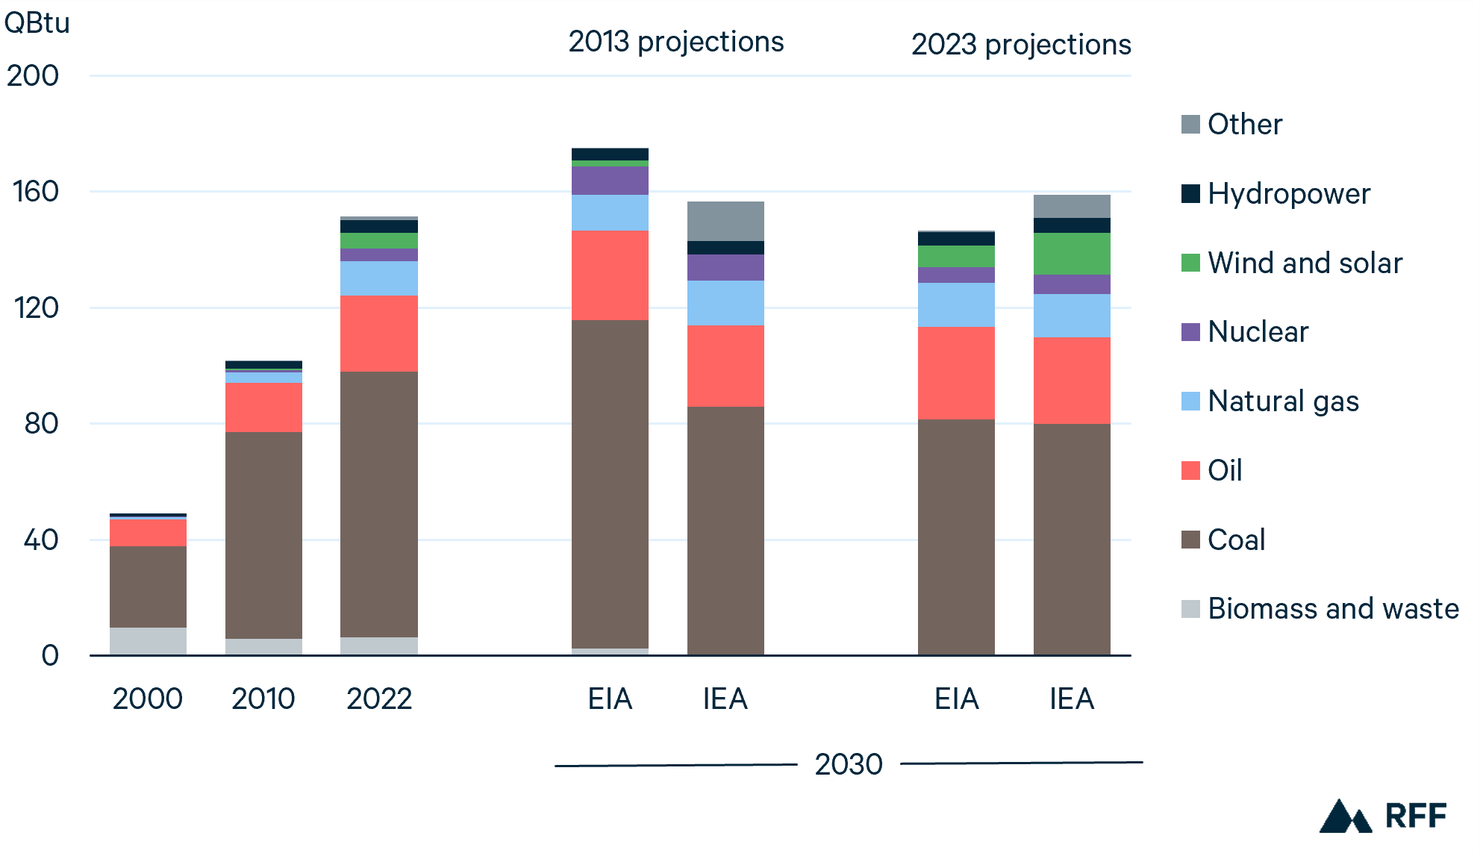
Note: IEA scenarios in this figure are the 2013 New Policy Scenario (NPS) and the 2023 STEPS.
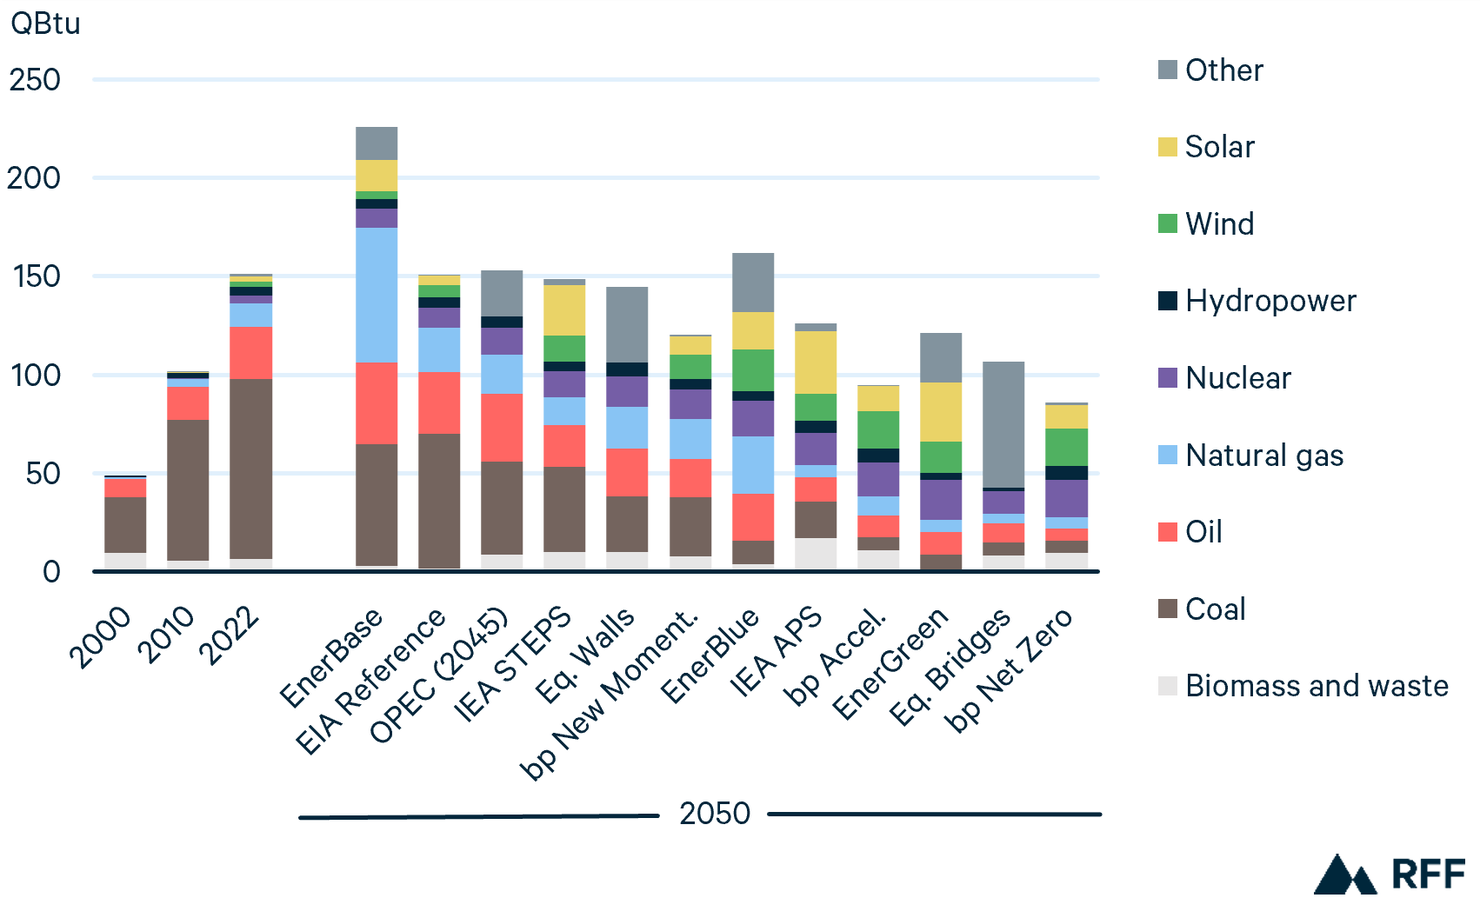
Figure 14 further illustrates the differences in projected energy demand between China’s current policies, its announced NDC, and net-zero scenarios. Across all scenarios, coal demand is expected to decline by 2050, falling by 25 percent (EIA Reference) to 93 percent (Equinor Bridges and bp Net Zero) relative to 2022. Oil demand is also expected to decline in most scenarios, except EnerBase, EIA Reference, and OPEC. Projected natural gas demand varies more widely, growing in most Reference and Evolving Policies scenarios, but declining with Ambitious Climate scenarios. Renewables, led by wind and solar, grow substantially under all scenarios but most rapidly under the Ambitious Climate scenarios, where they exceed fossil fuels by 2050.
Figure 14. Primary Energy Demand in China
3.2. Emerging Technologies for Achieving Net Zero
In recent years, public and private sector actors have increasingly pledged to reach net-zero carbon emissions by midcentury. But there is considerable uncertainty and debate over the role of fossil fuels in the net-zero energy transition. For example, a heated debate took place at COP28 over whether nations should plan to phase out or simply phase down fossil fuels, as well as whether to include the pivotal qualifier “unabated,” which would leave room for continued use of fossil fuels paired with CCUS.
In this section, we examine three technologies that could, perhaps controversially, play a role in continuing the use of fossil fuels in the energy system: hydrogen, CCUS, and direct air capture (DAC).
3.2.1. Hydrogen
Depending on how it is produced, rapid growth in global hydrogen demand could extend the life of fossil fuels considerably. The oil and gas industry is experienced in producing hydrogen through steam methane reforming—the primary means of global production—and handling it in pipelines and industrial processes. Today little hydrogen is consumed directly to provide energy services; rather, it is generally used as a feedstock in the production of ammonia, which is used to make fertilizer, and, to a lesser extent, as part of the process of refining crude oil. But new low- or zero-carbon hydrogen is increasingly seen as an option to decarbonize otherwise hard-to-abate industries that have historically relied on fossil fuels for energy (e.g., long-distance shipping and aviation) and high-temperature heat (e.g., cement manufacturing and steelmaking).
In the United States, the Inflation Reduction Act includes a tax credit of up to $3 per kilogram for “clean” hydrogen. Largely as a result of the generosity of the credit, the definition of clean hydrogen has been subject to much debate and lobbying.35 There is also some overlap with CCUS, as “blue” hydrogen, produced using natural gas with CCUS, can earn a CCUS tax credit of $85 per ton of CO2 (although the law forbids blue hydrogen to “double dip”—that is, to claim both the CCUS and hydrogen tax credits). While controversy and debate swirls around these tax credits, they appear to be spurring substantial investment: more than $1 billion of hydrogen investment in the United States in 2023.36
In 2022, world hydrogen use for non-energy-related purposes amounted to about 95 million tons per annum (mtpa), or 11 QBtu worth of energy equivalent. Under some scenarios, by 2050, hydrogen used in the energy sector could rival today’s global 95 mtpa total (Figure 15). However, this would still account for a fairly small share of global final energy consumption. For example, IEA’s APS reaches 91 mtpa (10 QBtu of energy equivalent) of hydrogen energy demand by 2050, representing just 2.5 percent of global final energy consumption. The most rapid growth occurs in Shell’s Sky 2050 scenario, where hydrogen provides 7 percent of global final energy consumption by 2050. In developed nations such as the United States, growth may be more rapid. By 2050, hydrogen accounts for more than 10 percent of US final energy demand under the APS (US-specific data for Shell Sky 2050 and IEA NZE are not available).
Figure 15. Global Hydrogen Consumption for Energy
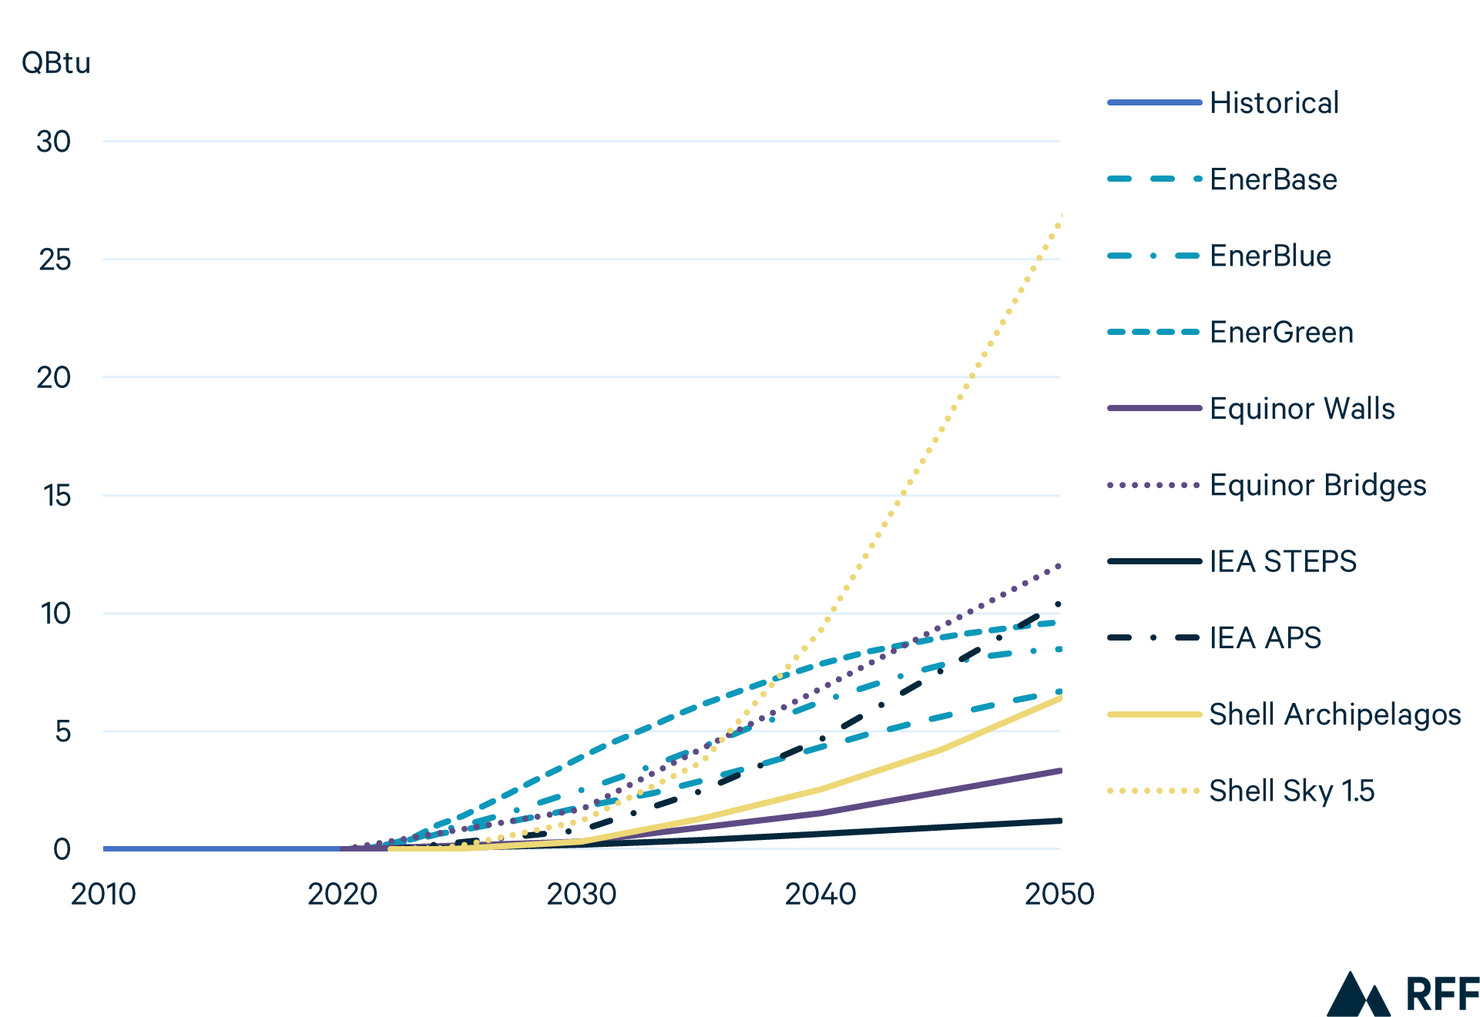
Note: Equinor projections include only hydrogen used in transportation, so those projections represent lower bounds.
3.2.2. Carbon Capture, Use, and Storage (CCUS) and Direct Air Capture (DAC)
As discussed in Section 2, CCUS is projected to grow considerably in many scenarios (see Figure 2), with some Ambitious Climate scenarios showing growth of two orders of magnitude, rising from 42 MMT CO2 in 2022 to 4,000–7,000 MMT CO2 by 2050 (for context, global energy-related CO2 emissions in 2022 were roughly 37,000 MMT).
DAC is a particular form of CCUS. Instead of capturing CO2 from a concentrated stream of waste gases, as most CCUS applications do, DAC would capture CO2 from ambient air, sequestering it underground or in some product or application. Because of this, DAC facilities would provide a form of carbon removal (assuming their large energy needs are met by nonemitting energy sources) and help offset emissions from elsewhere in the economy. As of 2023, 27 DAC facilities were in operation, with more than 100 additional facilities in the development process.
In the United States, DAC developers are eligible to receive a tax credit of $180 per metric ton of CO2 captured and permanently stored and $130 per metric ton of CO2 used in enhanced oil recovery (EOR). This second application of DAC is particularly controversial because the oil extracted using the captured CO2 would create emissions that could reduce or eliminate the climate benefits of permanent CO2 sequestration. On the other hand, it is at least technically possible for the volumes of CO2 stored using EOR to meet or exceed the emissions embodied in the oil produced; in other words, EOR could theoretically be used to produce “carbon neutral” or even “carbon negative” oil.
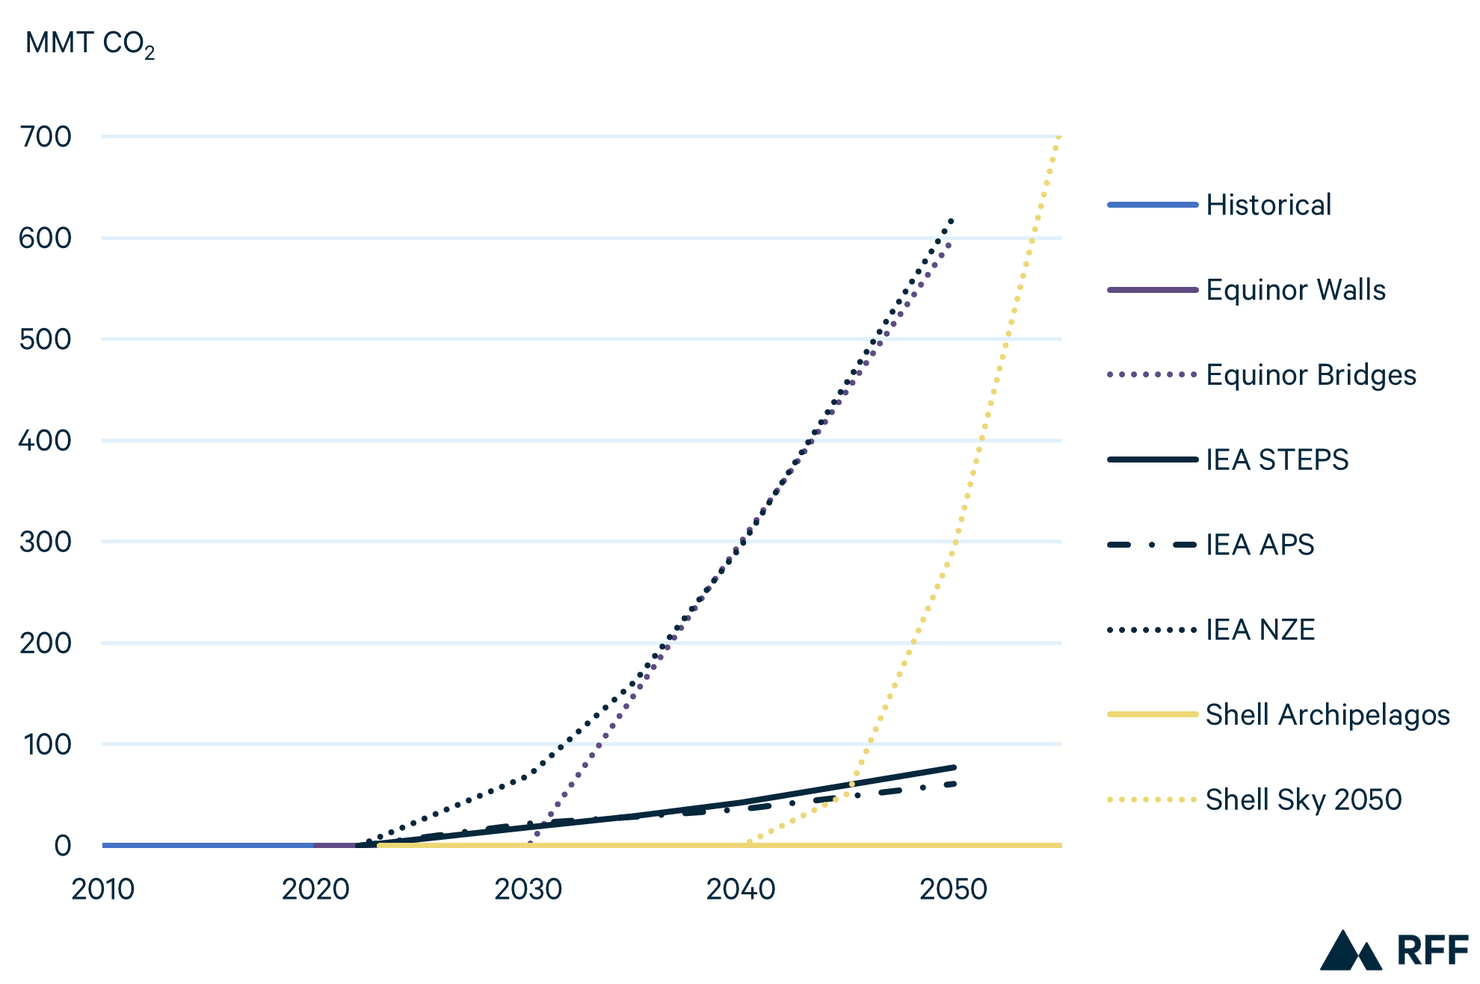
Figure 16 shows projections for global DAC growing from effectively zero today to as high as 600–700 MMT CO2 annually by 2050–55 in Ambitious Climate scenarios, representing about 1.5 to 2 percent of today’s global emissions. This remains only about one-tenth of the projected deployment of CCUS in the same scenarios by the same modeling teams (6,000–7,000 MMT CO2; see Figure 2). While this suggests a more modest role for DAC than for other forms of CCUS, at least one scenario is more bullish in the decades ahead: Shell’s Sky 2050 scenario does not include large-scale DAC until 2045, but it eventually reaches over 5,000 MMT CO2 annually in 2100, which is about half of total CCUS projected for that year.
Figure 16. Global Direct Air Capture
3.2.3. Back to the Future (of the Past)
Finally, we compare projections for all three technologies—CCUS, DAC, and hydrogen—in this year’s outlooks with those from 2022. Where comparable data are available (Equinor and IEA), projections suggest that a combination of policy incentives and technological advances are generally driving projections for these technologies higher.
Both organizations generally increased their CCUS projections. Under IEA APS, CCUS deployment in 2050 was 15 percent higher in 2050 relative to 2022’s projection (STEPS and NZE were roughly unchanged), and Equinor raised its 2050 projection by 4 and 33 percent under Bridges and Walls, respectively. Projections for DAC in 2050 increased by roughly 30 and 60 percent under IEA’s STEPS and NZE scenarios, respectively, while remaining roughly unchanged under IEA APS and both Equinor scenarios. For hydrogen, IEA increased its 2050 projections by 3 percent under STEPS and 15 percent under APS (however, it was not included in the 2022 IEA NZE scenario, which prevents a comparison with this year’s projection), whereas Equinor saw a 3 percent decrease in Bridges and 26 percent growth in Walls.
Taken together, these projections suggest increasing confidence that CCUS, DAC, and hydrogen will play a meaningful role in managing greenhouse gas emissions in the future. However, much uncertainty remains over the durability of policy, technological innovation, and private sector appetite for these emerging technologies. In addition, public opposition to the deployment of these technologies, particularly if they are seen as providing license to continue the extraction and use of fossil fuels, could create additional headwinds.
3.3. A New Era of Mining
Building a clean energy future requires new material inputs into an economy that has been powered primarily by solid, liquid, and gaseous fuels for more than a century. Although not all outlooks project future demand for minerals, a growing number of organizations are recognizing the importance of, and uncertainty surrounding, these materials. Three of the 2023 outlooks (bp, IEA, and Shell) provide projections on future demand for cobalt, copper, lithium, and nickel, which are used for a variety of applications in clean energy and other sectors.
All the projections included in these outlooks focus exclusively on demand for, rather than supply of, these minerals, and the methodologies for producing them are generally opaque. In future years, a more robust accounting of underlying assumptions regarding future demand and supply would enable deeper analysis. For example, the construction of demand curves across technologies and over time requires organizations to make crucial assumptions about future efficiency improvements, technological innovation, potential substitutes, and more. In addition, the outlooks do not provide detailed projections of, and in some cases do not model, how future supply will arise and at what cost. (For example, the IEA states in its 2023 outlook, “We do not yet model full long-term supply-demand balances for critical minerals.”) Indeed, recent years have seen substantial volatility in prices for several critical minerals, and much uncertainty remains about future demand and supply balance.
Throughout the fossil fuel era, fears of resource scarcity—particularly for oil—have worried analysts and policymakers alike. Although fossil fuels have exhibited considerable price volatility, concerns over physical scarcity have repeatedly been alleviated by technological innovation, enhanced efficiency, and the discovery of new supplies. It is unclear whether, and to what extent, critical minerals will follow a similar path (although some major market players have voiced concerns about supply shortfalls by 2030). Nonetheless, we have no reason to doubt that innovation, efficiency improvements, and the discovery of new resources will expand the resource base in the years ahead. And unlike fossil fuels, clean energy minerals have the potential to be recycled, which could further ease concerns over resource scarcity.
The IEA seeks to address some of the uncertainties around supply and demand through additional scenario analysis. For example, it models several cases including with constrained nickel supply, a more rapid deployment of solid-state batteries, and smaller battery sizes, and other scenarios. This type of scenario analysis can help lay the groundwork for more detailed future work, including a more robust picture of supply chains and cost curves.
Regardless of issues related to resource constraints, a growing trade of clean energy materials will raise important new questions. For example, how will local environments and human health be affected by increased mining activities? How might such activities affect local communities and economies? And how will new trade flows and concentration of supplies affect geopolitics? Scholars and policy practitioners have begun to probe these questions, but much future work will be needed to assess the scale of impacts and design new policies to address challenges as they arise.
In Sections 3.3.1–3.3.5, we examine the history of and projections for four materials that are likely to be foundational to a clean energy transition—cobalt, copper, lithium, and nickel—as well as several lesser-known minerals for which demand is projected to grow by orders of magnitude in the years ahead.
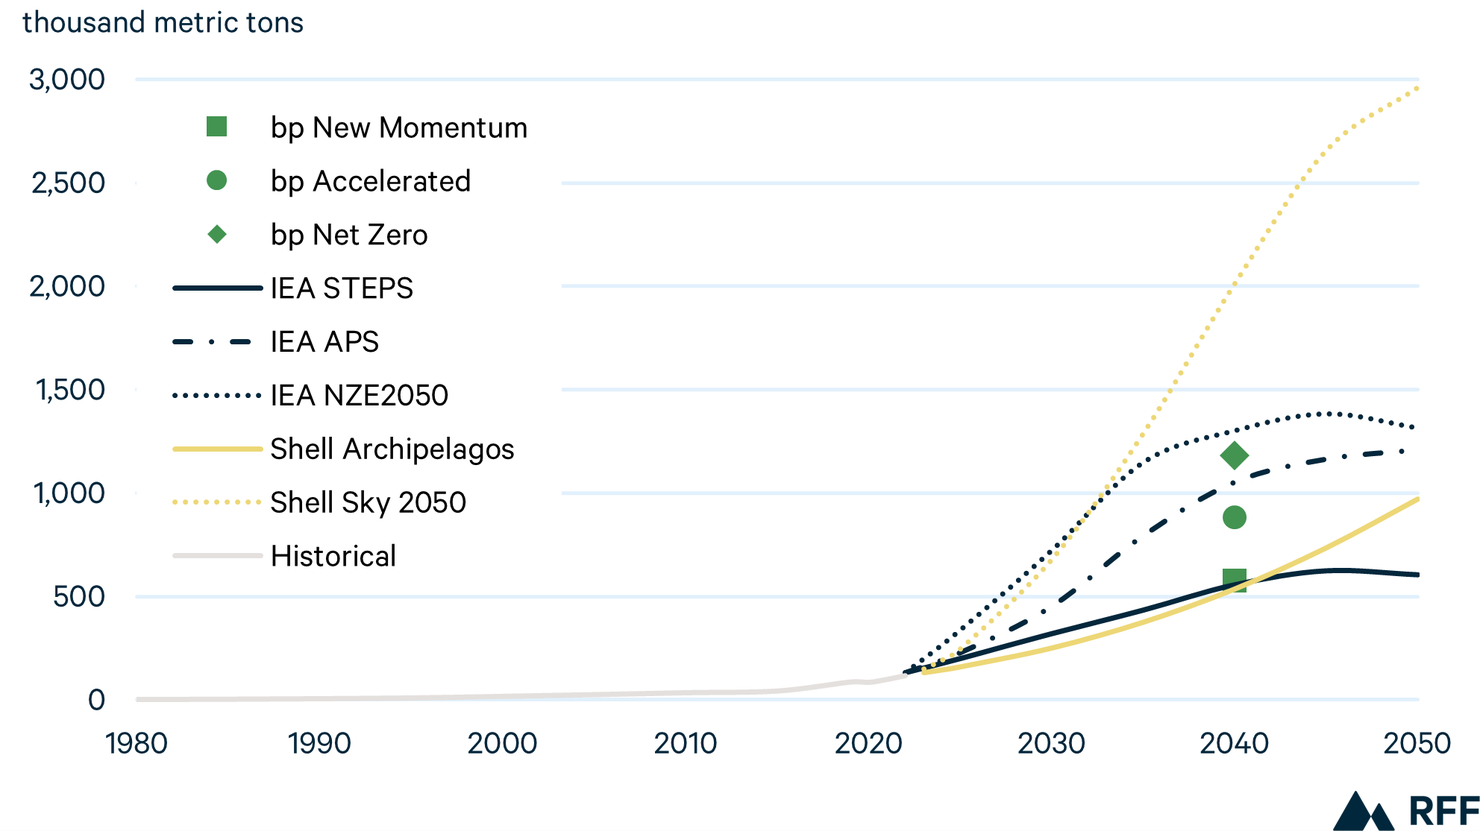
3.3.1. Cobalt
Cobalt’s most prominent use globally is in batteries for electric vehicles. In 2022, roughly 68 percent of the cobalt supply was produced in the Democratic Republic of Congo, and concerns over human health, child labor, and environmental impacts related to this production have been widely publicized. Nearly 75 percent of cobalt processing occurs in China, raising further concerns about supply chain diversification as demand for the material grows in the years ahead.
Figure 17 shows the projections for global cobalt demand. Among the six scenarios that project future cobalt demand, the most conservative (IEA STEPS) shows global demand more than doubling by 2050. Under the IEA’s APS and STEPS scenarios, global demand roughly triples. Under both of Shell’s scenarios, demand growth outpaces all of IEA’s projections, more than tripling by 2050 under Archipelagos and growing by more than nine-fold under Sky 2050.
Figure 17. World Cobalt Demand Projections
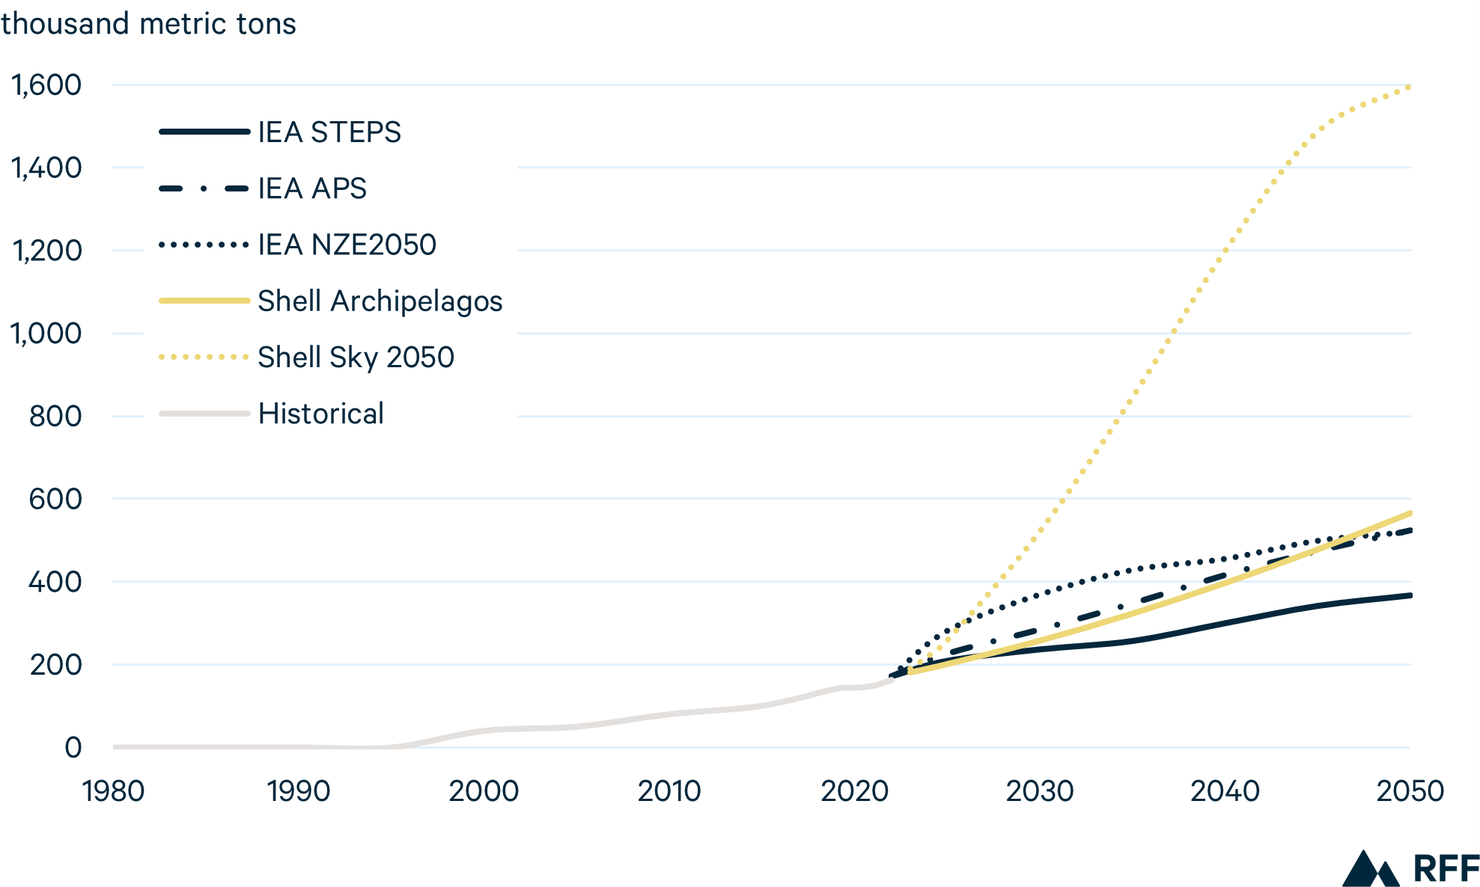
Note: Historical data from Shell
The wide range in projected demand raises significant questions about the assumptions for the deployment of electric vehicles and for other technologies that use cobalt. These include the availability of materials that can substitute for cobalt in future technologies, the potential for efficiency improvements, and the viability of recycling. Indeed, the United States, the European Union, and others have begun to develop strategies to enhance each of these efforts, in an effort to reduce exposure to concentrated markets and potentially unstable supply chains.
3.3.2. Copper
Copper is a fundamental enabler of all aspects of the electricity sector. Its production and refining are more diversified than most other minerals discussed in this section, with major producers including Chile, Peru, Congo, China, the United States, and Russia, although more than 40 percent of all processing occurs in China.
Figure 18 shows the projections for global copper demand. From 1980 to 2022, demand grew at an average rate of 8 percent per year. Under projections from IEA, the average annual growth rate from 2022 to 2050 slows to between 5 and 6 percent across scenarios. Shell and bp, however, project considerably more rapid demand growth, increasing by a minimum of 8 percent per year (Shell Archipelagos) and as rapidly as 14 percent per year through 2040 (bp Net Zero).
Figure 18. World Copper Demand Projections
Note: Historical data from Shell. bp projections available only fore 2040.
3.3.3. Lithium
Like cobalt, global lithium demand rises from a very small base in the years ahead, particularly under Ambitious Climate scenarios, to support the deployment of batteries in electric vehicles and other applications. Current production is centered in Australia and Chile, although continued exploration has led to recent announcements of major new deposits, including in the United States.
Figure 19 shows the projections for global lithium demand. From 2000 to 2022, demand grew on average by 31 percent annually. Looking to 2050, the annual growth rate slows to 19 percent under IEA STEPS but rises by 27 to 40 percent per year across other scenarios from IEA and bp. The fastest growth rate (91 percent annually) comes from Shell’s Sky, where demand grows to nearly 3 billion metric tons per year by 2050.
Figure 19. World Lithium Demand Projections
Note: Historical data from Shell. bp projections available only for 2040.
Like other minerals discussed in this section, material substitution could substantially slow future demand for lithium. Although a wide variety of alternative battery chemistries have been under development for years, it is unclear whether, to what extent, and over what time frame they will grow to compete with the still-evolving lithium-ion chemistries.
3.3.4. Nickel
As with copper, the global market for nickel is well developed, with roughly 3.3 billion metric tons produced in 2022. Indonesia is by far the world’s largest supplier, contributing almost half the total in 2022, with other major producers including the Philippines, Russia, New Caledonia, and Australia. Indonesia is also the world’s largest nickel processor, at 43 percent of the global total, followed by China at 17 percent.
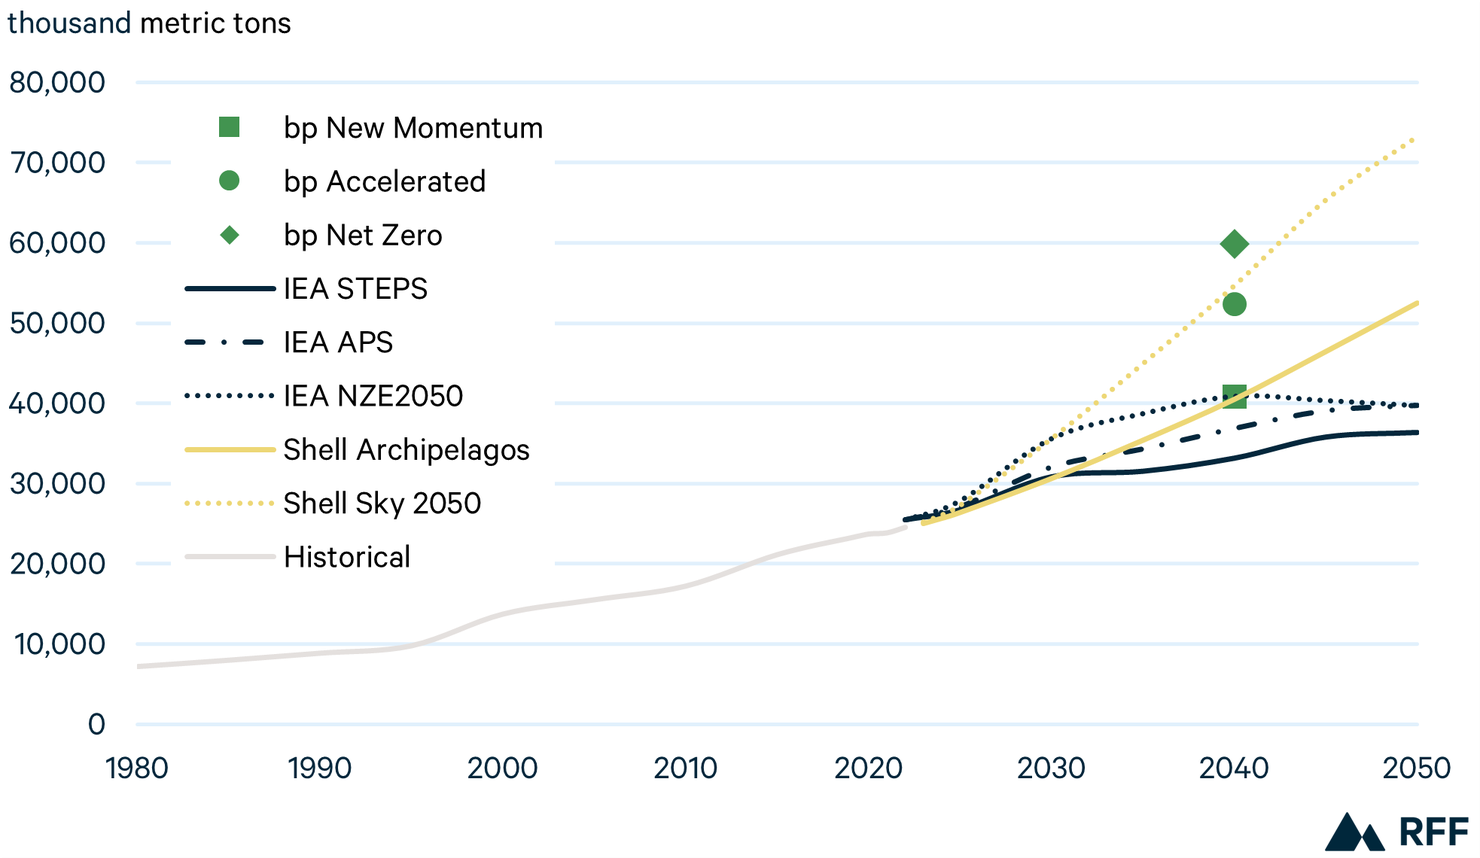
Figure 20 shows the projections for global nickel demand. From 2000 to 2022, demand grew by 9 percent per year on average. Similar to projections for world copper demand, the bp and Shell projections are for robust growth rates, ranging from 10 to 20 percent annual growth to 2040 (for bp) and to 2050 (for Shell). Projections from the IEA are more muted, with growth rates through 2050 of 6 percent in STEPS and 8 percent in APS and NZE. Although data limitations prevent us from carrying out a thorough analysis, it appears that the IEA projections assume greater improvements in efficiency, materials substitution, and recycling than those from bp or Shell.
Figure 20. World Nickel Demand Projections
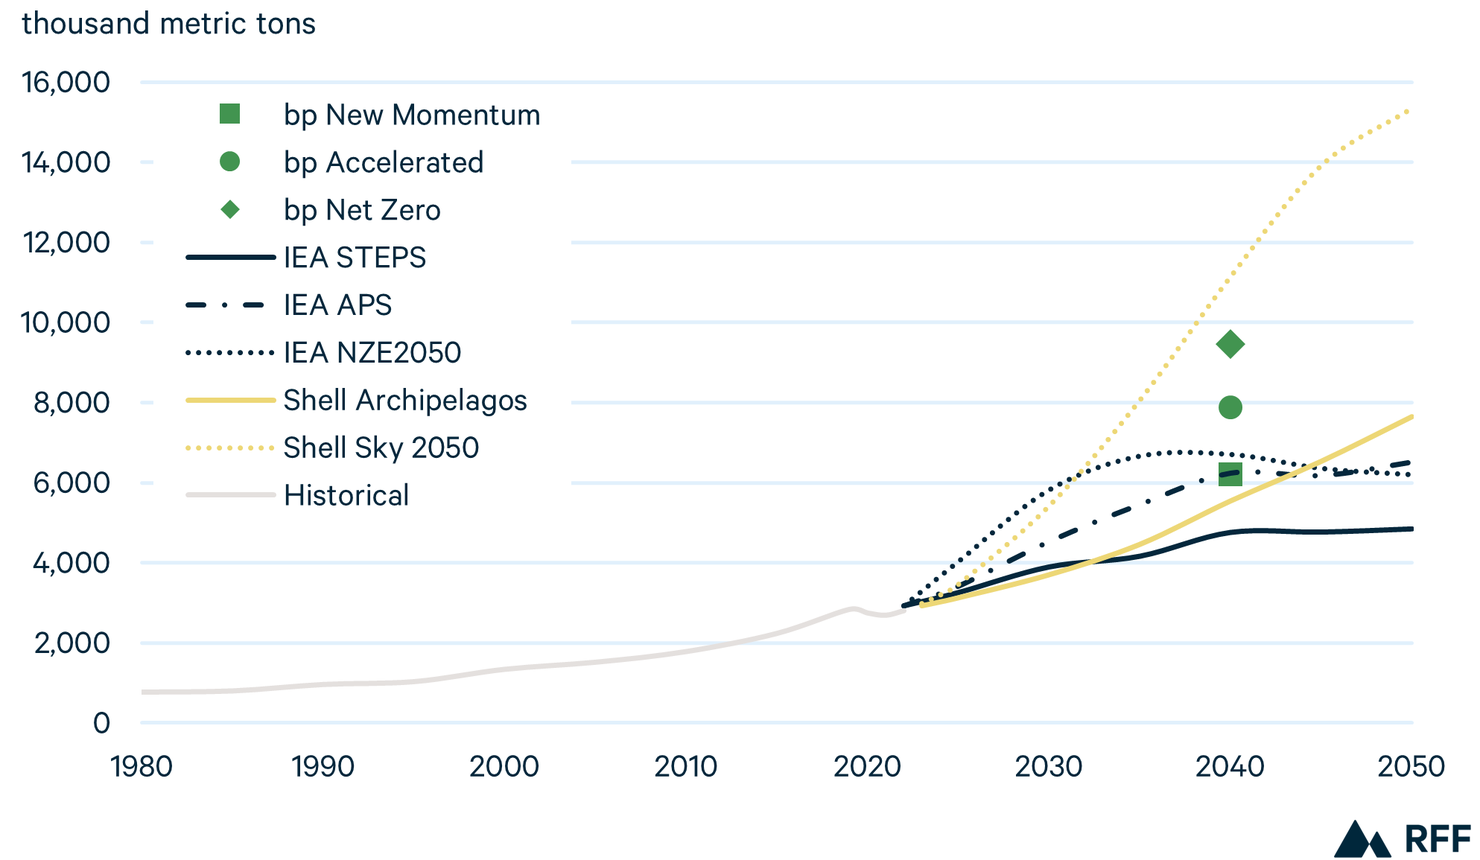
Note: Historical data from Shell. bp projections available only for 2040.
3.3.5. Other Minerals
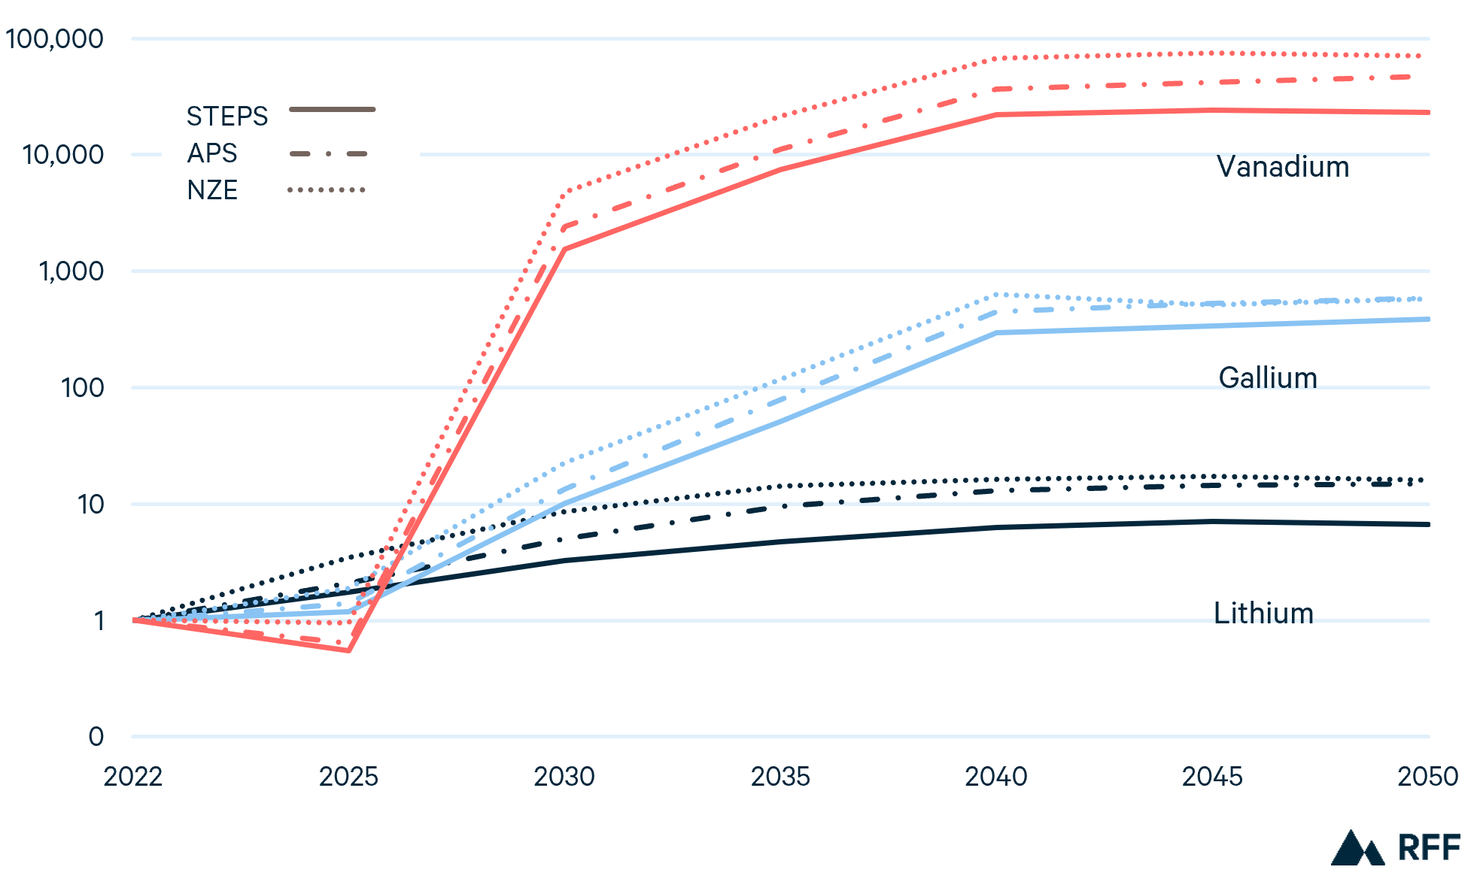
Although the four minerals discussed in the previous subsections are some of the most significant in terms of scale, their rate of clean energy–related demand growth is dwarfed by that of other clean energy minerals (Figure 21). While demand for lithium grows by roughly one order of magnitude under most of the bp, IEA, and Shell scenarios, demand for gallium—which is used in semiconductors and other electronics—rises by nearly three orders of magnitude by 2040 under IEA’s scenarios. Demand for vanadium, which today is used in specialized steelmaking and other industrial applications, grows fastest in all these scenarios, rising by nearly five orders of magnitude by 2040.
Figure 21. Projected Energy Sector Demand Growth for Select Minerals, 2022 = 1 (log scale)
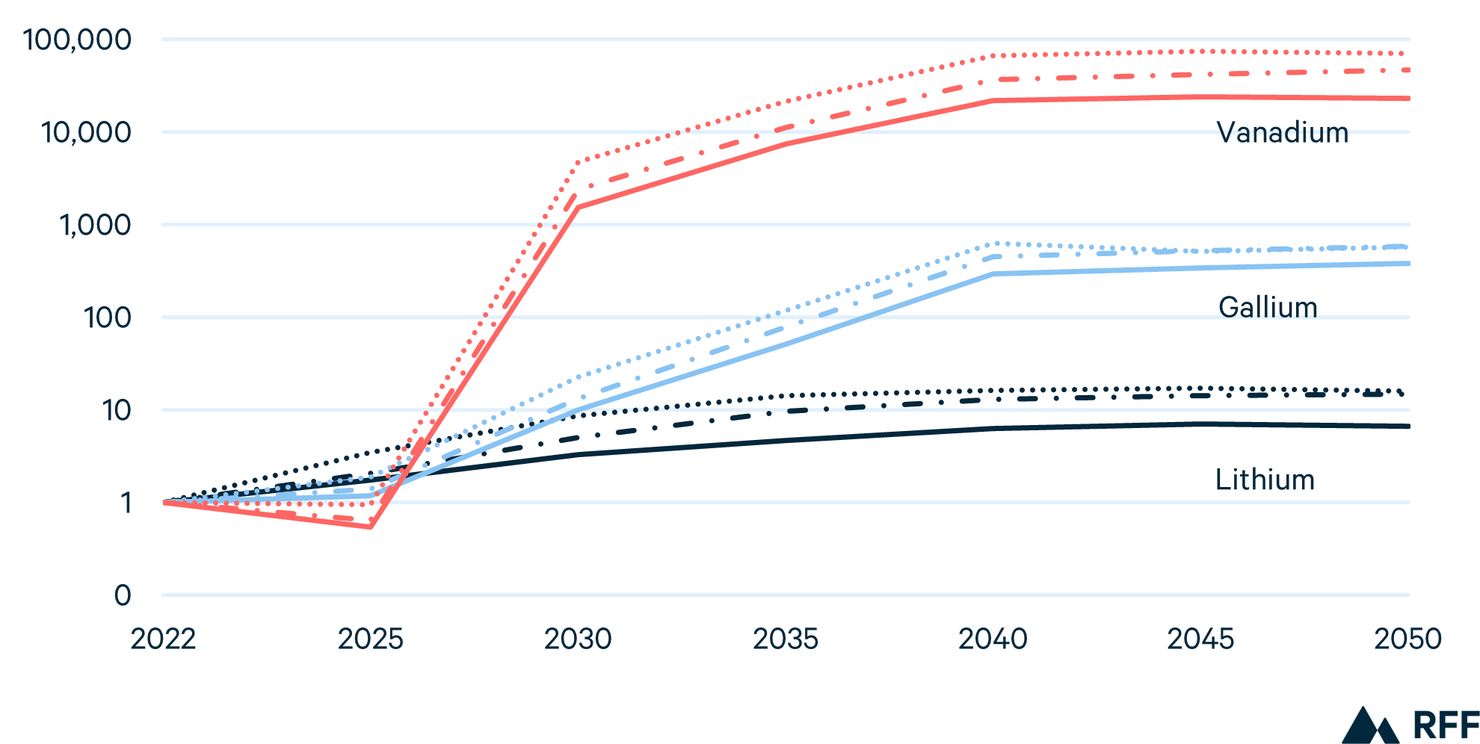
Note: Solid lines indicate IEA STEPS, dot-dash indicates APS, and dotted indicates NZE.
Unlike copper and nickel, which have been mined at scale for generations, many clean energy minerals are starting from a very small base, which helps explain their extraordinary rates of growth. For example, the USGS reports that global production of gallium in 2022 was roughly 550 metric tons, less than 2 percent of which were used in clean energy. Similarly, global vanadium production in 2022 was 100,000 metric tons, roughly 0.1 percent of which was used in clean energy. By 2050, clean energy–driven demand for gallium reaches 3,300 metric tons under the IEA’s STEPS, six times today’s global production across all sectors. For vanadium, clean energy demand rises to 233,000 metric tons, more than doubling today’s global production.
Increasing the supply of a given commodity two-, four-, or even six-fold over the course of 25 years would hardly be unprecedented, especially when beginning from a small base. Nonetheless, the clean energy transition clearly presents new challenges for identifying, sustainably producing, and reliably distributing large new flows of materials across the global economy.
4. Data and Methods
In this paper, we examined projections energy outlooks from a wide range of sources representing a diverse set of views on the future of energy (see Table 1).
These outlooks vary across a variety of dimensions, including differences in modeling techniques, historical data, economic growth assumptions, and policy scenarios. Generally, scenarios can be grouped into three categories: (1) Reference, which assumes no major policy changes; (2) Evolving Policies, which incorporates the modeling team’s expectations of policy trends; and (3) scenarios that do not fall into one of the other two categories and are typically based on policy targets or technology assumptions. We focus on Ambitious Climate scenarios, a major subset of category 3. Table 4 summarizes the sources and scenarios included in our analysis.
Table 4. Sources and Scenarios
4.1. Harmonization
Variations in underlying assumptions about the future of policies, technologies, and markets produce useful variation among outlooks, allowing analysts to view a wide range of potential energy futures. However, outlooks also have important methodological differences, which can complicate direct comparisons and reduce the ability to draw insights.
One major difference is the choice of reporting units. For primary energy, outlooks use different energy units, such as QBtu, million tonnes of oil equivalent (mtoe), or exajoules (EJ). In this report, we standardize all units to QBtu. For fuel-specific data, outlooks also vary, using million barrels per day (mbd) or million barrels of oil equivalent per day (mboed) for liquid fuels, billion cubic meters (bcm) or trillion cubic feet (tcf) for natural gas, million tonnes of coal-equivalent (mtce) or million short tons (mst) for coal, and Terawatt hours (TWh) or Gigawatt hours (GWh) for electricity generation. Table 5 presents the reporting units for each outlook, and Table 6 provides relevant conversion factors.
Table 5. Units of Energy Consumption, by Outlook
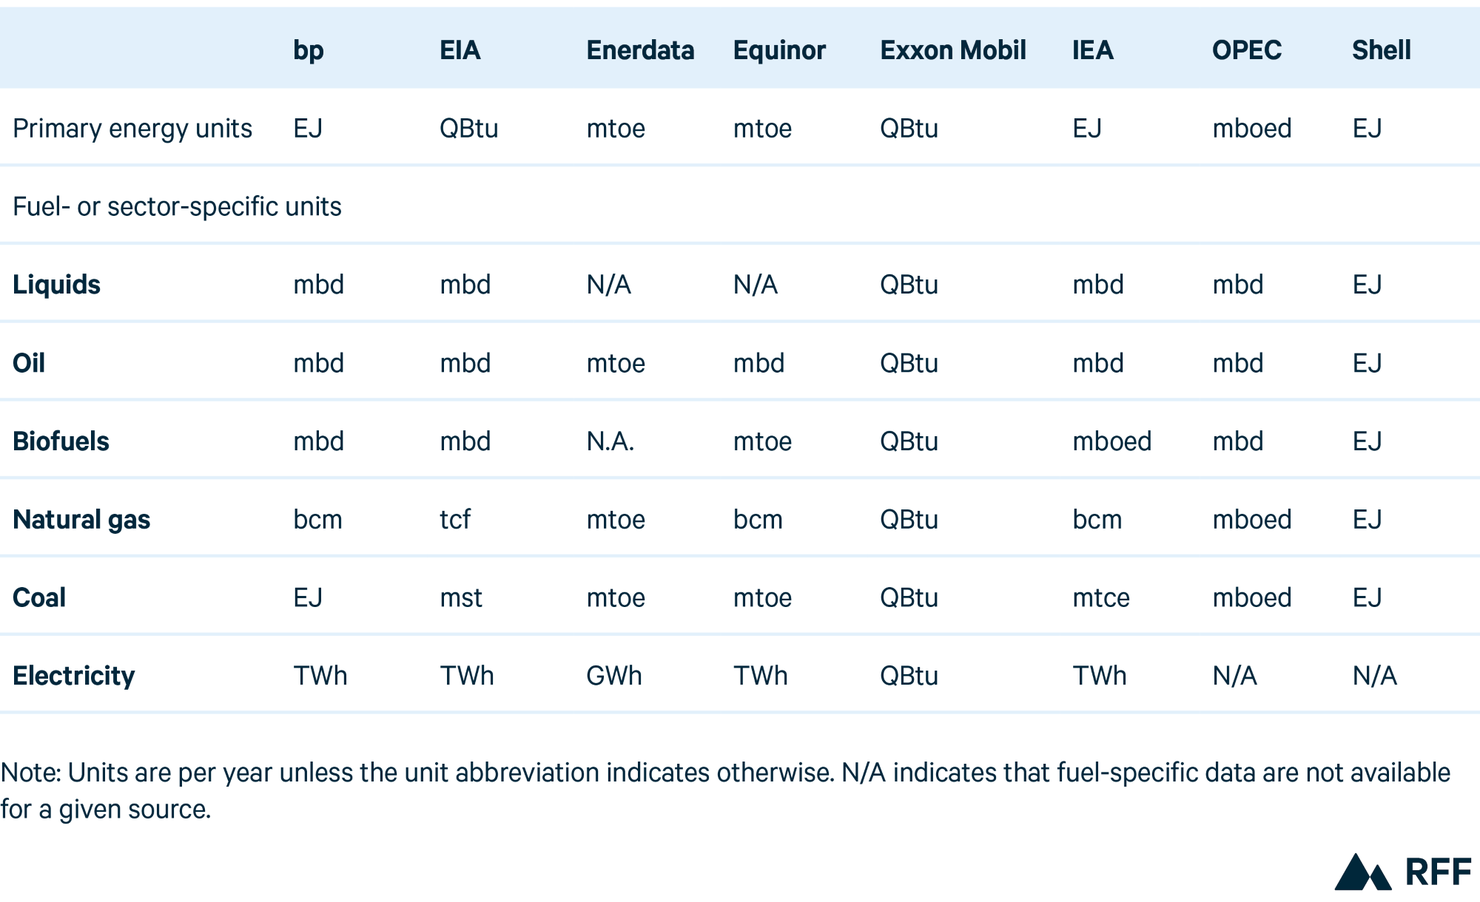
Table 6. Conversion Factors for Key Energy Units
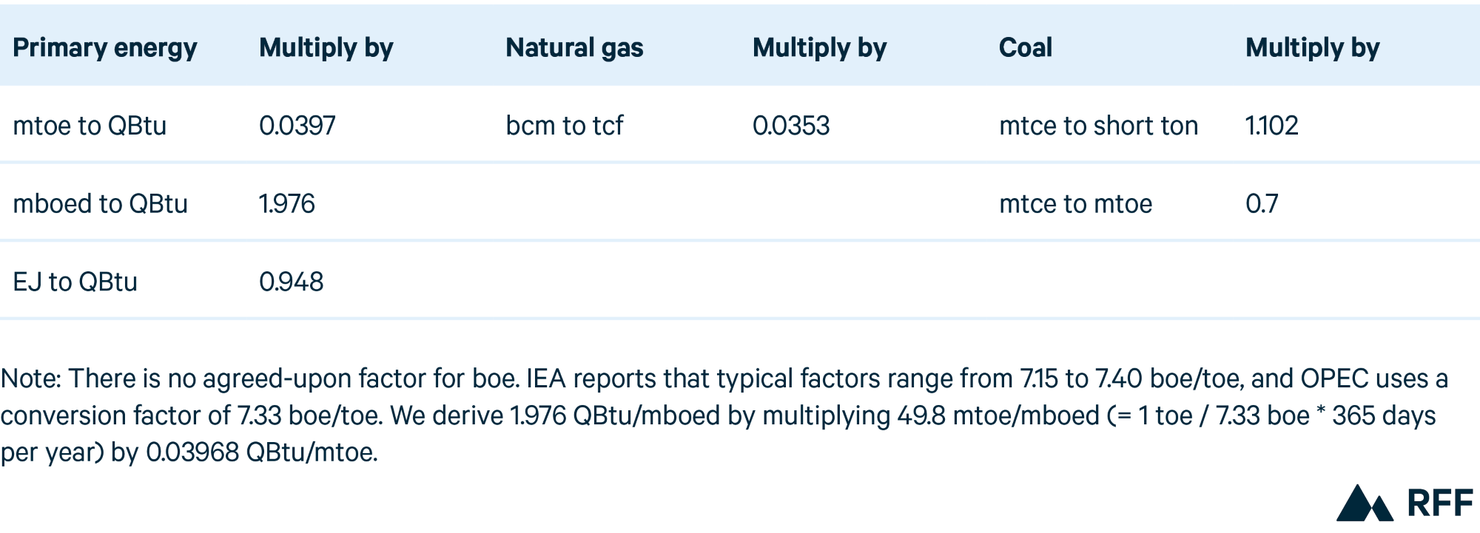
A second key difference among outlooks is that assumptions about the energy content in a given physical unit of fuel result in different conversion factors between data presented in energy units (e.g., QBtu) and those presented in physical units (e.g., mbd or bcm). Among the outlooks we examine, these assumptions vary by up to 10 percent. Although conversion unit variations may appear small, they are amplified when applied across the massive scale of global energy systems, particularly over long time horizons.
A third major difference results from varying decisions about including nonmarketed biomass, such as locally gathered wood and dung, in historical data and projections for primary energy consumption. In previous years, bp and the EIA had not included these sources in their projections. However, bp’s Energy Outlook 2023 does include nonmarketed biomass, allowing for enhanced comparability. (The EIA publishes its International Energy Outlook every two years and did not publish one in 2023.)
Yet another difference relates to comparing the energy content of fossil and nonfossil fuels. The primary energy content of oil, natural gas, and coal is relatively well understood and similar across outlooks. However, a substantial portion of that embodied energy is wasted as heat during combustion. Because nonfossil fuels, such as hydroelectricity, wind, and solar, do not generate substantial amounts of waste heat, identifying a comparable metric for primary energy is difficult, and outlooks take a variety of approaches.
Other differences in outlooks include (1) different categorizations for liquid fuels and renewable energy, (2) different regional groupings for aggregated data and projections, (3) using net versus gross calorific values when reporting energy content of fossil fuels, (4) using net versus gross generation when reporting electricity data, and (5) whether and how flared natural gas is included in energy consumption data.
To address those challenges and allow for a more accurate comparison across outlooks, Newell and Iler apply a harmonization process. We update and use it here. For details, see Raimi and Newell.
5. Statistics
Table 7. Global Key Indicators
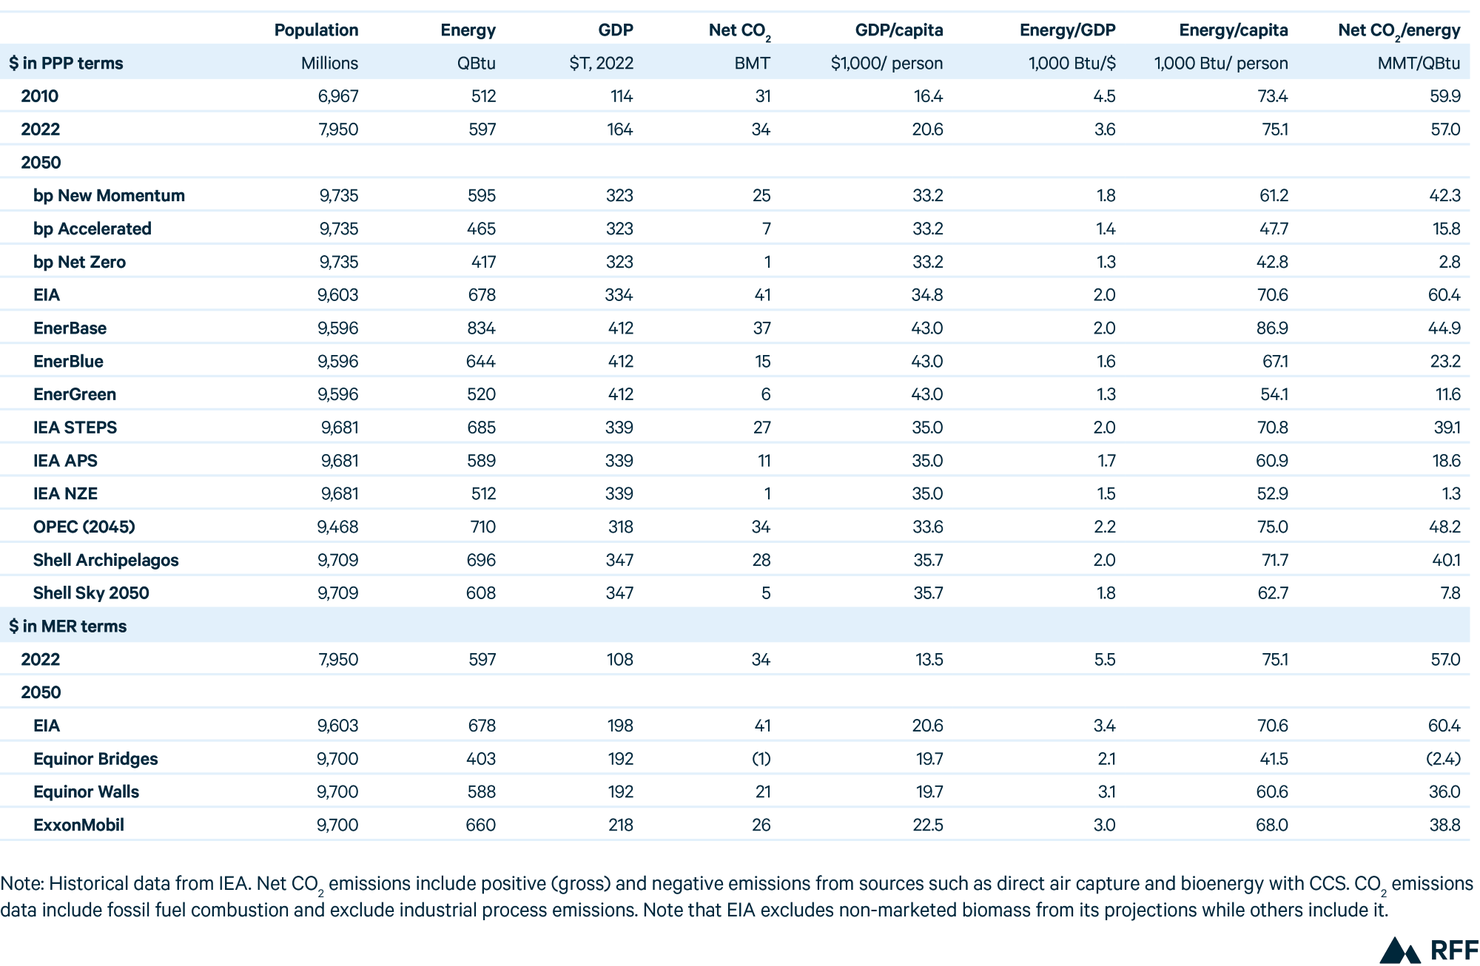
Table 8. World Primary Energy Consumption
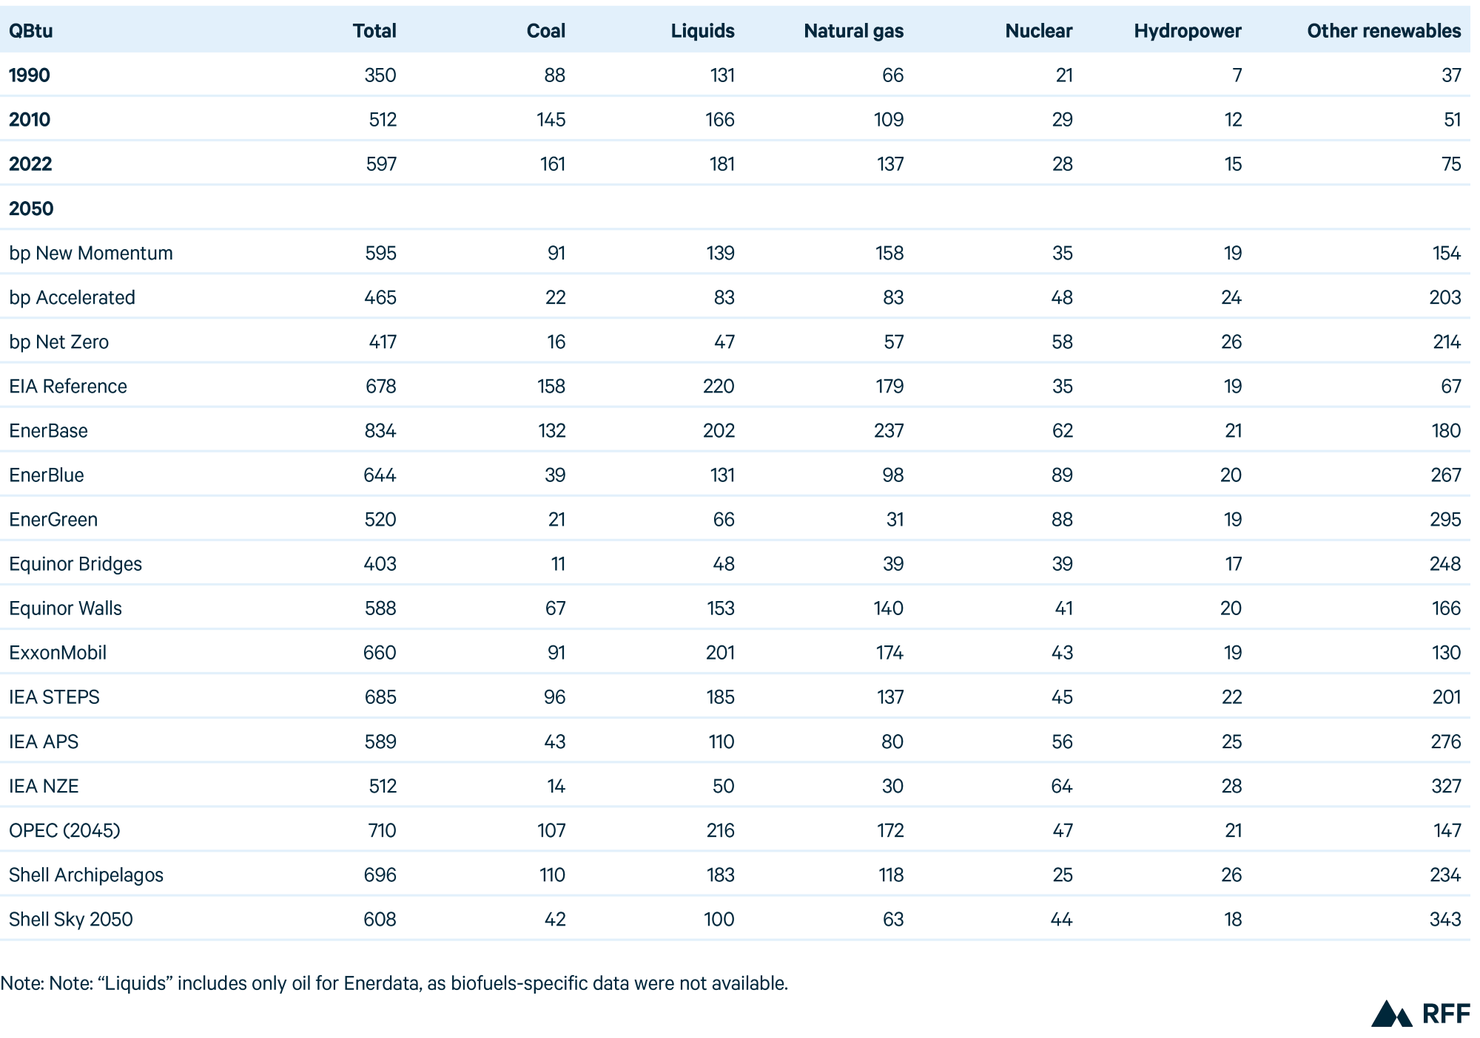
Table 9. Liquids Consumption, by Region
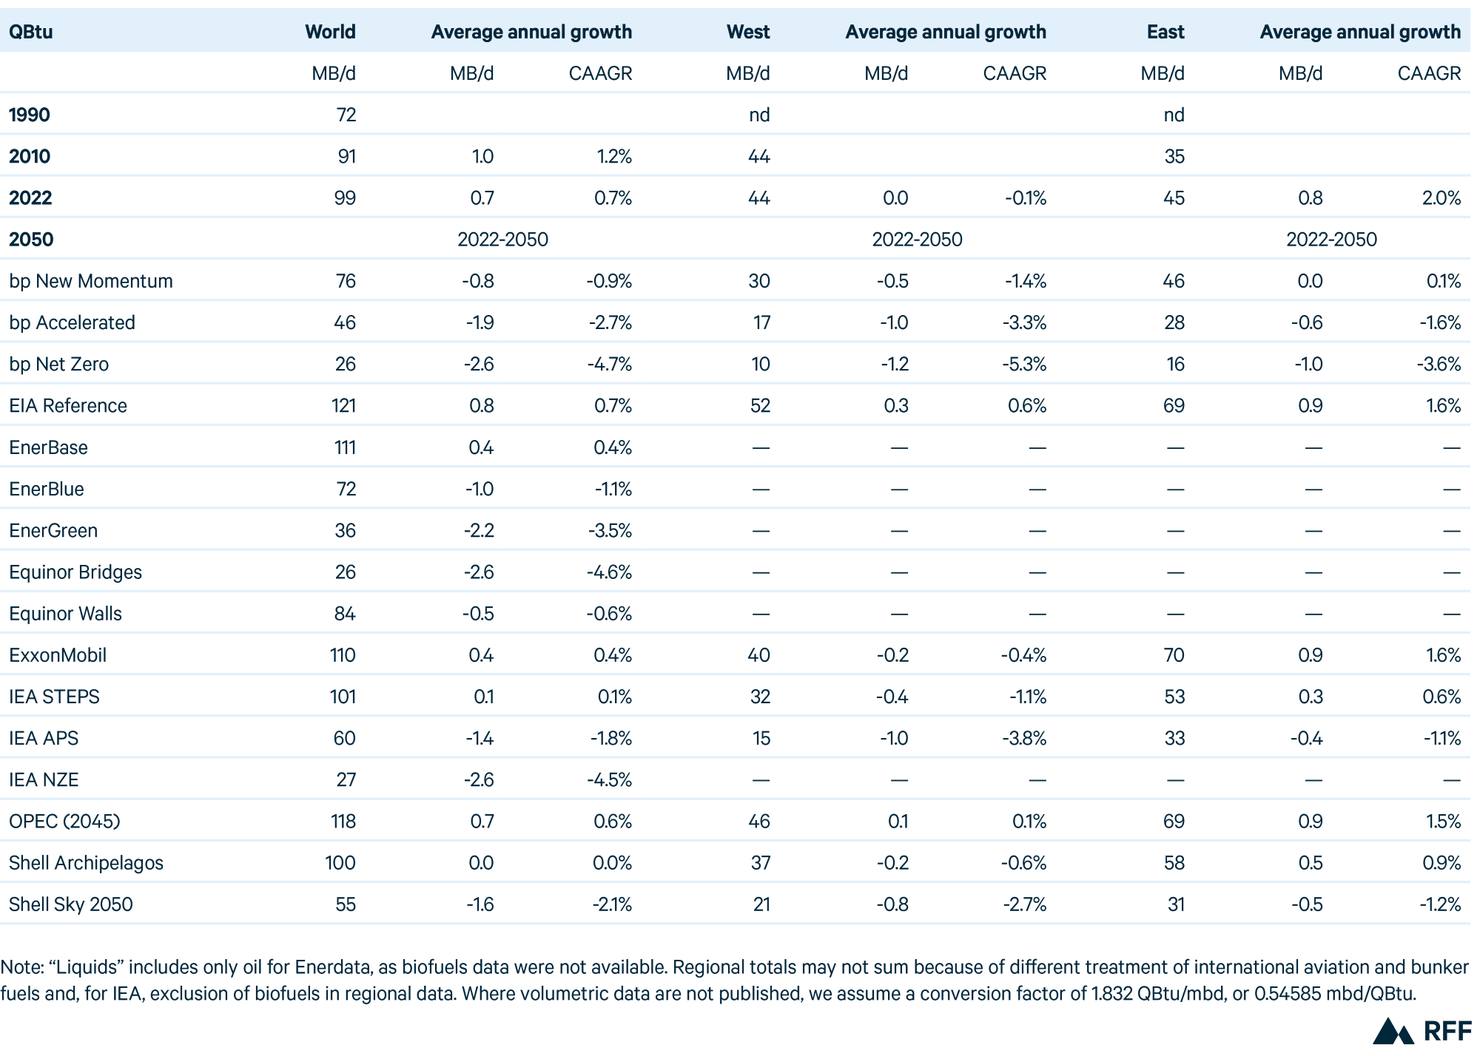
Table 10. Natural Gas Consumption, by Region
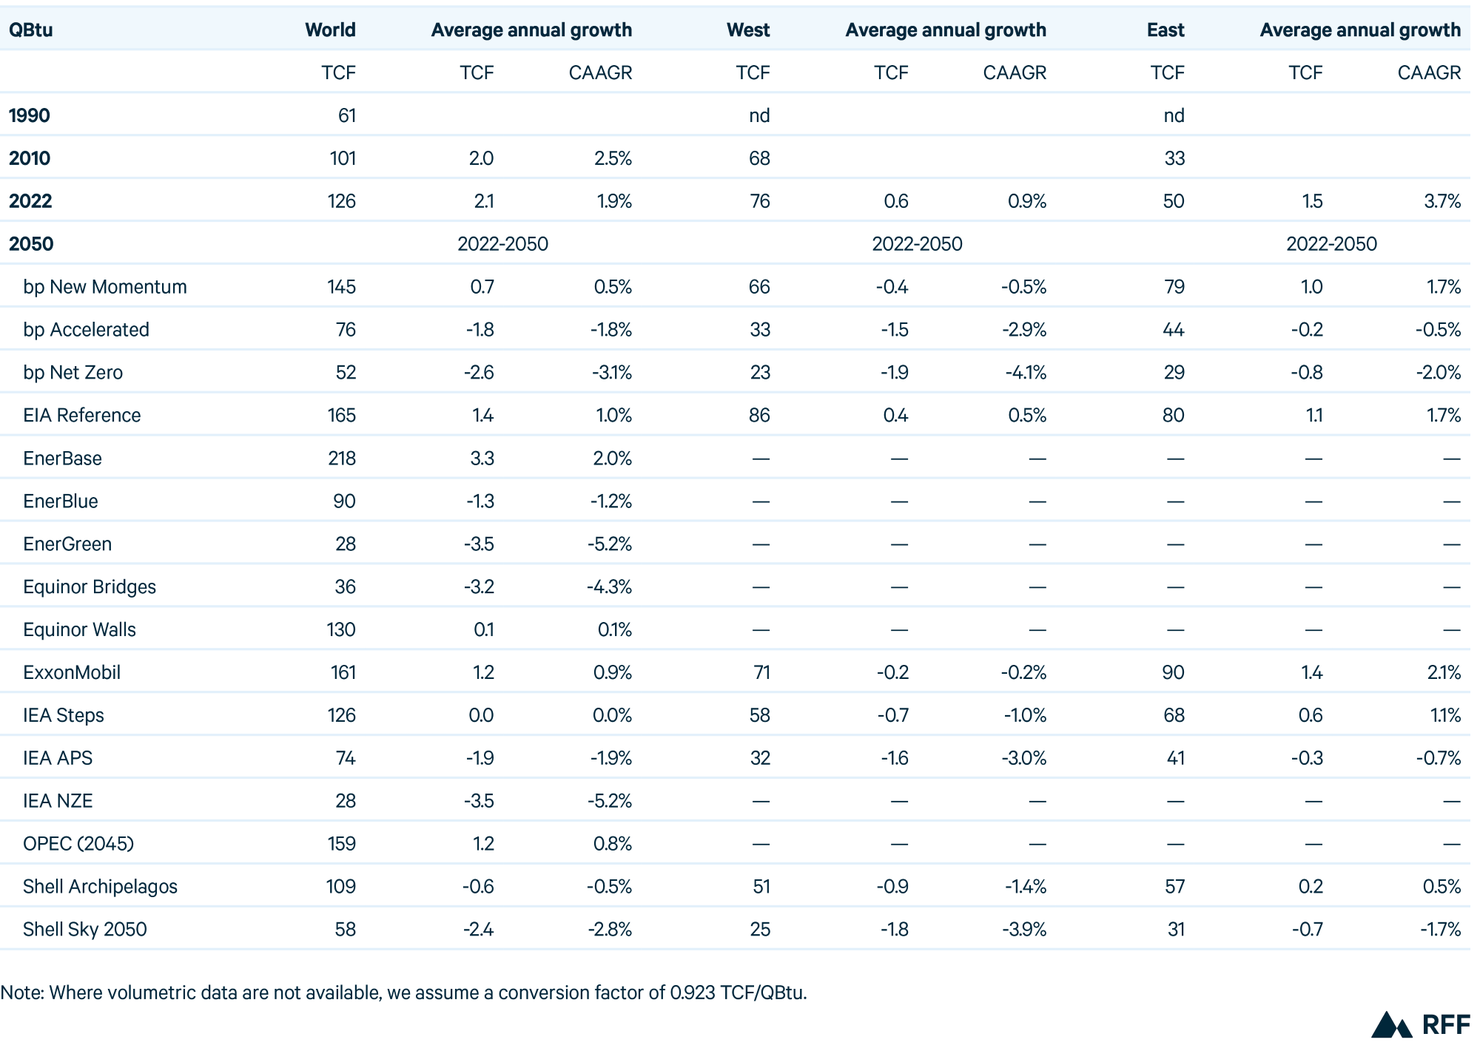
Table 11. Coal Consumption, by Region
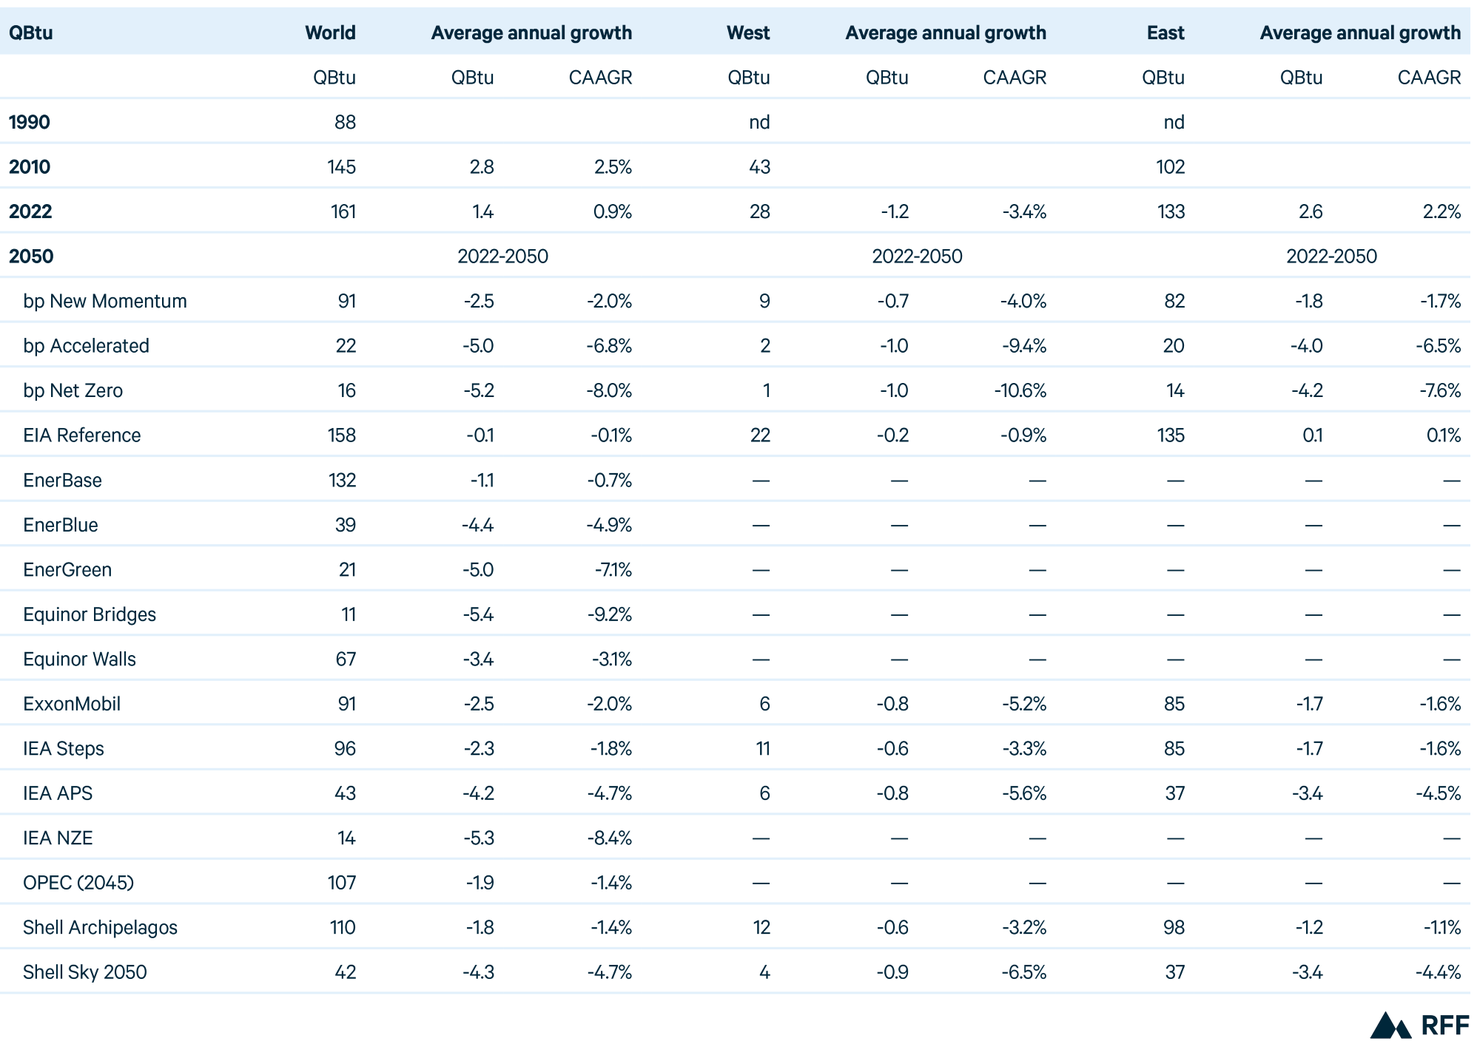
Table 12. Nuclear Consumption, by Region
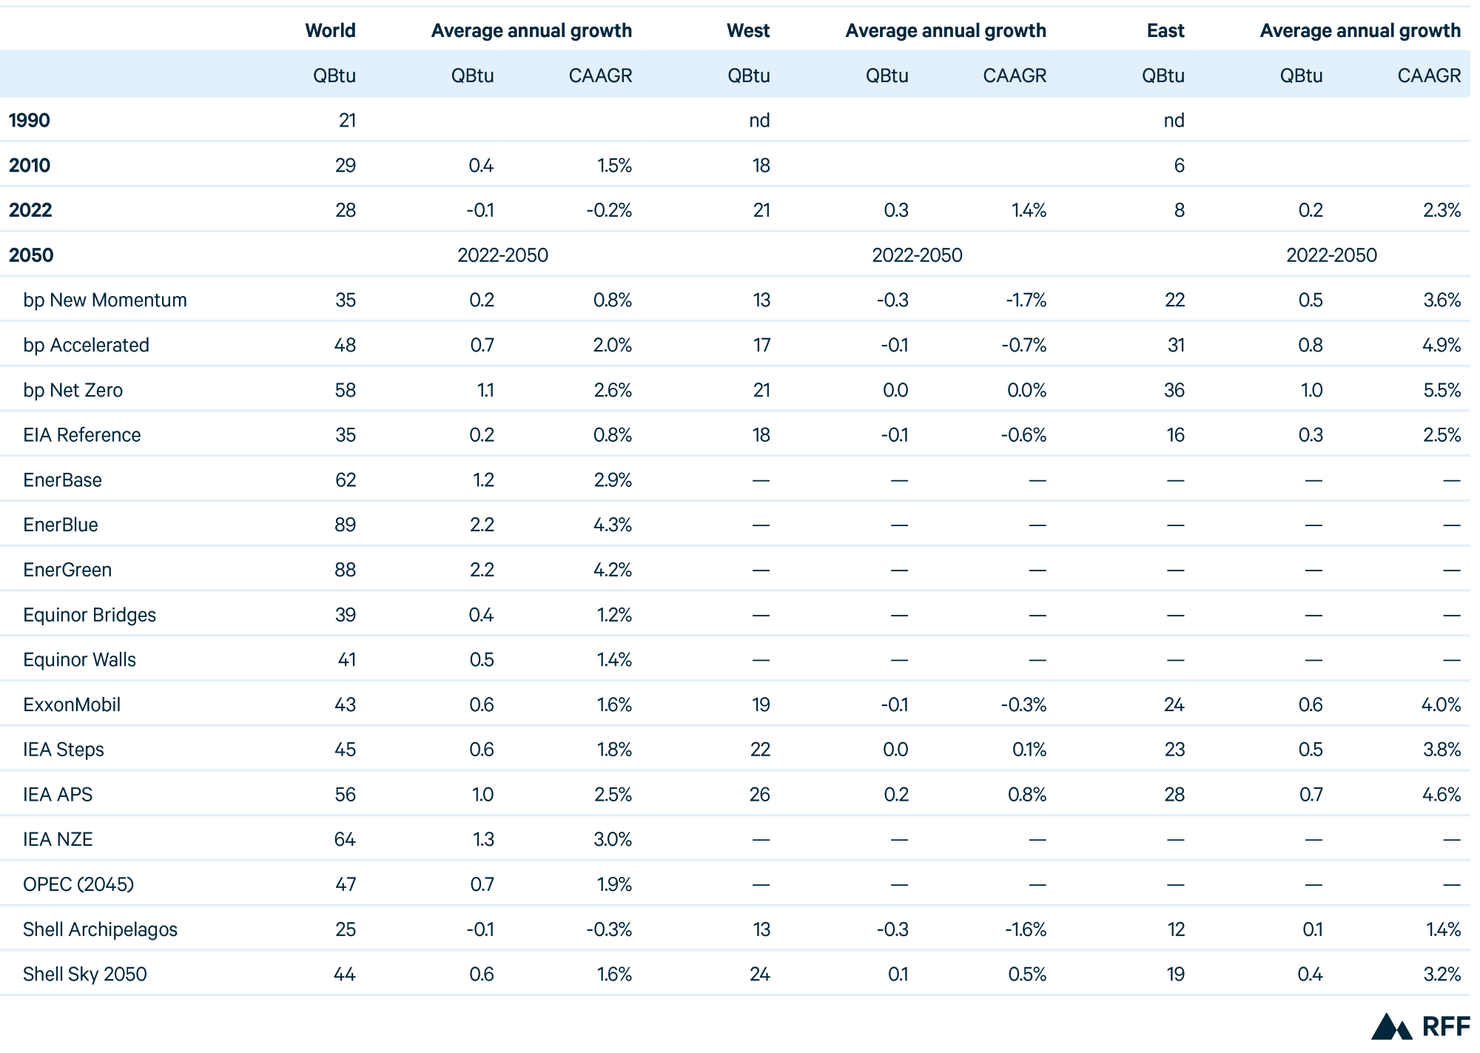
Table 13. Global Electricity Generation, by Source
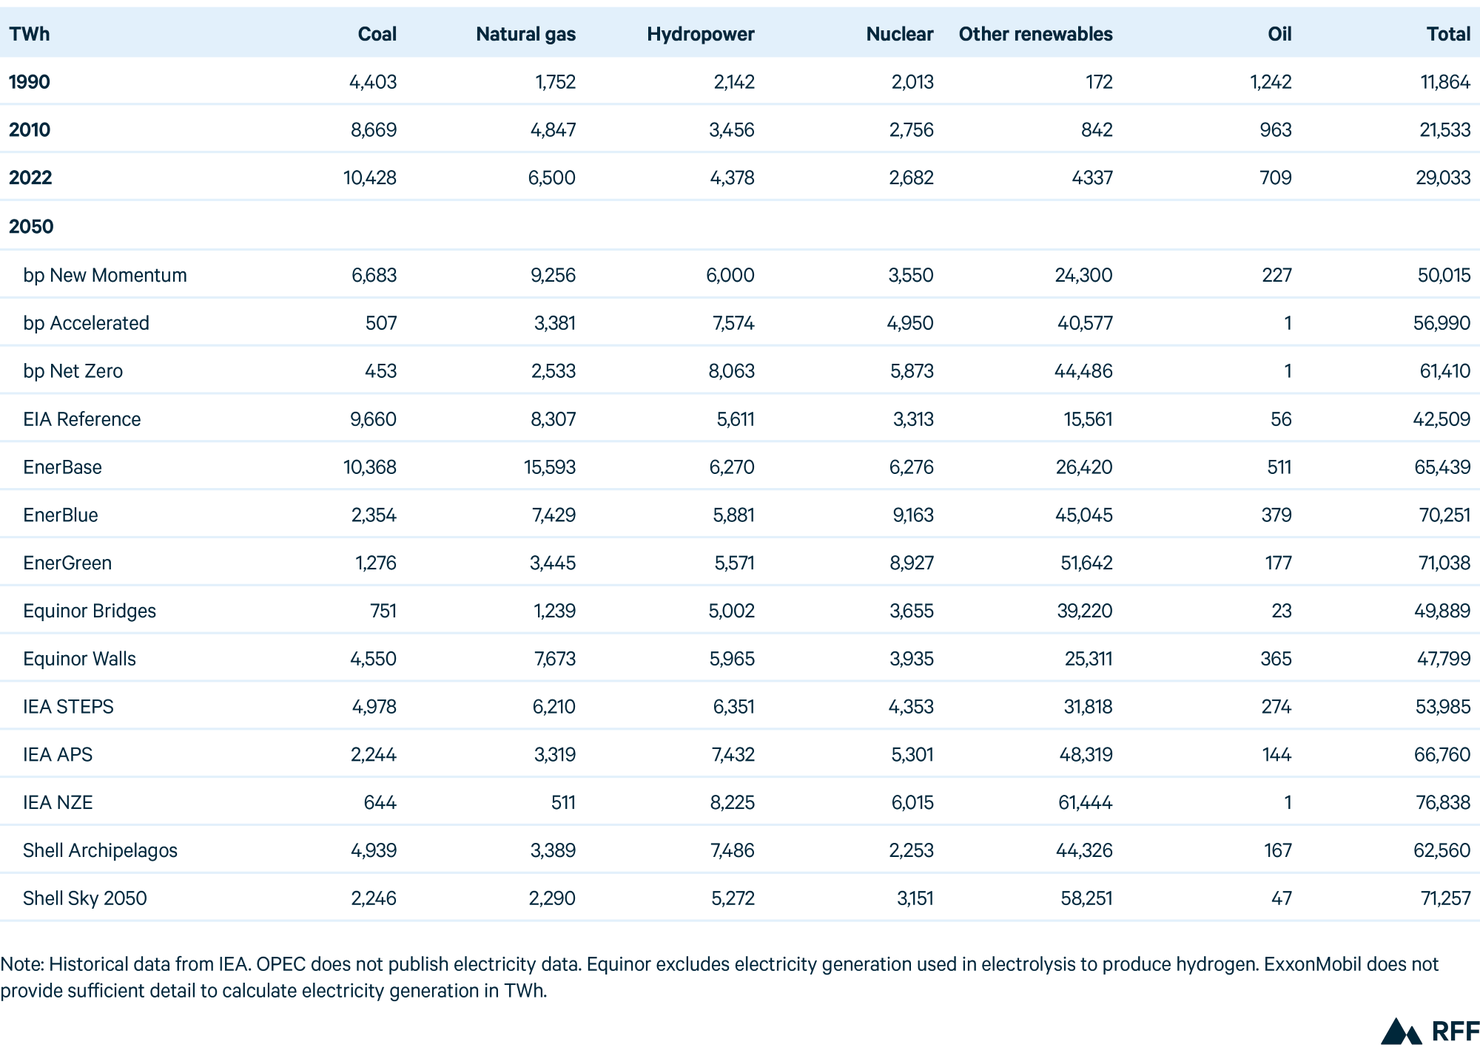
Table 14. Global Renewable Electricity Generation, by Source
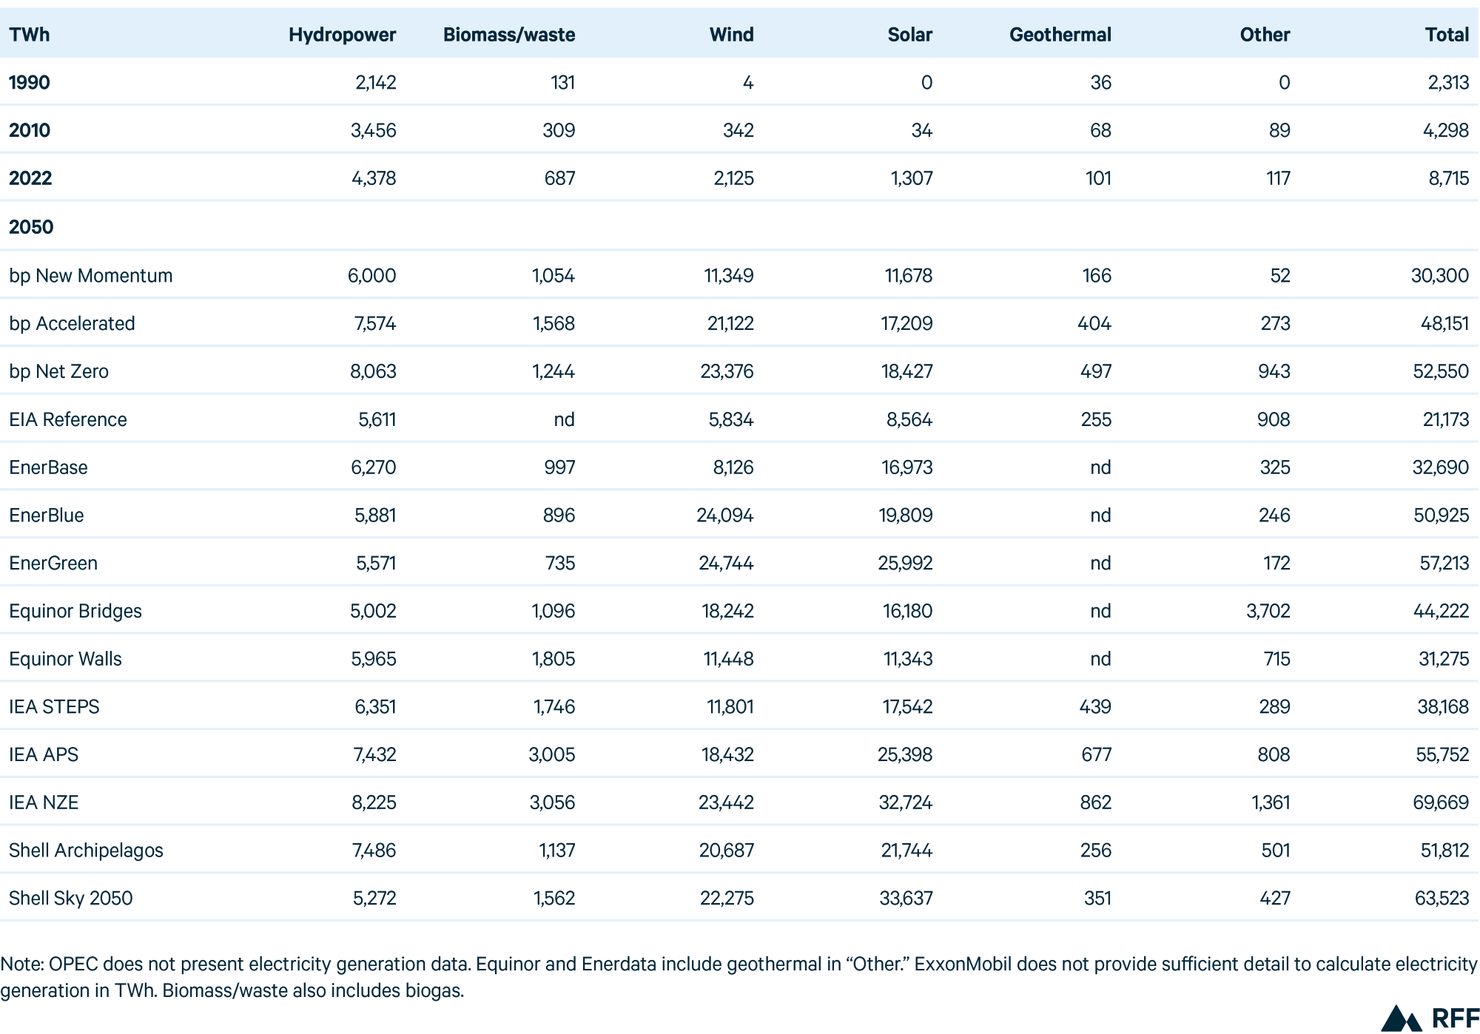
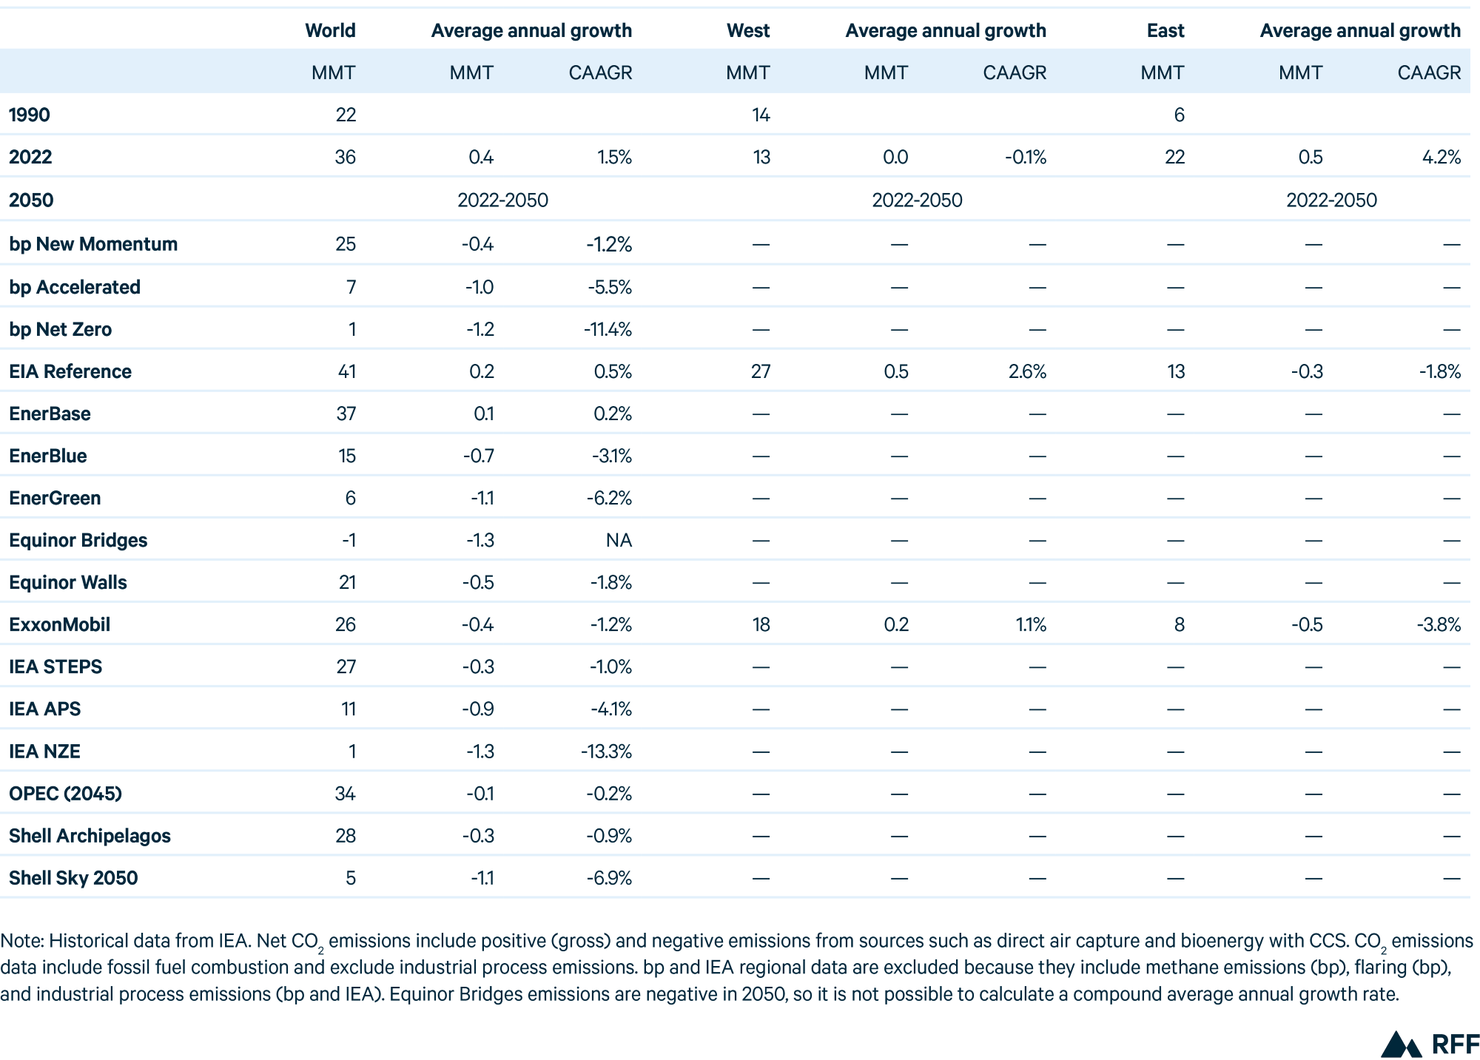
Table 15. Net Carbon Dioxide Emissions, by Region


