Forest Carbon 201: Land Use Effects of Wood Product Markets
A review of how markets for durable wood products in the United States alter land uses and carbon sinks in the built environment and forests, and the associated climate impacts.
The wood products industry strongly influences the amount and structure of forests in the United States, especially on private lands. This explainer reviews how markets for durable wood products in the United States alter land uses and carbon sinks in the built environment and forests. It provides an overview of the opportunities for maintaining forest land and expanding the carbon sink through wood products markets, along with related challenges (here, we use “carbon sink” to include carbon captured from the atmosphere and stored in standing forests or wood products [1]). The explainer concludes with a case study demonstrating strong positive relationships between wood products markets, forest area, and forest carbon in the southeastern United States, the region with the highest harvest rates. Other explainers in this series provide insights into the policy issues and carbon dynamics associated with wood bioenergy.
The forest sector sequesters substantial atmospheric carbon through the growth of trees that are then stored in vegetation and soils for long periods of time. The carbon stored in forests represents about 52 times the nation’s annual emissions and has grown steadily since 1990 [2]. Wood products store harvested forest carbon in the built environment, where wood may persist for many decades. Wood products markets also determine demands for forest land uses and forest management that thereby augment forest carbon stocks, the focus of this explainer.
How Wood Products Markets Affect Land Use and Forest Area
Wood product markets determine the financial returns to forestry and have therefore significantly influenced the amount of forest land in the United States. Robust timber prices encourage conversions of some agriculture to forest uses and reduce the rate at which forests are converted to developed land uses [3].
Forests currently comprise one third of land in the United States. Of this forested land, 42 percent is publicly owned and 58 percent is privately owned (see Tables 1 and 2 here). Ownership varies greatly among regions; a majority of western forests are publicly owned, while eastern forests are largely under private ownership (Figure 1; data source here). Land uses on public lands tend to be stable and restricted by legislation. In contrast, private land uses are fluid in the United States. A landowner’s decision to plant or to retain land in a forest use is influenced by the potential returns to holding forests versus returns to available alternative uses, along with various policies that can affect these options. Factors that maintain or increase the value of forests can stabilize or increase the area of land dedicated to forests [4].
Figure 1. Timberland area by broad ownership category and major region, 2017

The area of nonfederal forests in the United States increased slightly between 1982 and 2012 with a net change of 3 million acres or 0.7 percent ((National Resource Inventory (NRI)). This small change resulted from large offsetting changes, however—17 million acres of forests were converted to urban uses, while 22 million acres of agricultural lands were converted to forest uses, and with all other changes accounted for, this netted out to an 3 million acre gain in forest area. Urban uses increased by 59 percent, from 72 million acres to 114 million acres, during this time (Figure 2A), while agricultural land area decreased by 12.3 percent, from 552 million acres to 483 million acres [5].
The dynamics of rural land uses (mainly agriculture and forests, but also including rangelands) reflect the interplay of several factors beyond the development of rural land for urban uses. Over this period, enhanced crop productivity reduced the demand for cropland while increasing timber prices led to increased demand for private timberland. Growth in the financial returns to forests relative to other land uses led to stabilized and slightly expanded area of forests between 1982 and 2002 (Figure 2B). Since then, the extent of land use switching both into and out of forests has dampened as timber prices have levelled off and crop prices have strengthened. Most increases in forest uses have been in the eastern US, especially in the Southeast (Figure 3).
On net, between 1982 and 2012 22 million acres of rural land transitioned from agricultural uses to forest uses in response to the increasing value of forest uses relative to agricultural returns. National and regional economic studies of land use have identified timber value as a significant variable in determining the rate of land use switching: as timber prices increase, so does the rate of transition to forest uses. Some studies have also linked timber price or forest financial returns to rates of development—that is, as timber prices rise, the rate of transition from forest to urban land decreases. In both ways, wood products markets have stabilized or enhanced the area of land dedicated to forest uses in a dynamic landscape [6].
Figure 2. (a) Net change in nonfederal land use. (b) Average annual inflows, outflows and net change in nonfederal forest land use (average of previous five years)

Figure 3. Change in the percent of county nonfederal land in a forest land use between 1982 and 2012 (diff)

How Carbon Is Stored in Wood Products
Wood products do not capture carbon directly from the atmosphere. Instead, they provide an auxiliary carbon reservoir that expands the overall capacity of the forest sector to store carbon. Finished wood products are roughly 50 percent stored carbon by weight, and they can store this carbon throughout a lifecycle that can extend well over 100 years (Figure 4). For example, the median life of a single-family house in the United States is about 80 years, after which demolished materials can persist in landfills for many years or be utilized for bioenergy in lieu of fossil fuels. There is also a growing interest in repurposing wood from structures for furniture and other products.
Figure 4. Flows of carbon into forests, wood products, and disposal systems and back to the atmosphere through emissions
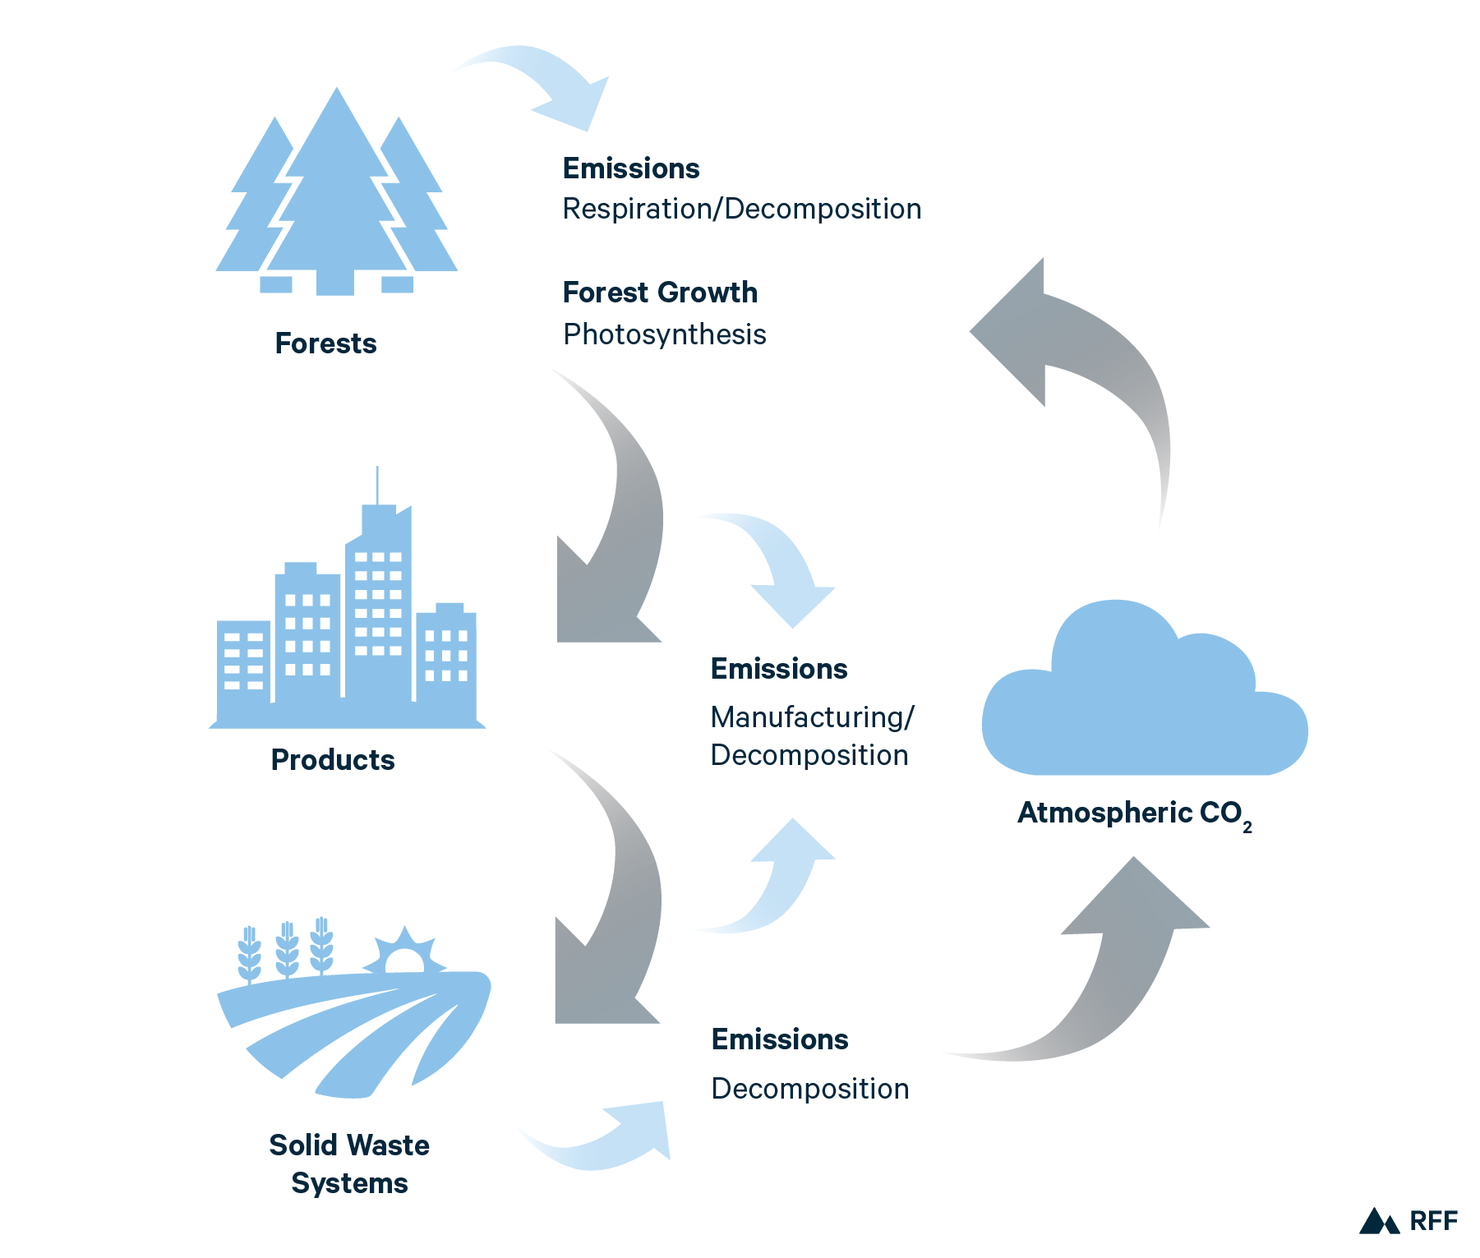
Growth in wood products carbon storage boosted the nation’s forest carbon sink between 1990 and 2018, according to the annual Inventory of US Greenhouse Gas Emissions and Sinks. Forest carbon is tracked into and out of the three pools shown in Figure 4: standing forests, wood products in use, and wood products in solid waste systems (Figure 5). The net growth of these pools defines the overall sequestration of carbon from the atmosphere--the size of the carbon sink. Net growth in the wood product carbon pool (products in use plus waste) accounted for about 15 percent of the US forest carbon sink between 1990 and 2018. Projections indicate that the wood products portion may increase to as much as 30 percent by 2060, given current rates of wood product consumption (see Chapter 8 here).
Figure 5. (a) Forest carbon pools split into biogenic carbon and soil carbon, and products carbon. (b) Carbon sink for forest and product pools (aggregated) .

The size of the wood product carbon sink is determined by the use of wood products and the depreciation of buildings and other infrastructure. The construction sector has been the primary consumer of wood products and the number of housing starts in the United States is a strong predictor of the size of the wood product carbon sink in the United States (Figure 6). However, downward trends in the use of wood in new construction has gradually decreased the amount of carbon stored per square foot of construction activity. New technologies for using wood to build taller buildings (mass timber products) could moderate or even reverse this trend and increase the wood and carbon content of both residential and commercial construction in the future.
Figure 6. Carbon sinks associated with harvested wood products in use and in solid waste, 1990–2017

Effects of Wood Products Markets on Carbon in Standing Forests
Wood products markets directly influence timber harvest rates and forest management choices, and alter the amount of carbon in standing forests. Harvest rates can reduce the amount of carbon in standing in a fixed-area forest, but productivity enhancing management can increase stored carbon.
The wood products industry strongly influences forest structure in the United States, especially on private lands. A forest stand develops through time via tree growth, mortality, and management activities. As a new stand grows, it accumulates biomass and carbon in standing trees, and as time progresses, growth slows, with the forest reaching a maximum carbon content where biomass growth is roughly equivalent to its losses from mortality. In unmanaged forests, this equilibrium can be disrupted by various forms of natural disturbance—for example, insect epidemics, hurricanes, or wildfire. In managed forests, harvesting removes some or all forest biomass at regular intervals, with some carbon emitted back into the atmosphere through wood decomposition and the remainder transferred into wood product carbon pools (see Figure 4).
In the long run, a forest region will attain an equilibrium where forest growth and mortality via disturbance and harvesting even out. The timing of this equilibrium, and the size of the forest region’s carbon pool, depends on the management regime, ecosystem type, productivity, and climate conditions of a forest, as well as natural disturbances and harvest rates. The long-run carbon storage in the forest region would be influenced by management choices affecting productivity (e.g., planting, fertilization, thinning), climate conditions, disturbance frequency, and harvest rates. As forests approach this type of equilibrium, the net growth in the carbon pool (carbon sink) approaches zero, while the wood products carbon sink can continue to expand as long as the built environment continues to grow.
In the United States, forest carbon is relatively stable or near an equilibrium level in the Rocky Mountain region and growing slowly in the Pacific region, but growing strongly in both the North and the South. Growth in the forest carbon sink is therefore strongest in the regions that are most actively managed—together the North and South provide about 80 percent of timber products and tree planting.)
Harvesting for wood products also reduces CO2 emissions from natural disturbances occurring in older forest stands. For example, forests become more vulnerable to Mountain Pine Beetle or Southern Pine Beetle outbreaks as they age, and harvesting limits the time that a given stand is susceptible to this episodic tree mortality.
Potentials for and Challenges to Increasing Wood Product Carbon Sinks
The forest sector is a critical carbon sink, especially in the United States, where atmospheric carbon dioxide sequestered and stored by forests and products has offset about 12 percent of CO2 emissions economy-wide. Trees capture CO2 from the atmosphere through photosynthesis and accumulate carbon in solid biomass in standing forests. Harvested wood products can expand this pool of carbon by transferring carbon captured by forests into housing, commercial buildings, and other physical infrastructure with very long residence times. As harvested forests regrow, they capture additional CO2 and the cycle repeats. The strength of wood product markets influences how forest carbon is stored, the overall area of forests, and how and where forests are grown.
As forestry has shifted to a more agricultural approach in the United States, strong wood products markets have raised the demand for private forest land, increased investments in forest growth, and supported carbon storage in products and forests. In the face of ongoing urbanization, strong wood products markets have the potential to help maintain—and even expand—the area of forests in the United States. This potential may be offset by competition for other land uses and limited demand growth for wood products.
Timber supply (the amount of timber produced at a given price) is a key factor in understanding the economic potential for increasing wood products carbon sinks. Total timber production expanded in the United States from the late 1950s until the late 1990s and now stands at about 15 percent below peak levels [7]. Throughout this time, the area and standing stock of forests grew, especially in the southeastern United States. The supply of timber in the United States continues to grow, reflecting timberland investments and growth in forest inventories. This suggests a strong potential for increasing wood products outputs and carbon sinks within the current forest area of the nation, especially in the Southeast where growth in supply is the strongest. In the long run, competition for a fixed land base among all land uses determines supply capacity, but ongoing technological changes suggest a potential softening of demand for agricultural land uses and potential for additional reforestation [8].
Ongoing and projected land use changes raise some concerns about potential declines in forest area in the next several decades, due to urbanization. Multiple projections of national population and income growth indicate that historical rates of urbanization may persist through 2070, and it is not yet known how the recent surge in second home purchasing and out-migration from cities due to COVID-19 will affect the availability of forest land for active timber management. Land use projections suggest that growing wood products markets, and resulting increases in timber values and afforestation, can offset and/or moderate forest losses.
The various ecosystem services provided by forests are altered by forest management and could define some localized limits on production growth. Maintaining tree cover of multiple ages across a forested landscape provides multiple benefits including habitat, watershed protection, and recreation. Tradeoffs among uses and these benefits have long been the source of debate over the use of public forest lands and have been the motivation for monitoring and guiding management on private forests (e.g., FIA and State-level Best Management Practices). Forest certification systems incorporate these benefits as part of their sustainability criteria. Concerns about emerging scarcity of ecosystem services is largely focused on scarce forest types and in localized areas. Ongoing restoration of scarce forest types, for example the Longleaf pine forest type in the Southeast, provides a mechanism for enhancing ecosystem services often in ways that are compatible with forest utilization.
Because wood supply is so strong, the expansion in wood products use will be limited by demands. Economic and population growth ultimately determine the demand for new construction in both residential and commercial sectors, and the utilization of wood in construction is governed both by these market forces and by various policies. Changes to building codes to allow for more wood use in tall buildings and climate policies that place value on carbon storage could expand demands for forest land uses and wood products carbon sinks. To avoid unintended consequences and increase effectiveness, policy initiatives focused on expanding the overall forest carbon sink should jointly value carbon in products and in standing forests.
Case Study: The Growing Wood Products Sector of the Southeastern United States
The southeastern United States provides a case study on how a growing wood products sector can affect changes in land uses and in forest conditions. From 1962 to 1998, demand for wood products led to a more than doubling of harvesting , encouraging forest investments that expanded the area of forests in the region. Increased harvests did not erode carbon pools, and, after an adjustment period, the size of the carbon sink grew. This case study is based largely on data reported by the US Forest Service FIA program with additional data from the National Resource Inventory.
Over the second half of the twentieth century, the production of wood products shifted in the United States from a focus on old-growth harvesting in western regions to management of second-growth forests in the southeastern United States. This regional transfer accelerated in the 1990s because of harvest reductions on federal lands, in part due to the listing of the Spotted Owl as an endangered species.
The production of wood products and timber harvesting grew strongly in the Southeastern United States over this period (Figure 7). Timber production more than doubled between the early 1950s and the late 1990s and then trended down until 2008, especially in response to the housing-led recession of 2007-2009; however, it is again trending upward. Hardwood output declined relative to softwood output over this period, and softwoods (mainly pine) now account for more than 75 percent of total output. Technological change has steadily shifted timber demands toward small-diameter softwoods—output of small-diameter softwoods grew steadily from 28 percent of total output in 1952 to 50 percent in 2017 (Figure 7; Periodic data from RPA report (Table 41 here) with intervening years interpolated based on wood products outputs from Howard and Liang., methods outlined in Wear et al 2007). How did this doubling of timber harvesting and changes in technology affect changes in land use and forest conditions of the region?
Figure 7. Imputed timber production in the US South, 1952–2017

Figure 8. Rates of change into and out of forest land use

Land use: Sustained expansion in wood products markets signaled future demand growth for timber and incentivized investment in new forest land. Over this period, the total area of forests stabilized, despite the urbanization of about 340,000 forested acres per year. Transitions from other land uses to forest uses account for the net growth in forest area over the period (Figure 8). Gains in forest area were strongest between 1982 and 2002, corresponding with strongest wood product market expansion. Since then, forest area has leveled off (as measured by both NRI and FIA data sets).
Figure 9. Area of planted pine forests in the South and the proportion of timberland that is planted pine

Forest management: Over this same period the area of planted forests grew at a rate of about 830,000 acres per year (FIA). A little more than 20 percent of the region’s forests are now planted and focused on timber production—mainly in commercial species and with more than 55 percent owned by corporations.
The region’s area of planted pine forests increased from about 2 million acres in the 1950s to about 41 million acres in 2017 (Figure 9). The net gains in planted forests were highest during the period of strongest growth in output, and there is evidence that gains have been leveling off since the great recession. Planting represented an annual average of $0.9–1.4 billion in tree planting between 2006 and 2015 (2018 dollars, based on average planting costs). Planted pine forests have become progressively more productive, reflecting genetic improvements in planting stocks, enhanced management techniques, and shifts in product outputs.
Figure 10. Forest biomass measured as growing stock, measured in millions of cubic feet (mmcf), on timberland in the southeastern United States, 1952–2017 by hardwoods and softwoods

Forest biomass: As the productivity of planted forests increased, the harvest rates of nonplanted forests declined, leading to a more rapid accumulation of standing biomass. Biomass growth rates for both softwoods and hardwoods exceeded the accelerating biomass removals from harvesting and the amount of biomass in forests more than doubled between 1952 and 2017 (Figure 10; data source here). When production was rapidly shifting toward the region between 1977 and 1997, softwood biomass removals were roughly equivalent to biomass growth (Figure 10), but rapid investment in tree planting during this same period lifted biomass gains substantially over the next 20 years.
Figure 11. (a) diameter distribution of hardwood and softwood tree volume from 1952–2017, and (b) the resulting volume-weighted average tree diameters, southeastern United States, 1952-2017

Forest conditions. The shift toward agricultural forestry has driven changes in other forest conditions, including the size of trees. The diameters of hardwood trees increased by 24 percent between 1977 and 2017, indicating a steady aging of these species since 1977 and a strong increase in average diameter (Figure 11a and 11b; data source here). The average diameter of softwood trees also grew but at a much slower rate, reflecting the management of planted pine forests with regular harvesting and replanting. The strong increase in smallest diameter softwood trees (Figure 11a), is another indicator of a sustained increase in softwood production capacity in the region.
Figure 12. Total carbon contained in southeastern forests, 1953–2017

Forest carbon: Consistent with growth in biomass, the amount of carbon stored in southeastern forests grew by nearly 30 percent and averaged about 43 teragrams (Tg) per year between 1953 and 2017 (Figure 12; data source here). The rate of carbon accumulation dipped during the rapid increase in harvesting, but then accelerated in response to forest investments. Forest sequestration has been sustained at high levels (57 Tg/yr) since 1997.
Summary: As timber harvests more than doubled from 4 to 10 billion cubic feet, landowners in the Southeast dedicated an increasing share of rural lands to forest uses, and, in many areas, invested in an agricultural style of forestry using planted pines. Technological changes in wood products shifted demand toward smaller trees that can be grown rapidly, and changes in the technology of tree growing provided substantial growth in forest productivity. A bifurcation in forest management is apparent, with some forests used for producing small diameter softwoods with intensive management, but the majority now managed much less intensively. The result has been a steady growth in the diameters and ages of trees overall, especially for hardwood forests in the region. Growing wood product demands resulted in increased harvesting but land use and management responses to markets led to strong growth in the standing biomass and carbon content of the region’s forests.
[1] Operationally, the carbon sink is the net change in a carbon stock either in forest land or in the built environment which accounts for both sequestration and emissions of atmospheric CO2.
[2] Calculated based on information from "Inventory of US Greenhouse Gas Emissions and Sinks: 1990–2017" by the US Environmental Protection Agency and "The US forest carbon accounting framework: stocks and stock change, 1990–2016" by Woodall et al.
[3] Several studies of land use change show that relative returns to land uses affect land use choices—i.e., that increased relative values for a use are positively correlated with the area of land in that use (Lubowski et al., Kim et al.)
[4] The important variable is the value of forests relative to other land uses. Decreasing returns to alternative land uses such as crops would have the same effect as increasing returns to forest uses.
[5] Land use estimates are summaries of the NRI database aggregated as follows: agricultural land is the sum of cropland (cultivated and non-cultivated) and pasture land uses, and urban land is the sum of urban-built up and rural transportation land uses. Over this period 23 million acres of agricultural land transitioned to native cover under the Conservation Reserve Program. At its peak CRP enrollments totaled 34 million acres and has declined to current levels in response to changing caps set by Farm Bills.
[6] These include Lubowski et al for the US and Kim et al for the southeast.
[7] Based on a volumetric measure of domestic production summed across all product classes, see Table 5 in Howard and Liang).
[8] The future demand for cropland is also critically dependent on global trade.


