Can Emerging Industrial Technologies Compete? Scoping the Market Viability of Direct Lithium Extraction in the United States
This report draws on discussions with industry experts, company assessments, and financial analyses to provide insights into the technology, market forces, and policies needed for direct lithium extraction to succeed in the United States.
Executive Summary
Even as the United States rolls back renewable-energy tax incentives, global investments in clean technologies are rising (IEA 2025). This financial and industrial infusion has the potential to profoundly affect local economies. In rural southern Arkansas, for example, companies are poised to spend billions to extract the region’s lithium, filling the landscape with pipelines and wells while also injecting significant cash into the local economy. At the national level, the implications may be even more consequential; today, US supply chains for batteries—used to power everything from consumer electronics to military systems—depend almost entirely on lithium imports. In many ways, the technology the Arkansas projects plan to use, direct lithium extraction (DLE), represents the promise of a new green industrial economy that could deliver high-tech growth, economic revitalization, and climate benefits all at once.
Realizing these benefits will be easier said than done. The lithium market has whipsawed over the past five years, and for every analysis predicting that DLE will reshape global markets (Patel 2023), another warns that its commercial viability is still far from certain (Pedersen and Iqbal 2024). Drawing on conversations with industry experts, company feasibility studies, and project finance modeling, this report provides novel insights into the specific technological, market, and policy conditions that DLE would require to succeed in the United States. We take an in-depth look at three projects in the Smackover region of Arkansas—ExxonMobil’s Saltwerx, Standard Lithium’s Lanxess project, and the Reynolds Unit developed by Southwest Arkansas (SWA), a joint venture between Standard Lithium and Norway’s Equinor—as well as Anson Resources’ Paradox Project in Utah. SWA Reynolds offers particularly strong public data and is thus the focus of much of this analysis.
Resources for the Future (RFF) has identified three core challenges to market viability for DLE: price volatility of lithium, technological uncertainty, and macroeconomic factors. Regarding price, we find that lithium prices must rise well above summer 2025 levels, which were around $10,000 per tonne of lithium carbonate equivalent (LCE), See https://tradingeconomics.com/commodity/lithium to make the US projects profitable. Prices are currently in a multiyear trough, having fallen 80 percent since 2023 because of a surge in production in China (Scheyder 2025). However, this is not expected to last: Industry forecasts suggest that prices will rebound to their previous yearly average highs (~$40,000 per tonne) over the next five years, driven primarily by rising global electric vehicle (EV) demand and the corresponding increased need for batteries (IEA 2024). SC-Insights (SCI) projects an average lithium price of around $21,000 per tonne over the next two decades, well above the average of $16,000 per tonne that our modeling suggests most US projects will require to break even.
The second challenge DLE must overcome is technological uncertainty. Commercial viability of DLE depends on whether the technology can scale beyond the pilot stage. Although many developers report lithium recovery rates from brine of around 90 percent—a substantial improvement over the 40 to 60 percent from traditional evaporative ponds (Nicolaci et al. 2024) —these figures are based on controlled demonstrations and remain unproven in full-scale operations. More broadly, untested technology increases the risks of capital expenditure and operational expenditure overruns, and our modeling shows that cost overruns can quickly erode the financial viability of these projects, particularly if lithium prices do not fully recover. Finally, macroeconomic factors, such as inflation, high interest rates, or shifts in investors’ risk appetite, pose a risk for project economics. The 8 percent discount rate assumed by most US DLE companies appears reasonable under current conditions, but DLE’s early-stage status may make it particularly sensitive to increases in the cost of capital.
If US DLE projects succeed, they could create a new domestic supply chain, generate durable revenue for local governments, and bolster US competitiveness in the global battery economy. If they falter, they may serve as a cautionary tale about the risks of betting on unproven technologies in a rapidly shifting industrial landscape. This report provides novel insights into the specific price points, technological performance levels, and policy ecosystems that DLE will require to compete, and it concludes with a discussion of the broader implications of DLE for the United States and the world.
Introduction and Background
Lithium-ion batteries are essential to modern economies, powering electric vehicles, consumer electronics, and military systems. As EV adoption accelerates, global lithium demand is expected to rise by a factor of 3.5 by 2030, straining supply chains and intensifying the search for new sources of production (Lithium Harvest 2025). Yet despite these bullish long-term forecasts, lithium prices have collapsed—falling nearly 80 percent since 2023 (Dhir et al. 2025)—largely because of a surge in investment by China aimed at vertically integrating its battery supply chain (Sivaram et al. 2024). China’s government continues to heavily subsidize battery production even amid oversupply, driving global manufacturing capacity to more than 400 percent of current demand and pushing prices downward (Sivaram et al. 2024). This approach mirrors China’s strategy for other critical minerals and has slowed investment in these markets even as long-term supply risks remain elevated (IEA 2024). The United States has also taken an interventionist stance when it comes to rare earths, becoming the largest shareholder of MP Materials, a rare earth miner, in June 2025, and setting a price floor with the company for neodymium-praseodymium oxide (Kimball 2025).
One potential way to expand lithium supply is through direct lithium extraction (DLE), a technology that uses chemical processes to isolate the metal from naturally occurring underground brines. Today, roughly one-third of the world’s lithium comes from these brine sources; the rest is produced through hard-rock mining. Most brine-based operations rely to a large extent on slow, natural processing: Brine is pumped to the surface into large ponds (Figure 1), where it sits for months or even years as it evaporates under the sun and the lithium content is gradually concentrated. The resulting solution must then undergo further processing to produce battery-grade lithium.
Figure 1. Lithium Brine Evaporation Ponds at Silver Peak, Nevada
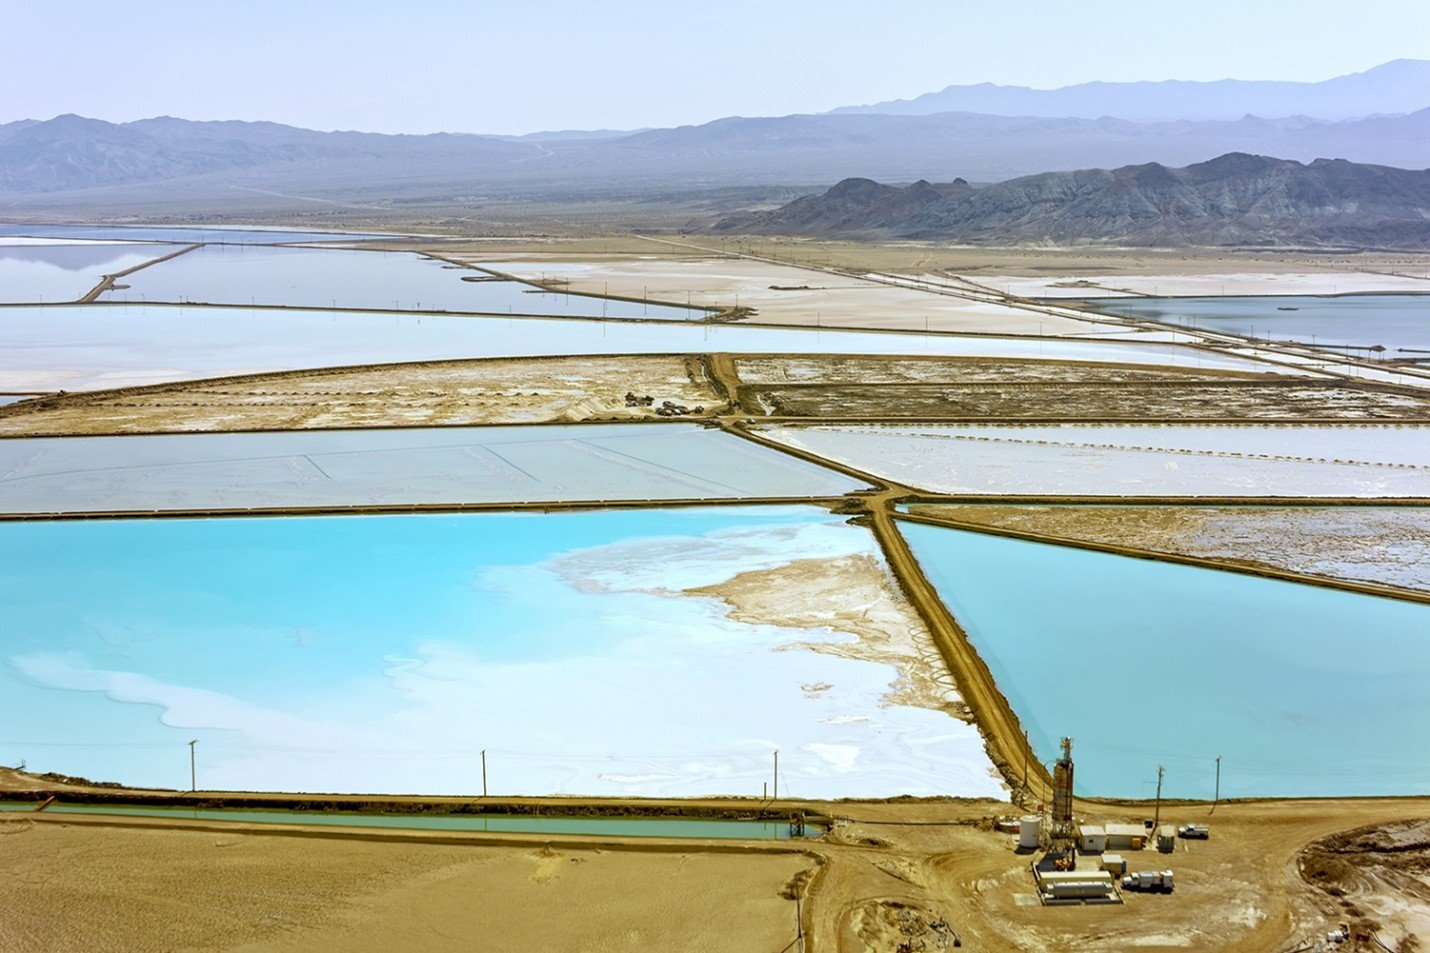
Source: Golden 2024.
DLE, by contrast, can extract lithium directly from brine within hours by using a variety of chemical methods. A typical project involves drilling wells into underground brine reservoirs, piping the brine to a central processing facility, recovering the lithium, and then reinjecting the stripped brine underground. This approach requires far less land than evaporation ponds but still involves substantial surface infrastructure—pipelines, wells, and a large industrial plant—to operate at scale (Figure 2).
Figure 2. A Direct Lithium Extraction Plant in Salta, Argentina
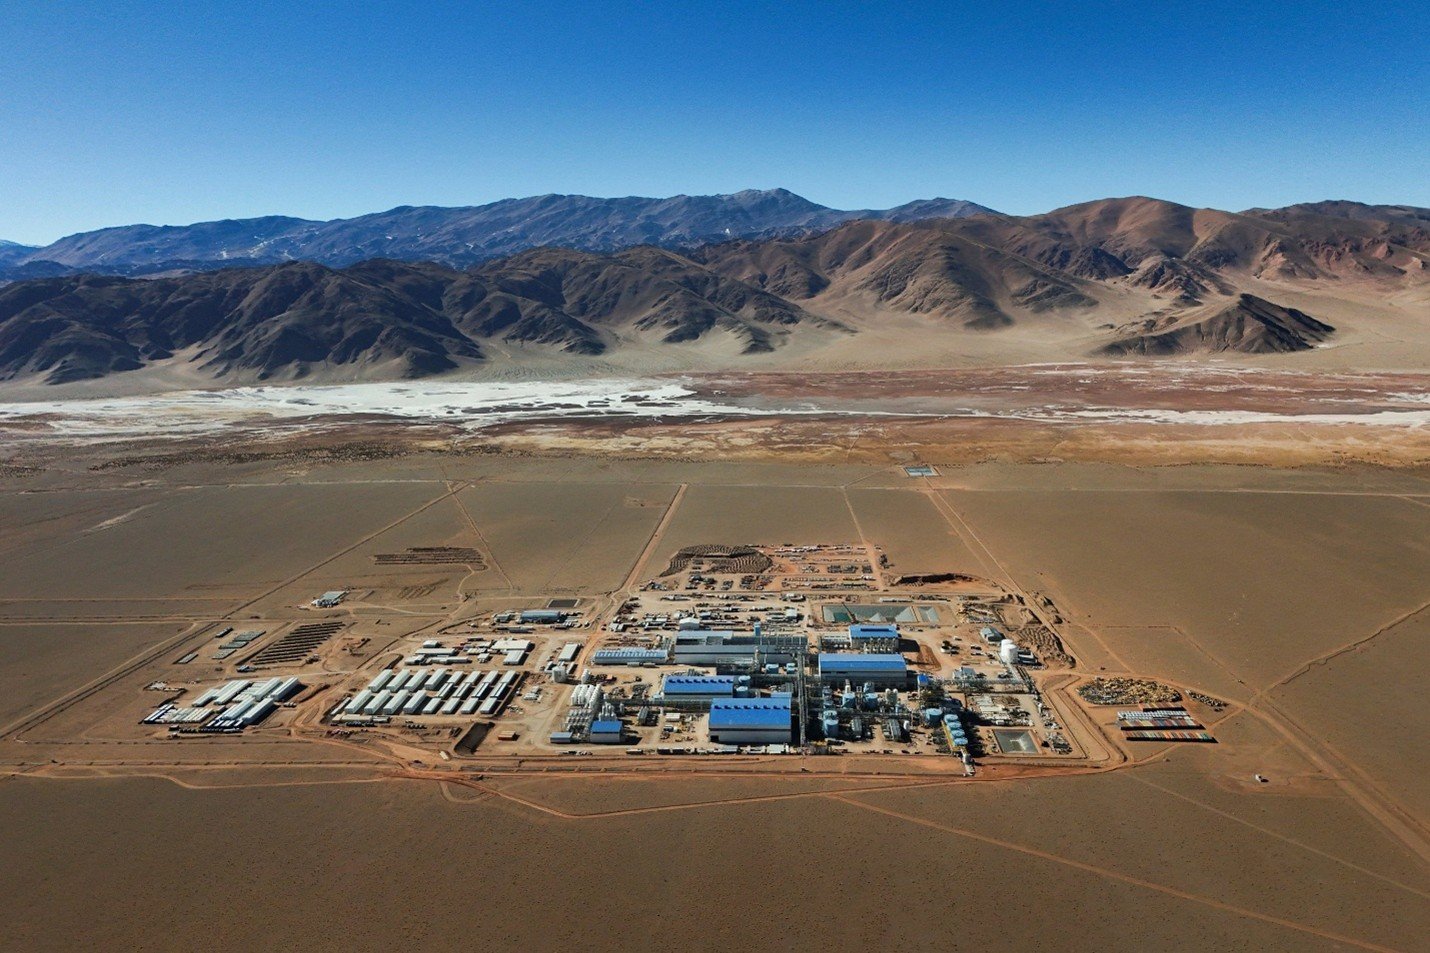
Source: Reuters 2025.
However, each brine source has a unique chemical composition that must be matched with a tailored treatment process, meaning DLE treatment in one location is not directly transferable to another. Furthermore, the four major DLE methods—adsorption, ion exchange, solvent extraction, and membrane separation—differ significantly in their chemistry and equipment. And although DLE has long been used in tandem with brine evaporation, no purely DLE plant has yet been proven at commercial scale.
Despite unresolved challenges, the race to commercialize DLE is accelerating. Projects are advancing in China, Latin America, Europe, and across North America, and DLE is expected to account for approximately 17 percent of global lithium demand in 2030, up from about 11 percent in 2024 (BloombergNEF 2024). US activity is concentrated in California, Arkansas, Louisiana, Texas, Nevada, and Utah (BloombergNEF 2024), and RFF has determined that the four projects examined in this report alone could increase domestic production from an estimated 900 tonnes per year (Energy Institute 2025) to roughly 55 ktpa Lithium carbonate equivalent (LCE)—equivalent to about 13 percent of the country’s projected LCE demand (Roberts 2024) and 10 percent of global DLE production by 2030 (Bloomberg 2024). Though significant downstream steps such as refining, battery manufacturing, and EV production must also take place before lithium extracted through DLE can meet end-use needs, even partial success of these projects could materially expand US supply and reduce dependence on imports.
The economic stakes are also significant at the state and local level. Although the majority of the employment potential of these projects will be limited to the construction phase, RFF estimates that if company estimates for revenue bear out, the projects would generate about $18 million in state tax revenue and approximately $10 million in county revenue. An additional $27 million in royalties and lease payments would go directly to private landowners. Whether these projects deliver real economic value, however, will depend on their ability to perform at scale.
The remainder of the report analyzes those questions. It is organized as follows: Section 2 discusses our data sources and assumptions; Section 3 provides an analysis of the base-case economics of DLE and explains why DLE appears profitable based on company assumptions; Section 4 tests these assumptions and conducts a deep dive into the three core challenges to project viability; Section 5 examines how policy supports could improve the competitiveness of DLE; and Section 6 concludes.
2. Data Sources and Assumptions
2.1. Data Sources
This analysis uses publicly available feasibility studies, company disclosures to government entities, conversations with relevant stakeholders, Conversations with industry stakeholders helped provide background information on DLE technology and operations. and a customized project finance model built from established industry frameworks. The inputs that will determine capital expenditures (CapEx), operating expenditure (OpEx), recovery efficiency rates, and production schedules are all sourced directly from feasibility studies and company filings. All net present values (NPVs) use an 8 percent discount rate unless otherwise noted, consistent with the assumptions stated by the companies. In project finance, the internal rate of return (IRR) is the discount rate at which a project’s net present value equals zero, and it is commonly benchmarked against a “hurdle rate” reflecting the project’s cost of capital. Companies typically publish IRRs above their hurdle rate to demonstrate that a project is expected to generate positive value. See more details in Challenge 3: Macro Factors (Section 4.3). Credit statistics are reported on an unlevered basis and do not include financing structures (loan terms, use of debt versus equity, etc.), as those terms have likely not yet been finalized between companies and investors and, regardless, will likely remain proprietary.
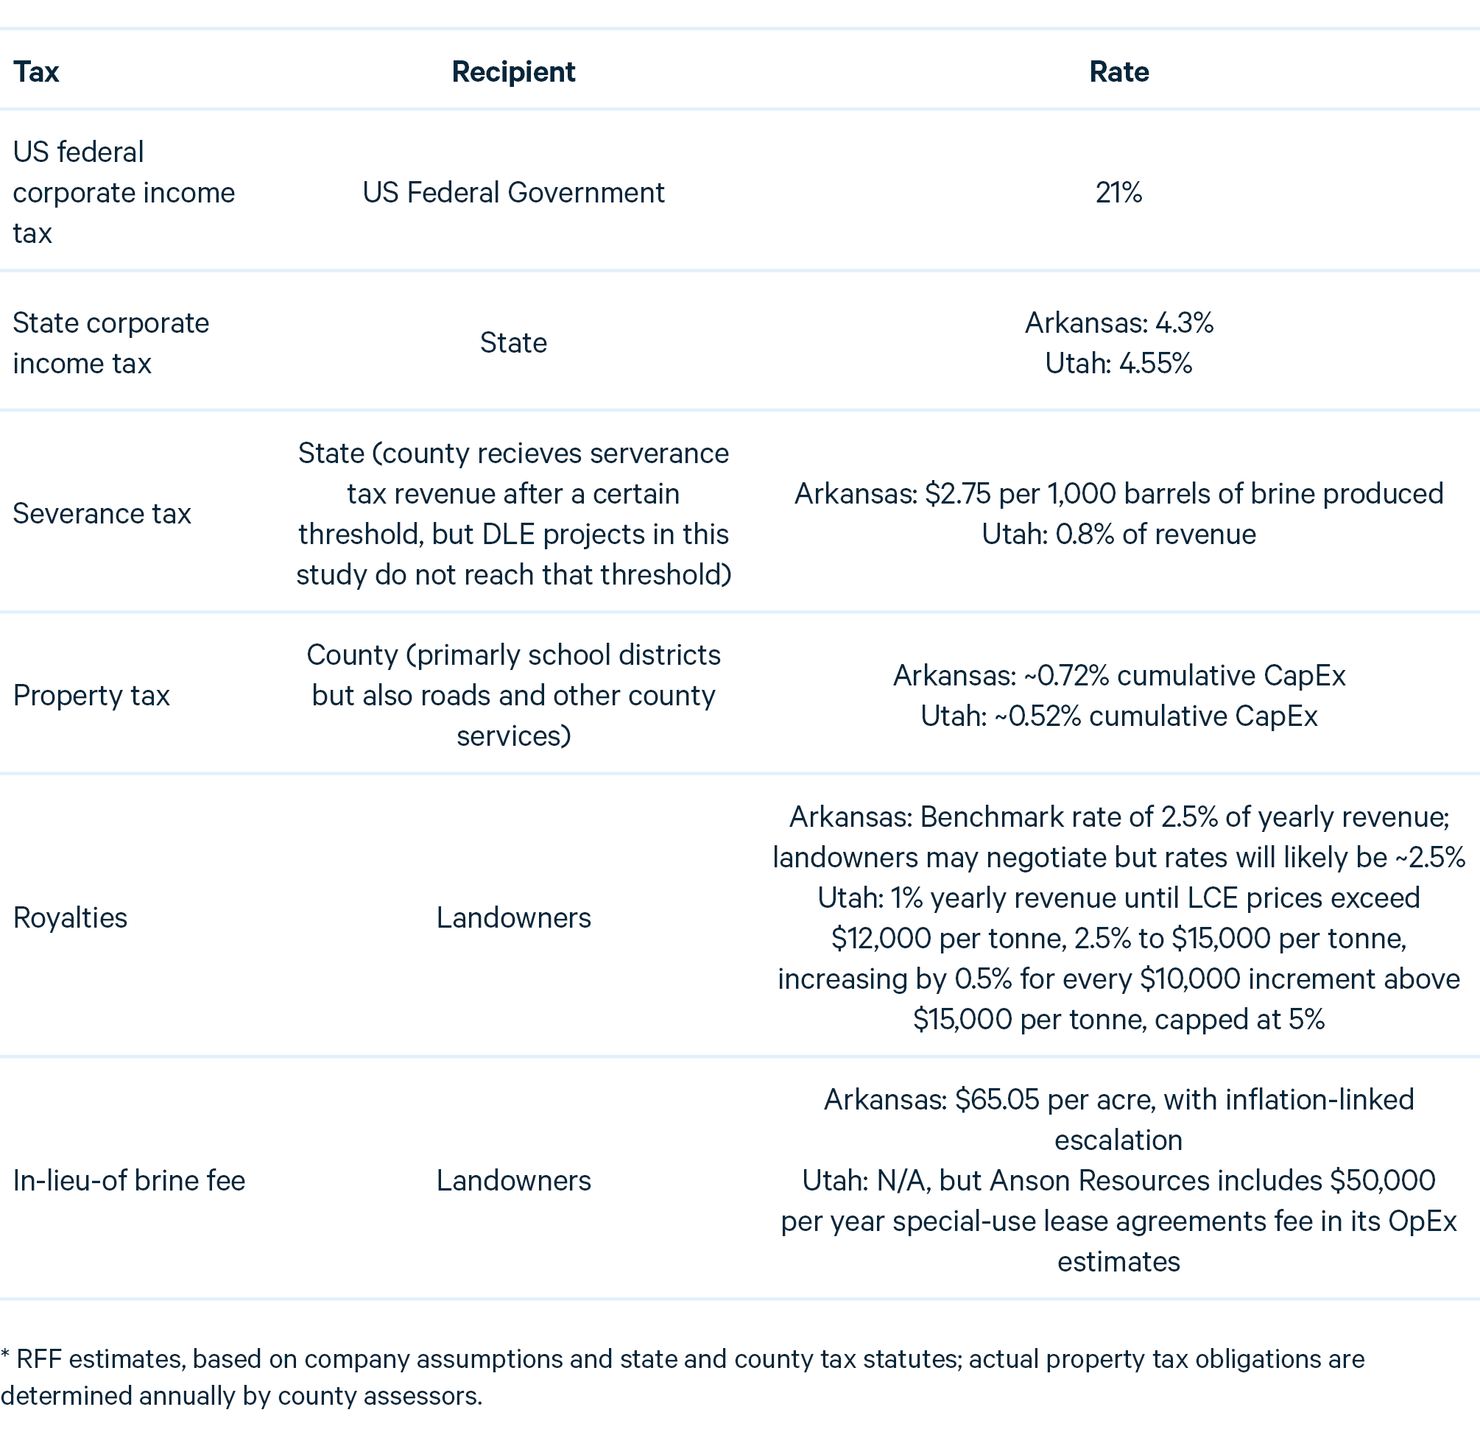
For the Arkansas projects, we applied a placeholder property tax rate based on feasibility study figures and average county-level property tax rates in the regions where projects are expected to be built of approximately 4.5 percent (Table 1). Property taxes are levied as a percentage of assessed market value, and Arkansas applies a 20 percent assessment ratio. SWA estimates market value as 80 percent of CapEx, which implies an effective property tax rate of ~0.72 percent (80 × 20 × 4.5). Although cumulative CapEx is not identical to assessed market value, we believe it is a reasonable proxy and consistent with company assumptions. Arkansas projects also will be subject to the royalty and in-lieu-of brine fee schedule adopted by the Arkansas Oil and Gas Commission in May 2024: The benchmark royalty rate will be 2.5 percent of annual revenue (though many individual brine rights owners have negotiated their own rates, which are likely to be approximately 2.5 percent), and the brine fee is a flat $65 per acre. Finally, Arkansas will charge a severance tax of $2.75/1,000 barrels of brine produced.
We used similar logic for the Utah project, Anson Resources, for which we applied a property tax rate of 1.05 percent of cumulative CapEx. In Utah, royalties follow a sliding scale: 1 percent at current lithium prices, rising to 2.5 percent above $12/kg, and increasing by 0.5 percent for every $10 increment above $15, capped at 5 percent. Utah’s severance tax appears to be 2.6 percent of its taxable value, which is 30 percent of its gross proceeds; See https://le.utah.gov/xcode/Title59/Chapter5/C59-5-P2_1800010118000101.pdf. for simplification, we modeled 0.8 percent (2.6 × 30) of its revenue.
Table 1. Taxes and Royalties Paid by US DLE Companies
2.2. Assumptions, Compared
Several important differences in the companies’ assumptions and approaches for accounting have been normalized for comparability, as explained below.
Among the projects analyzed, Exxon Saltwerx requires particular caveats. Because it has not yet published a feasibility study, we relied on its Arkansas Oil and Gas Commission royalty application, and we made several assumptions about its operations. Specifically, the application’s OpEx figure includes both depreciation and financing costs, whereas our model treats depreciation separately and excludes financing costs altogether. To make Exxon Saltwerx comparable to the other companies, we reduced Exxon’s reported OpEx by 51 percent, which is the share of OpEx that SWA Reynolds attributes to depreciation and financing. Even after our downward adjustment, Exxon Saltwerx’s OpEx per tonne ($8,722) appears to be considerably higher than the estimates for SWA Reynolds ($6,506 per tonne) and Anson Resources ($5,175 per tonne).
Additionally, because the CapEx listed in Exxon Saltwerx’s application appears limited to upstream infrastructure (piping and well facilities) rather than the full cost of a DLE processing plant, we scaled its estimate upward by 40 percent; again, this figure comes from SWA Reynolds, which projects upstream CapEx to constitute approximately 40 percent of total CapEx. This adjustment results in a comparatively high capital intensity for Exxon Saltwerx ($81,438 per tonne versus $57,605 per tonne for SWA Reynolds and $50,400 per tonne for Anson).
Beyond Exxon Saltwerx, we made additional assumptions. Standard Lithium Lanxess and SWA Reynolds report overall brine-to-product recoveries of ~92 to 93 percent. Specifically, Standard Lithium Lanxess defines “lithium recovery efficiency” as an overall brine-to-product metric: about 93.1 percent of lithium in the brine is recovered into battery-grade lithium carbonate (Li2CO3) with ~0.5 percent separate product-handling attrition. SWA Reynolds’s prefeasibility study likewise reports an overall recovery of 92 percent into lithium hydroxide (LiOH), noting small losses in LiCl purification, concentration, electrolysis, and crystallization. By contrast, Anson Resources published an initial DLE recovery efficiency rate of 91 percent and a secondary recovery efficiency rate of processing lithium carbonate from lithium eluate at 88 percent (the two recovery efficiency rates together imply a rate of ~81 percent; see Section 4, Challenge 2: Unproven Technology, below). Exxon Saltwerx has not published a recovery efficiency rate; for comparability with the other Arkansas projects, we assumed a rate of 90 percent.
Our fourth assumption concerns SWA Reynolds. SWA Reynolds’s definitive feasibility study, published in September 2025 (SWA Reynolds 2025), differs marginally in the OpEx and CapEx assumptions from company documents submitted to the Arkansas Oil and Gas Commission in April 2025. This report uses the earlier numbers, which are slightly more conservative. Additionally, SWA Reynolds has received a $225 million grant from the Department of Energy (Standard Lithium Ltd. 2025), which our model assumes will be disbursed.
Lastly, each company projects different production start dates and end dates; we decided to normalize these for ease of comparison. We model each company’s construction phase beginning in 2026, production beginning in 2028, and production continuing through 2047.
Given the assumptions made by both the companies and our modeling, this report does not definitively argue that any one company is inherently stronger or weaker. Instead, our modeling illustrates a range of possible scenarios for DLE projects in the United States:
- Standard Lithium Lanxess shows that scale is critical. Although this project has solid baseline economics, its revenues are comparatively low because it is significantly smaller (~5,000 t/year versus SWA Reynolds’s 22,500 t/year), making it highly sensitive to low prices and other downside scenarios.
- SWA Reynolds demonstrates how scale and government support produce high apparent profitability but not immunity to downside risks.
- Exxon Saltwerx illustrates how relatively high OpEx and CapEx lead to significant vulnerability to downside scenarios, despite strong profitability in the base case.
- Anson Resources highlights the resilience of a company with low OpEx and CapEx costs, even at a midsize scale of production.
3. The Fundamentals: Why DLE Looks Strong in the Base Case
Although commercial-scale DLE remains unproven, the underlying economics appear profitable, at least on paper. Despite substantial upfront capital costs ranging from $500 million to $1.5 billion, all four DLE projects analyzed in this study operate with wide buffers: operating costs are well below revenues, and each can absorb significant OpEx and CapEx overruns without erasing project value. All four DLE projects could withstand operating costs more than 1.5 times their base-case assumptions before crossing into negative net present value (NPV), all else equal. As discussed above, Anson Resources in Utah assumes lower operating costs across most line items than the Arkansas companies, and if those assumptions are borne out, the company can absorb an approximately fourfold increase in operating costs.
A closer look at SWA Reynolds illustrates the strength of US DLE projects in the base case. In the baseline scenario, the company operates at ~$6,500 per tonne OpEx and produces ~22,500 tonnes of LCE per year, with revenue at ~$20,000 per tonne. The project stays financially viable until OpEx exceeds predictions by 2.84 times (Figure 3). The blue band represents a ±25 percent range for SCI’s forecasted lithium cost curve (Figure 5), and the red line marks the zero-NPV threshold. If prices are below SCI’s projections for every year through 2047, SWA Reynolds can absorb an overrun in OpEx of approximately 1.9 times.
Figure 3. Resilience of US DLE Projects to OpEx Overruns
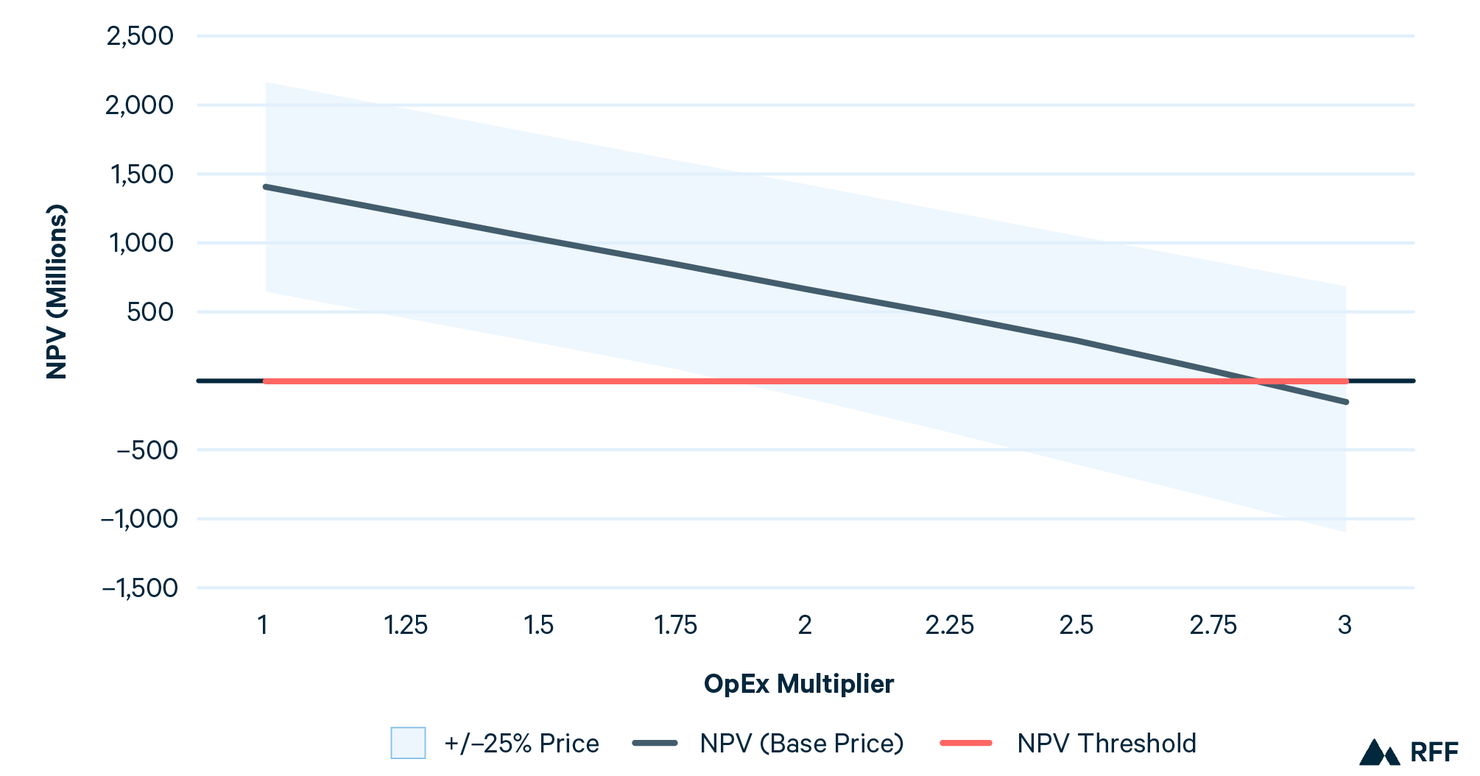
Note: SWA Reynolds remains profitable until >2.75x operation costs.
Similarly, SWA Reynolds, which is expected to have CapEx costs of ~$1.5 billion and a capital intensity of ~$55,000 per tonne, can absorb 2.5 times the projected CapEx in the base case (Figure 4). If the LCE price curve is 25 percent lower than projected, the company can absorb a ~1.75 times CapEx overrun.
Figure 4. Resilience of US DLE Projects to CapEx Overruns
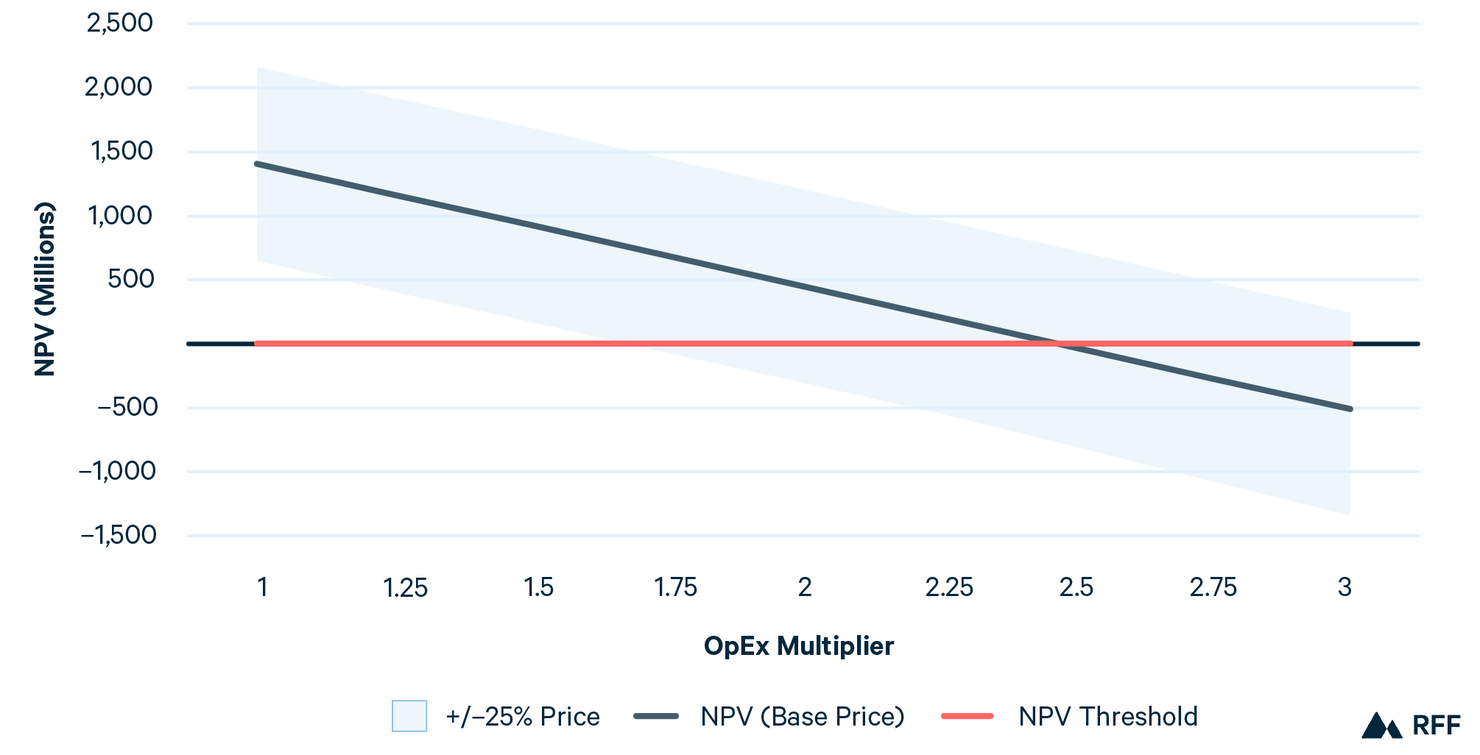
Note: SWA Reynolds remains profitable until 2.25x capital costs.
Of course, DLE will not be operating in a vacuum; it must compete with traditional lithium extraction methods. A Goldman Sachs analysis of South American projects modeled the economics of DLE under a range of hypothetical scenarios. It found that, despite higher upfront costs associated with DLE’s chemical processing, its much higher lithium recovery rate is expected to bring capital intensity roughly in line with that of evaporative ponds. The analysis also projects that DLE’s operating costs could be lower on average than those of traditional evaporation ponds (Nicolaci et al., 2023). This cost advantage could also allow DLE to outperform hard-rock mining: Evaporative brine operations already have higher operating margins than hardrock mines because, despite higher operating costs, they sell lithium carbonate rather than spodumene concentrate, which requires further processing to become a battery-grade product and therefore receives a lower price (Webb 2019). DLE also provides noneconomic benefits: It does not produce the solid waste that is created in hard-rock mining and it uses less land than evaporation (though DLE is also energy intensive and may require comparable amounts of water to evaporation [McBride et al. 2025]).
4. The Challenges
The base-case economics for DLE look promising, yet the path to profitability is far from guaranteed. Three core risks could derail even the strongest-looking projects. First, prices are highly volatile. Second, technical uncertainty looms over a process that has yet to be proven at commercial scale. Third, macroeconomic conditions—including interest rates, inflation, and capital market dynamics—can alter financing costs and investor appetite, reshaping project viability. The sections that follow examine these risks in order of their likely consequence.
4.1. Challenge 1: Price Volatility
As discussed above, lithium prices have swung from historic peaks to multiyear lows in just a few years, rapidly altering investment decisions and the economics of new projects. At current prices of approximately $10,000 per tonne, US DLE projects face strong headwinds. Figure 5 compares project values under the base case, which includes a price rebound (see Figure 6), to values if prices remain at 2025 levels through 2047. In the case of a low price scenario, all three Arkansas projects would yield negative NPVs, while the NPV of Utah’s Anson Resources would barely remain positive. In other words, the current market is well below the threshold needed to sustain the industry over the long term.
Figure 5. Net Present Value of US DLE Projects: Base Case vs. Current Prices, by Company
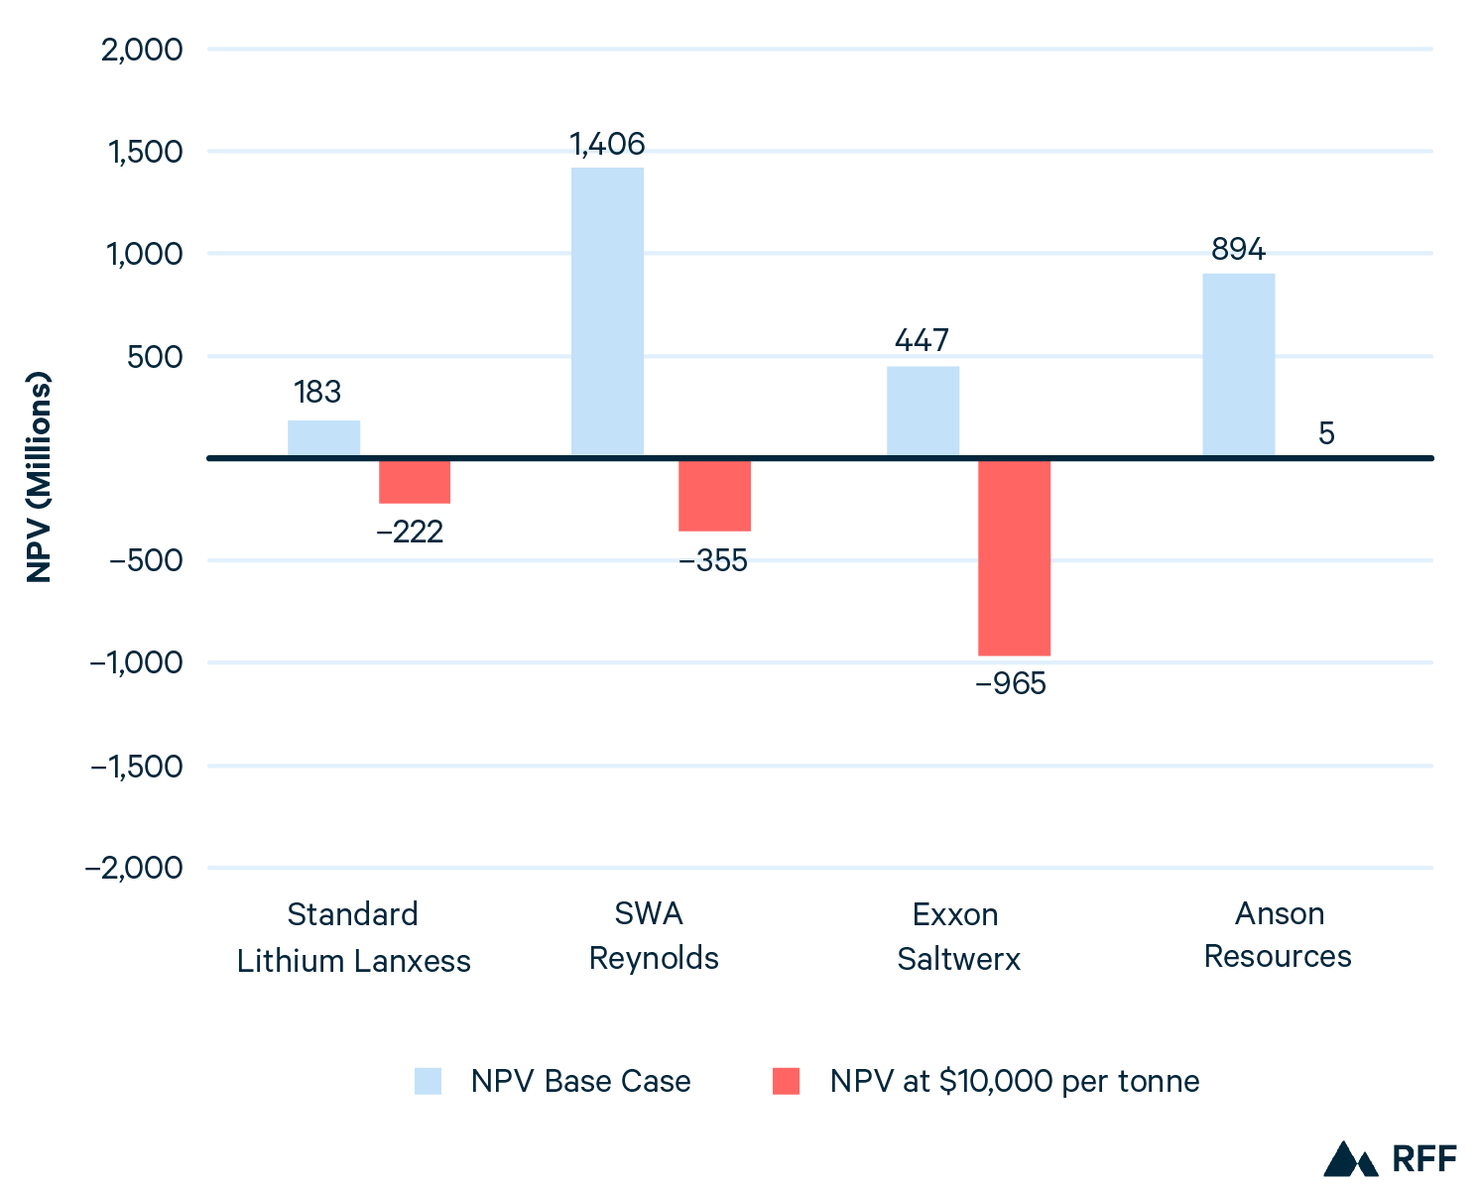
Note: Blue = SCI LCE price forecast. Red = LCE prices remain at today’s ~$10,000 per tonne through 2047.
However, a path toward recovery is foreseeable. SCI’s LCE price forecast (Figure 6) anticipates price rebounds driven by sustained EV adoption: the current price trough will extend through the near term, followed by a sharp recovery beginning in year 2027, with average yearly prices reaching $40,000 per tonne in 2030 before declining toward a long-term equilibrium of ~$17,500 per tonne.
SCI’s LCE price forecast implies an average LCE price from 2025 to 2045 that would approximate $21,000 per tonne. Our modeling identifies an average of approximately $16,000/t from 2025 to 2045 as a breakeven benchmark for the sector. This is significantly higher than projected OpEx per tonne (from $6,000 to $8,000) because breakeven prices must also cover upfront CapEx costs. It should be noted that .several projects we analyzed can accommodate lower breakeven prices, in the range of $10,000 to $13,000.
Figure 6. Historical Lithium Prices and SCI Forecasts, 2017–2045
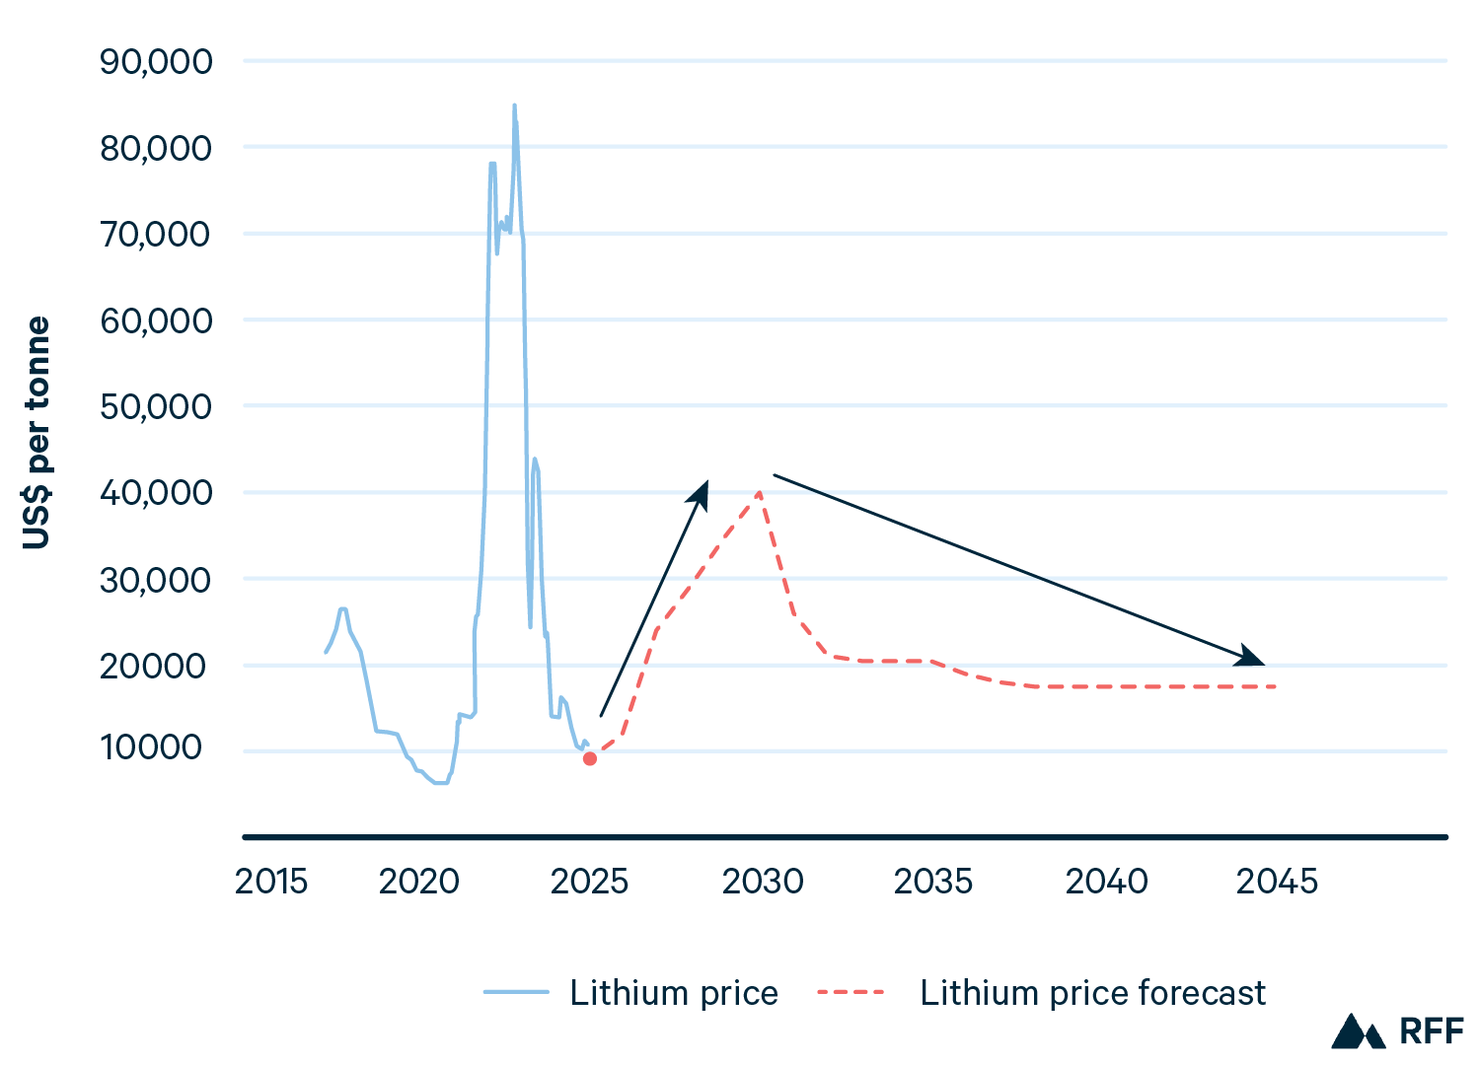
Figure 7 explores price sensitivity by applying multipliers to the entire SCI forecast curve. A multiplier of 1.0 reflects SCI’s baseline projection, and a multiplier of 0.5 means prices are assumed to be half of SCI’s forecast in every year. For example, a projected $40,000 per tonne price in 2030 would be modeled as $20,000 per tonne under the 0.5 multiplier. The companies show significant heterogeneity in their breakeven price multipliers. Anson Resources, for instance, remains viable until the multiplier falls to 0.42 (i.e., a 58 percent decline from SCI’s forecast). SWA Reynolds breaks even at 0.53, Standard Lithium Lanxess at 0.74, and Exxon Saltwerx at 0.80, meaning Saltwerx can withstand only a 20 percent decline from SCI’s forecast. However, as discussed above (Section 2b), this variation does not necessarily reflect the intrinsic strength of each project. Rather, it reflects differences in each company’s assumptions: Anson Resources appears more resilient because it assumes lower OpEx and CapEx, while Exxon Saltwerx assumes higher OpEx than the other companies.
Figure 7. Net Present Value Sensitivity of DLE Companies to Adjusted LCE Price Forests
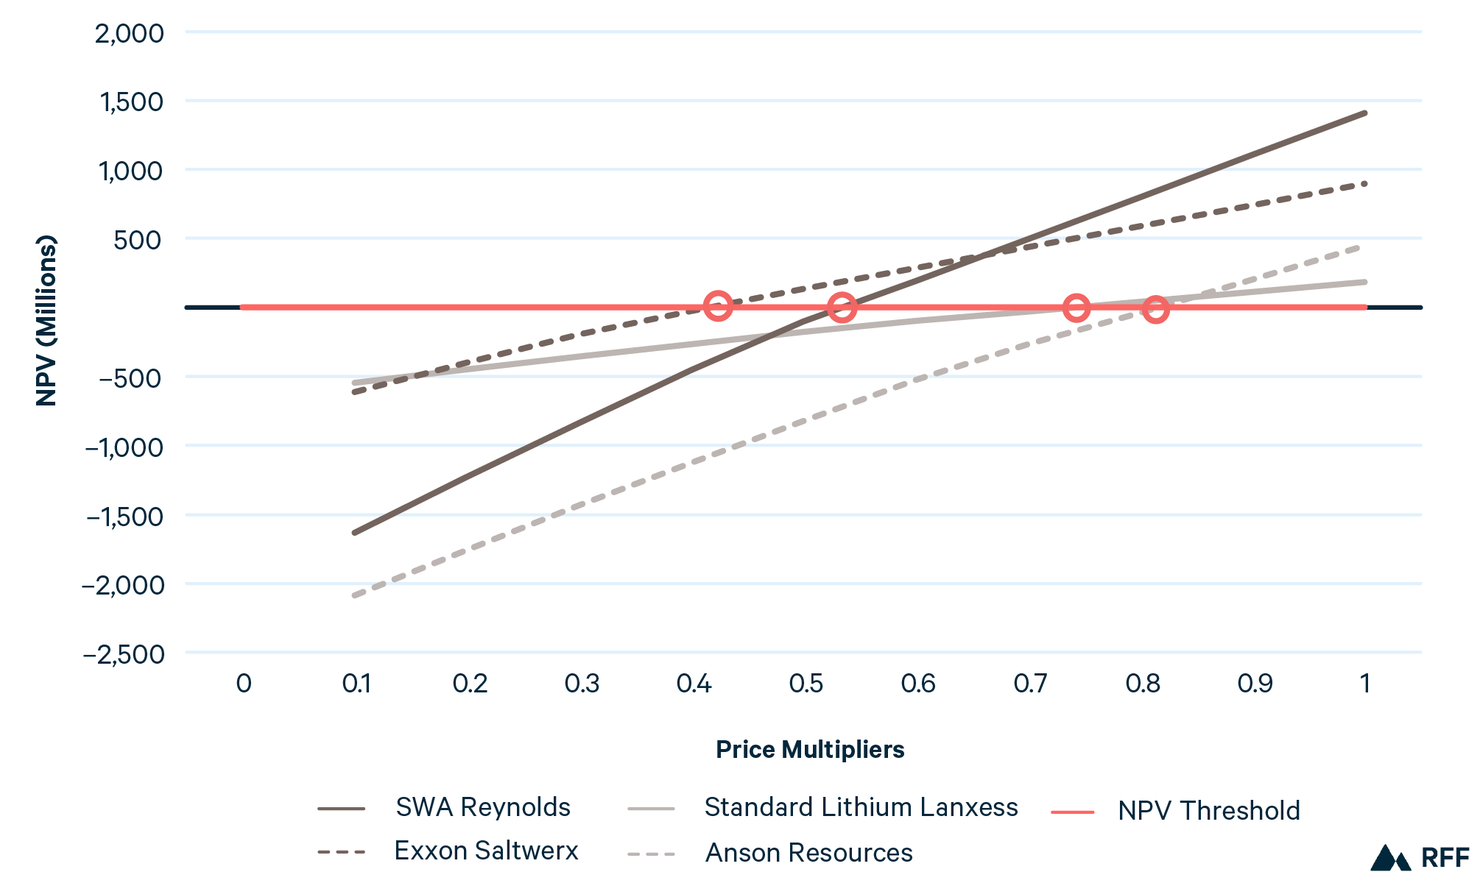
Note: Price multipliers scale the entire SCI forecast curve (e.g., 0.5 means that prices are 50% of SCI forecast in every year). Breakeven thresholds (red circles) occur at roughly 50–80% of SCI projections, with variation across projects based on cost assumptions.
Figure 7 illustrates the effect of shifting the entire SCI price curve downward; Figure 8 models how, if the price of LCE remained flat, different price levels would affect project cash flows for SWA Reynolds. If the price of LCE dropped to $8,000 per tonne and remained at that level for the next 20 years, or if it rose slightly to $12,000 per tonne, cash flows would hover near zero in most years after construction and fail to generate sufficient returns to offset initial capital expenditures. By contrast, when prices rise to $16,000 per tonne, the project succeeds, reaching an NPV of roughly $480 million, and at $20,000 per tonne, NPV exceeds $1 billion (in SCI’s base case, SWA Reynolds’ NPV is $1.4 billion). The graph makes clear that although SWA Reynolds has upside potential under a price recovery, its economics are fragile at today’s price levels. The project’s viability is therefore highly contingent on a rebound close to the $16,000 per tonne benchmark.
Figure 8. SWA Reynolds Cash Flow
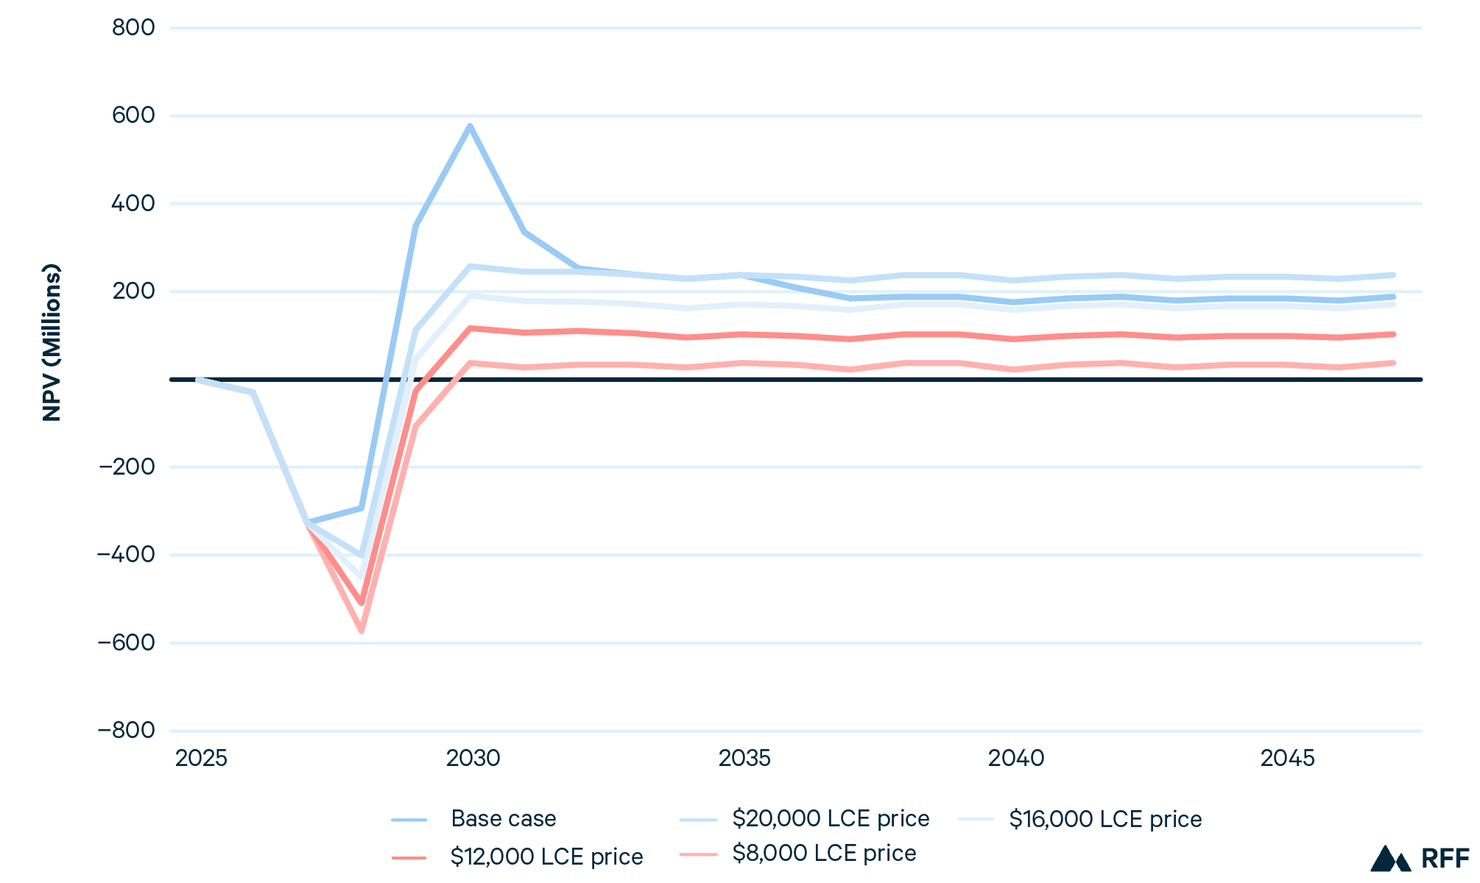
Note: To be viable, the project requires a minimum LCE price of $16,000 per tonne; its NPV is negative at $8,000 per tonne and $12,000 per tonne.
4.2. Challenge 2: Unproven Technology
Even if market prices recover, the commercial viability of DLE will depend on whether projects can achieve their assumed recovery efficiencies at scale. Recovery efficiency is more than a technical benchmark; it is a major value proposition of DLE.
As discussed above (Section 2b), we assume Anson Resources’ recovery efficiency is approximately 10–12 percentage points lower than the Arkansas projects. Exxon Saltwerx has not published a system-level recovery efficiency, so we assume a 90 percent rate and flag it as an uncertainty. However, even for SWA Reynolds and Standard Lithium Lanxess, the recovery efficiency rates are company projections informed by pilot operations rather than commercial plants. Scaling brings material risks: Full-scale operations must contend with impurity carryover, sorbent degradation, and variability in brine quality. Technologies optimized for one brine may underperform or require costly adjustments at another, so even “overall” metrics that look similar on paper can diverge in practice.
RFF’s modeling illustrates the sensitivity of project economics to those assumptions. Figure 9 plots NPV against recovery efficiency for SWA Reynolds, with the shaded band reflecting a ±25 percent price range. At base-case prices, the project is able to absorb a 35 percent recovery efficiency. However, if prices drop by 25 percent from the base forecast, the breakeven recovery efficiency requirement increases to approximately 53 percent.
Figure 9. SWA Reynolds, Net Present Value vs. Recovery Efficiency
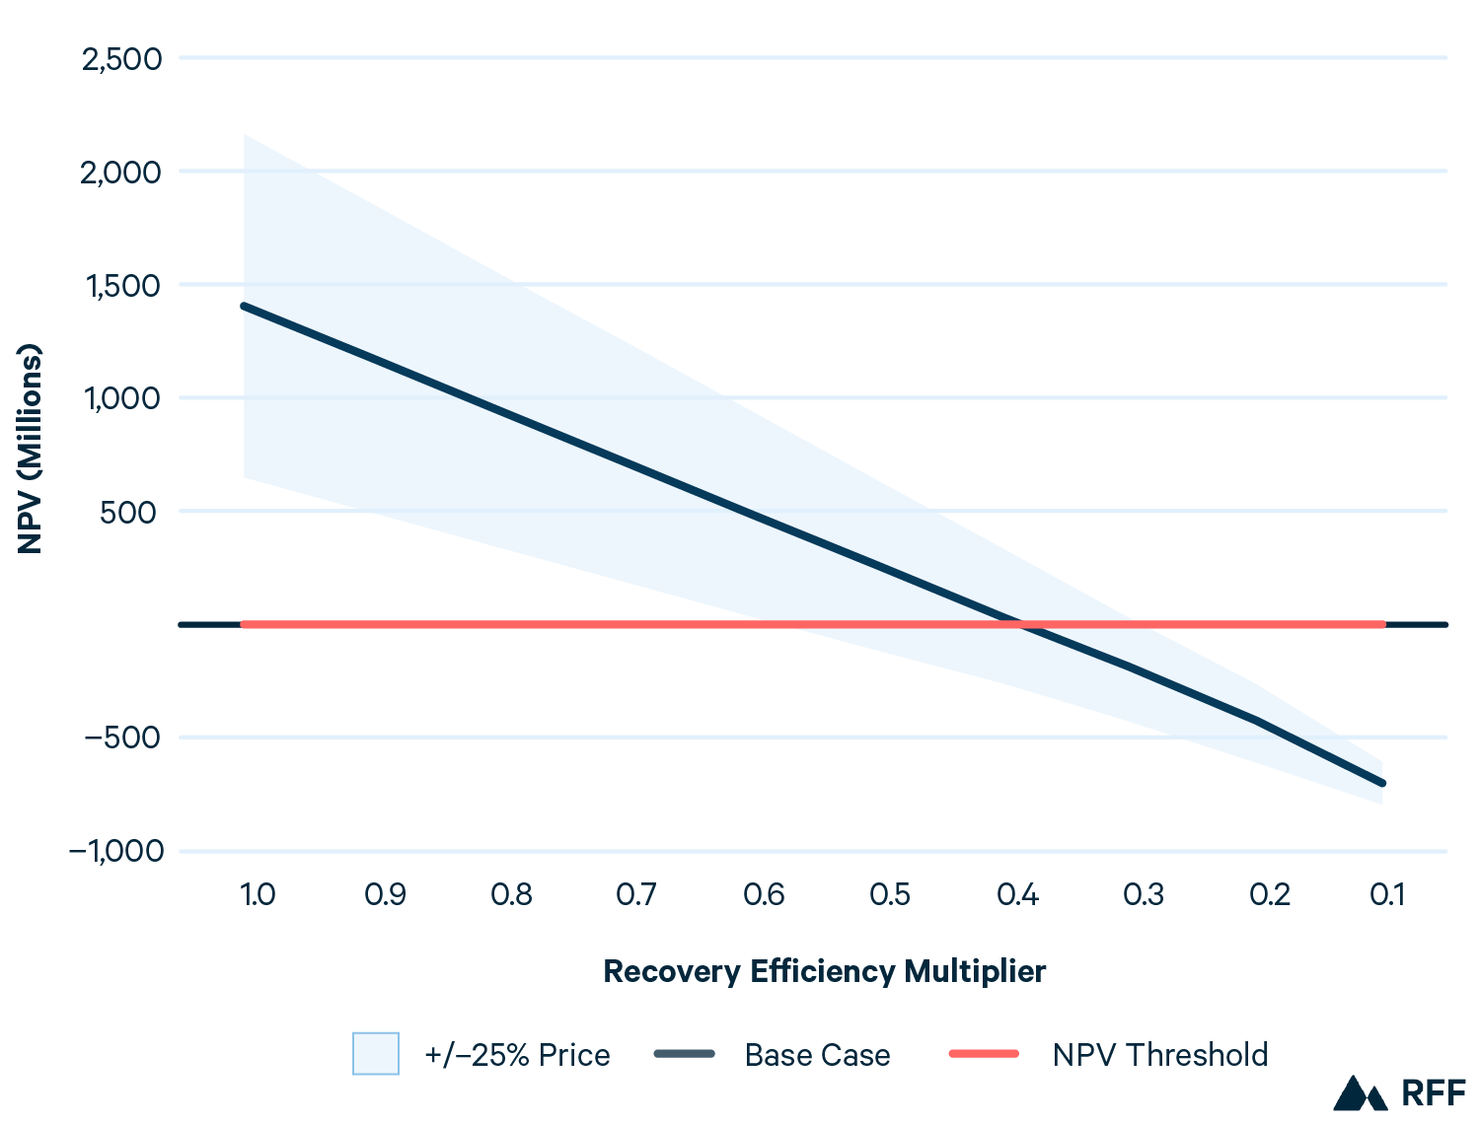
Figure 10 compares project NPVs under three scenarios: base-case recovery efficiency, a 10 percent shortfall in recovery efficiency, and a 20 percent shortfall. At a 10 percent shortfall, NPV drops sharply across the board. A 20 percent shortfall—roughly in line with Goldman Sachs’s projected lower bound of ~70 percent for DLE systems (Nicolaci 2024)—brings Exxon and Standard Lithium’s projects close to breakeven. The largest drop in dollar terms occurs at SWA Reynolds because of its size, but Exxon Saltwerx and Standard Lithium fall more dramatically as a share of value. Anson Resources, with its lower OpEx and CapEx assumptions, appears more resilient under downside scenarios.
Figure 10. US DLE Projects, Base Case vs. Downside Recovery Efficiency Scenarios
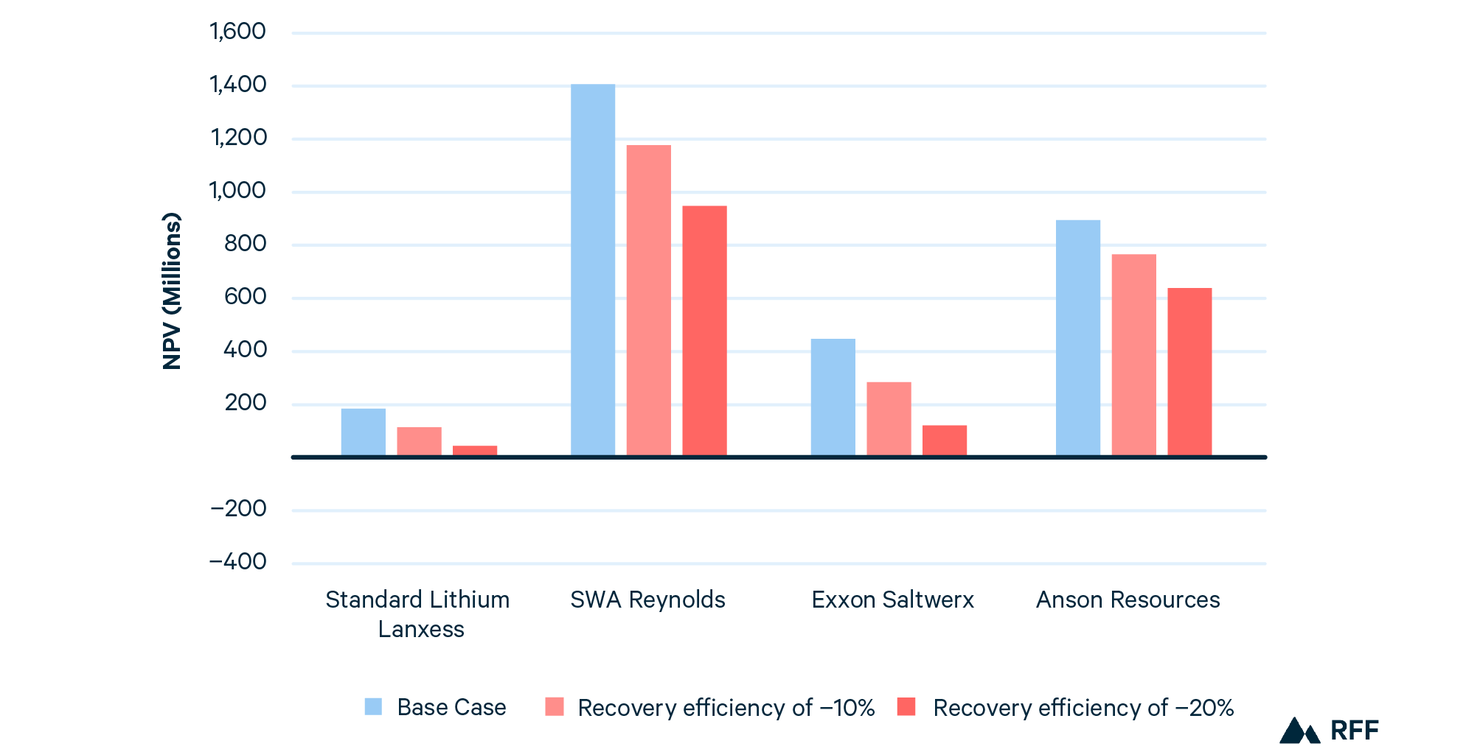
Figure 11 models what happens if projects face production and construction delays of one, two, or three years. These results show that much of the projects’ value depends on capturing the projected near-term price boom. As discussed previously, lithium prices are expected to rise from current levels of roughly $10,000 per tonne to $24,000 per tonne in 2027 and $40,000 per tonne in 2030 before falling again. Although NPV will always decline when cash flows are pushed into the future, the NPV losses modeled here are also driven by the effect of missing that temporary price surge.
Figure 11. US DLE Projects, Base Case vs. Production Delay Scenarios
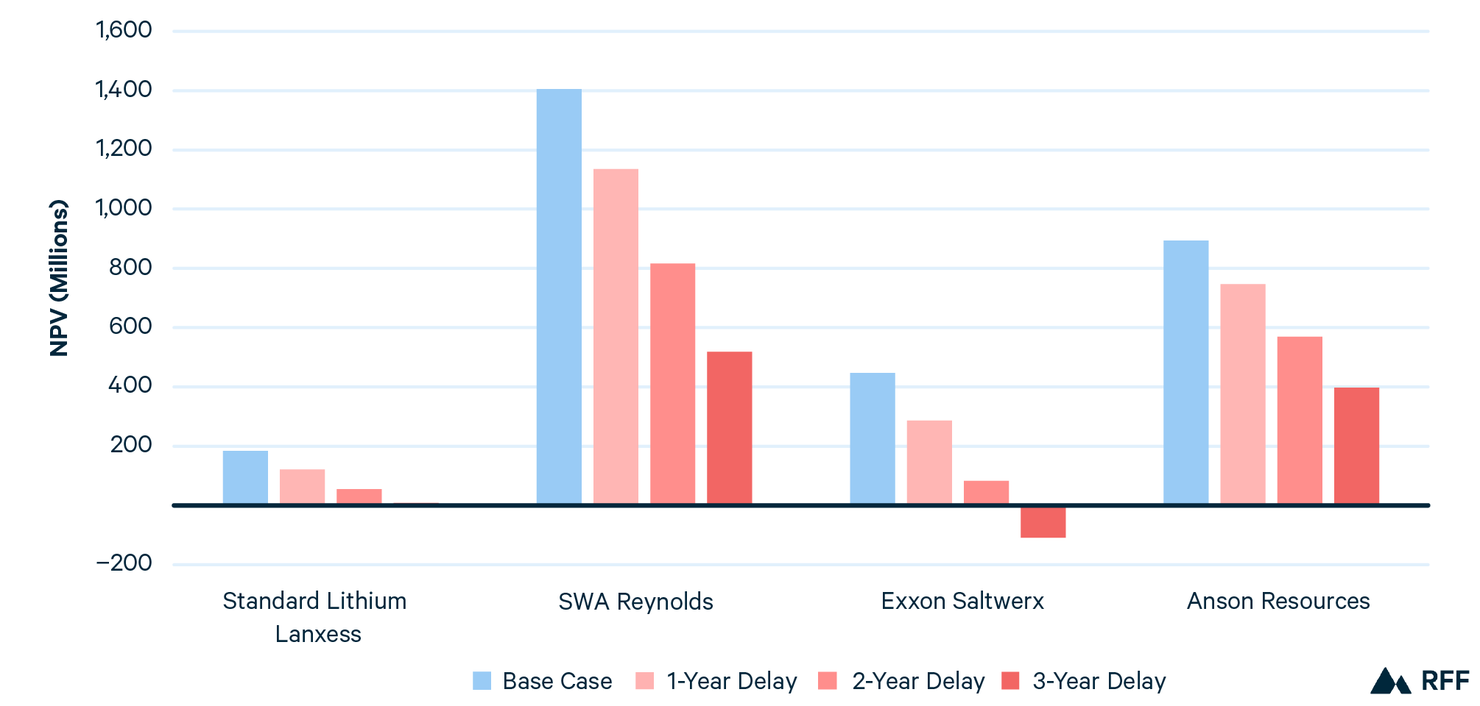
In the base case, we assume that production begins in 2028 for all projects, consistent with developers’ published timelines and the current state of permitting and pilot operations. However, if the timeline is extended, the profitability of the projects begins to fall. After a two-year delay, Exxon Saltwerx and Standard Lithium Lanxess are near breakeven, and after a three-year delay, Exxon Saltwerx dips into negative NPV. Anson Resources appears relatively insulated, retaining about 45 percent of its base-case value after a three-year delay, reflecting the company’s assumed lower capital intensity and operating costs. Even the most profitable project, SWA Reynolds, is vulnerable to modest delays: It loses more than 20 percent NPV after a one-year delay and falls from ~$1.4 billion to $518 million NPV after a three-year delay (all figures are 2025 present dollars at an 8 percent discount rate).
Importantly, the technology risks described in Figures 10 and 11 (lower-than-expected recovery efficiency and production delays) can occur in tandem and in fact are often connected, if, for example, technical challenges push production timelines back. To provide a clearer picture of how technology risks might play out in the real world, we modeled two scenarios: a setback scenario and a stress scenario. They are described in Table 2.
Table 2. Combined Technology Risk Scenarios
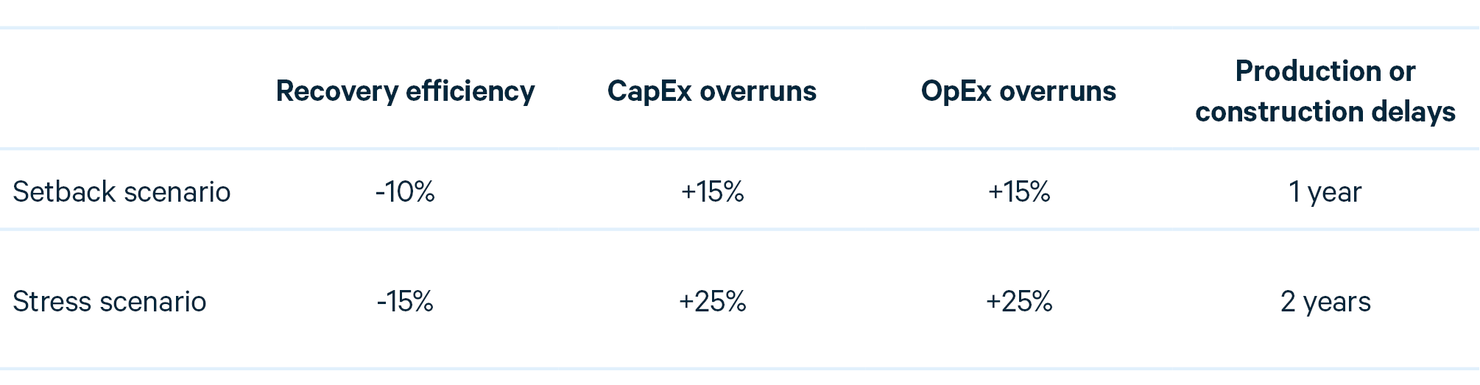
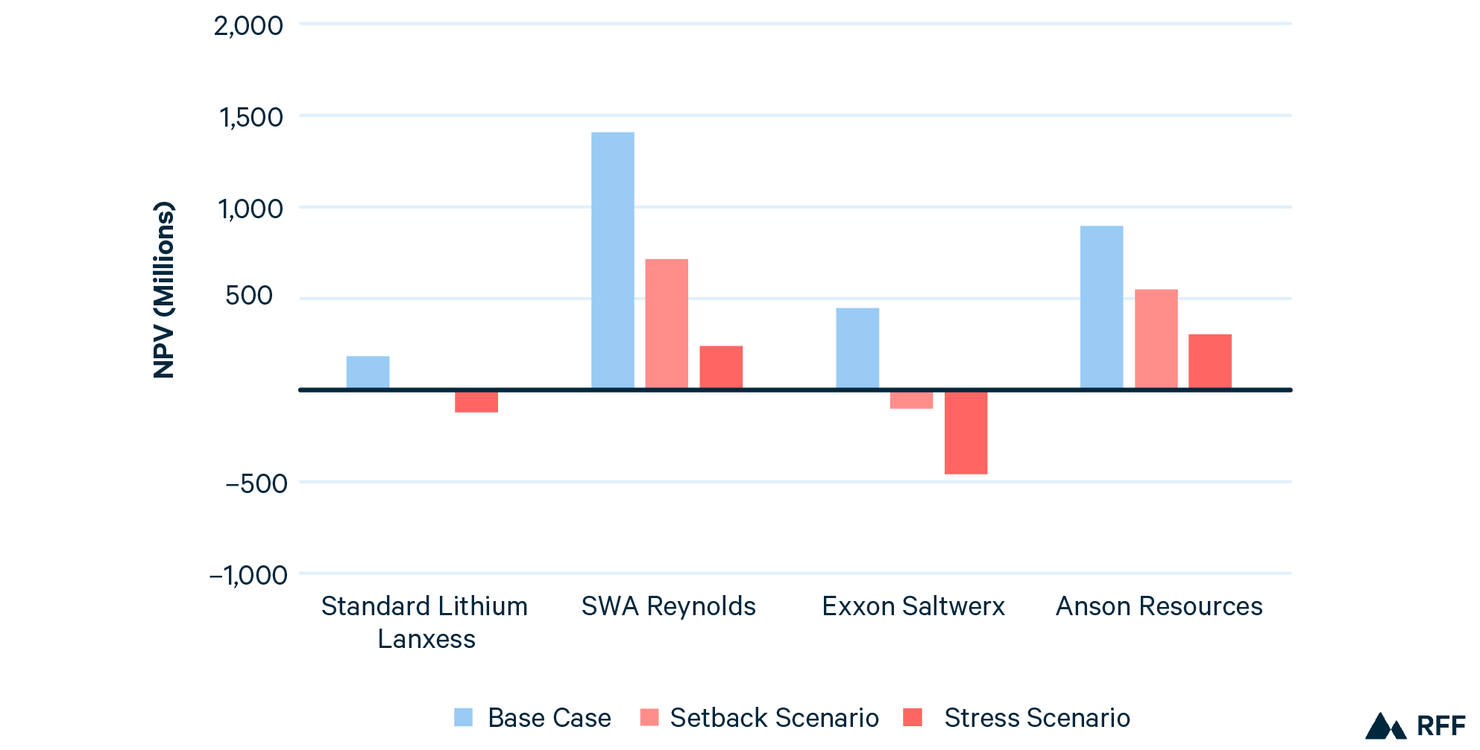
The setback scenario is not unrealistic; in fact, a McKinsey report published in 2024 demonstrated that cost overruns and production delays were not just common across most mining projects in the world but often quite large, with mines on average reaching cost overruns of 40 percent and delays of 25 percent. See https://www.mckinsey.com/industries/metals-and-mining/our-insights/the-capex-crystal-ball-beating-the-odds-in-mining-project-delivery. Indeed, a setback scenario as detailed in Table 2 would prove decisive for Standard Lithium Lanxess and Exxon Saltwerx, both of which fall into negative NPV territory (see Figure 12). SWA Reynolds, the strongest project, loses roughly half its value, falling from about $1.4 billion to just over $700 million. Anson Resources remains positive but sees its margin for error shrink substantially.
The stress scenario pushes those dynamics further. Exxon Saltwerx and Standard Lithium Lanxess fall deep into negative territory, while SWA Reynolds and Anson Resources remain viable but at roughly a quarter to a third of their base cases. Real-world drivers of the stress scenario could include sorbent degradation requiring costly replacement, inflation-driven CapEx escalation, labor shortages raising OpEx, and community opposition or regulatory disputes delaying construction by two years.
Figure 12. US DLE Projects, Base Case vs. Multivariable Scenarios of Setbacks + Stresses
4.3. Challenge 3: Macro Factors
Even if market prices and recovery efficiencies hold, project viability remains highly sensitive to the cost of capital and to broader macroeconomic conditions. In this assessment, projects are analyzed on an unlevered basis, meaning we evaluate project cash flows before financing, as final debt and equity terms are both proprietary and not yet determined. In project finance, the discount rate is applied to those cash flows to calculate NPV; it is typically chosen to approximate the project’s cost of capital and the risk premium that investors assign to technology, commodity, and policy exposure. A project’s internal rate of return (IRR) is the single discount rate that sets its NPV to zero. When companies compare that IRR against their hurdle rate—the minimum return that investors require—the outcome is clear: If the IRR is greater than the hurdle rate, NPV is positive and the project is expected to create value; if it is lower, NPV is negative and the project does not create value. Importantly, the project IRR is not the same as the realized return to any given investor. Debt providers, equity sponsors, and joint-venture partners each receive different cash-flow streams, so their individual returns will differ from the project-level IRR. Moreover, IRR is only as reliable as the assumptions that underpin it. Many feasibility studies in this field adopt an 8 percent discount rate, but most were produced in 2022–24, and in the past several years, lithium prices have decreased, raising the risk premium that investors may demand; higher US interest rates have raised the cost of debt; and potential tariffs on imported inputs and equipment could add inflationary pressure. On the other hand, 8 percent may still be reasonable for certain DLE projects, particularly those with access to concessional financing, strategic partners, or off-take agreements that lower their risk profile. Ultimately, the true cost of capital for each project will become clear only when financing agreements are finalized, and those agreements will determine whether the 8 percent discount-rate benchmark holds.
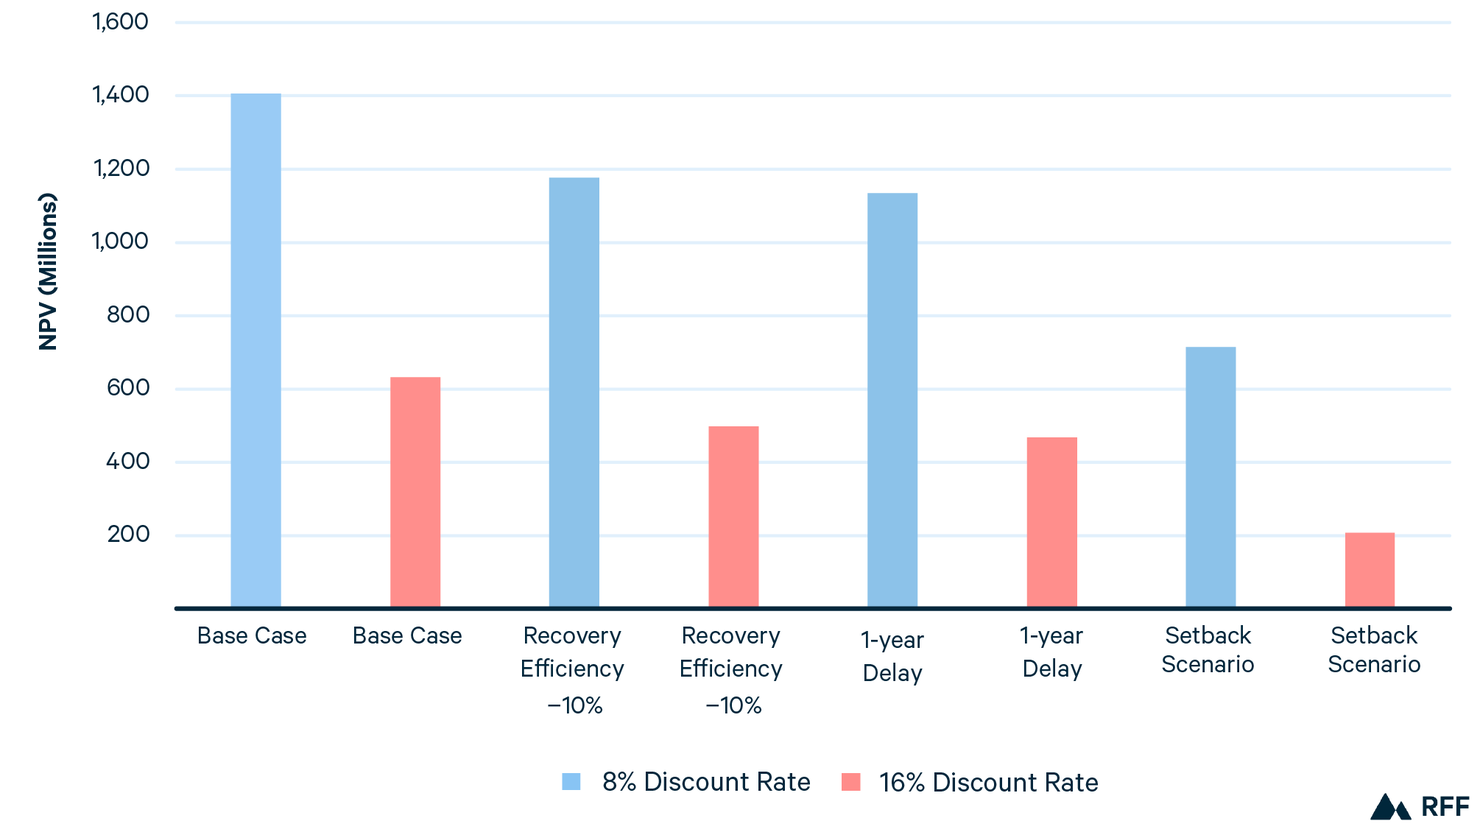
Figure 13 illustrates outcomes for SWA Reynolds under different discount rate assumptions. The blue bar shows the base case at the assumed 8 percent discount rate. Each set of pink and purple bars then takes the downside scenarios analyzed earlier—lower recovery efficiency, delays, and the multivariable setback scenario—and applies both an 8 percent and a 16 percent discount rate. Conceptually, moving from 8 percent to 16 percent reflects a world in which the project’s required return is twice as high to compensate for higher risks—regardless of whether these emerge due to lithium price volatility, uncertainty about unproven technology, or higher interest rates raising the cost of debt. The comparison makes clear how powerful the cost of capital itself can be: A one-year delay that still leaves SWA Reynolds more profitable than other DLE projects becomes far more consequential at 16 percent. Simply doubling the discount rate on the base case erodes more value than the setback scenario does at 8 percent. Under the setback scenario, which was already challenging, applying a 16 percent discount rate leaves the project with an NPV of about $200 million, a fraction of its $1.4 billion base case.
Figure 13. SWA Reynolds, Tech Underperformance Scenarios at 8% and 16% Discount Rates
5. Policy Interventions
The analysis above highlights how market volatility and technical uncertainty can erode project economics. If US policymakers conclude that building a domestic DLE industry is a strategic priority—as discussed previously, these four projects alone could account for nearly 10 percent of US lithium demand by 2030—the question becomes which policy tools could meaningfully shift project economics. This is especially important to analyze under a scenario where technology risks and market factors create headwinds for the companies.
Figure 14 compares project NPVs across four scenarios: base case, the downside spiral, and two sets of policy interventions in the setting of a downside spiral (Table 3).
Table 3. Policy Interventions and Downside Spiral Scenario
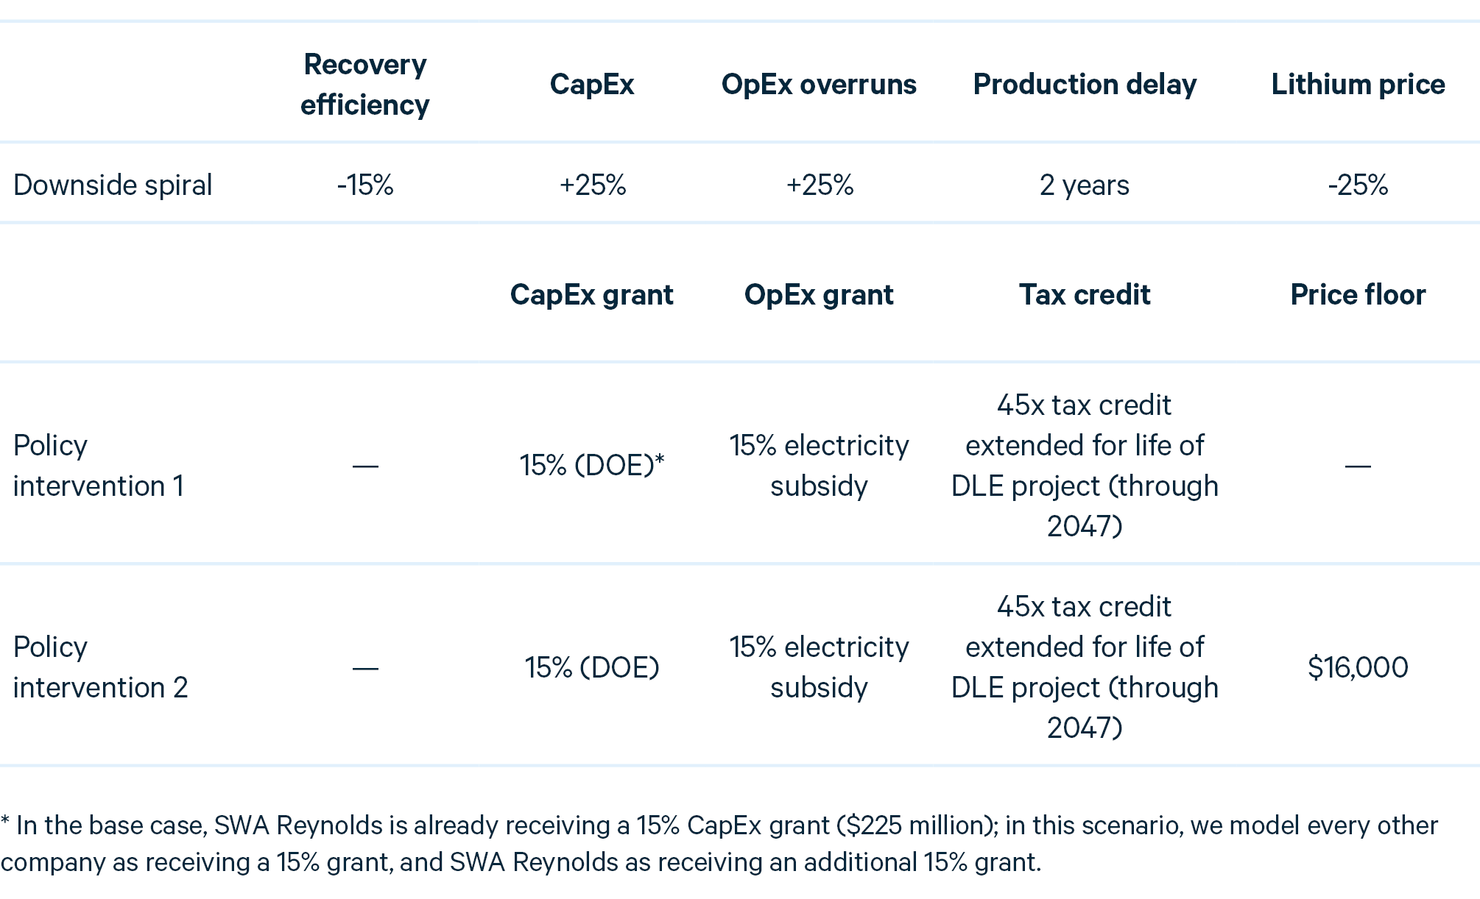
Figure 14. US DLE Projects, Effectiveness of Policy Interventions
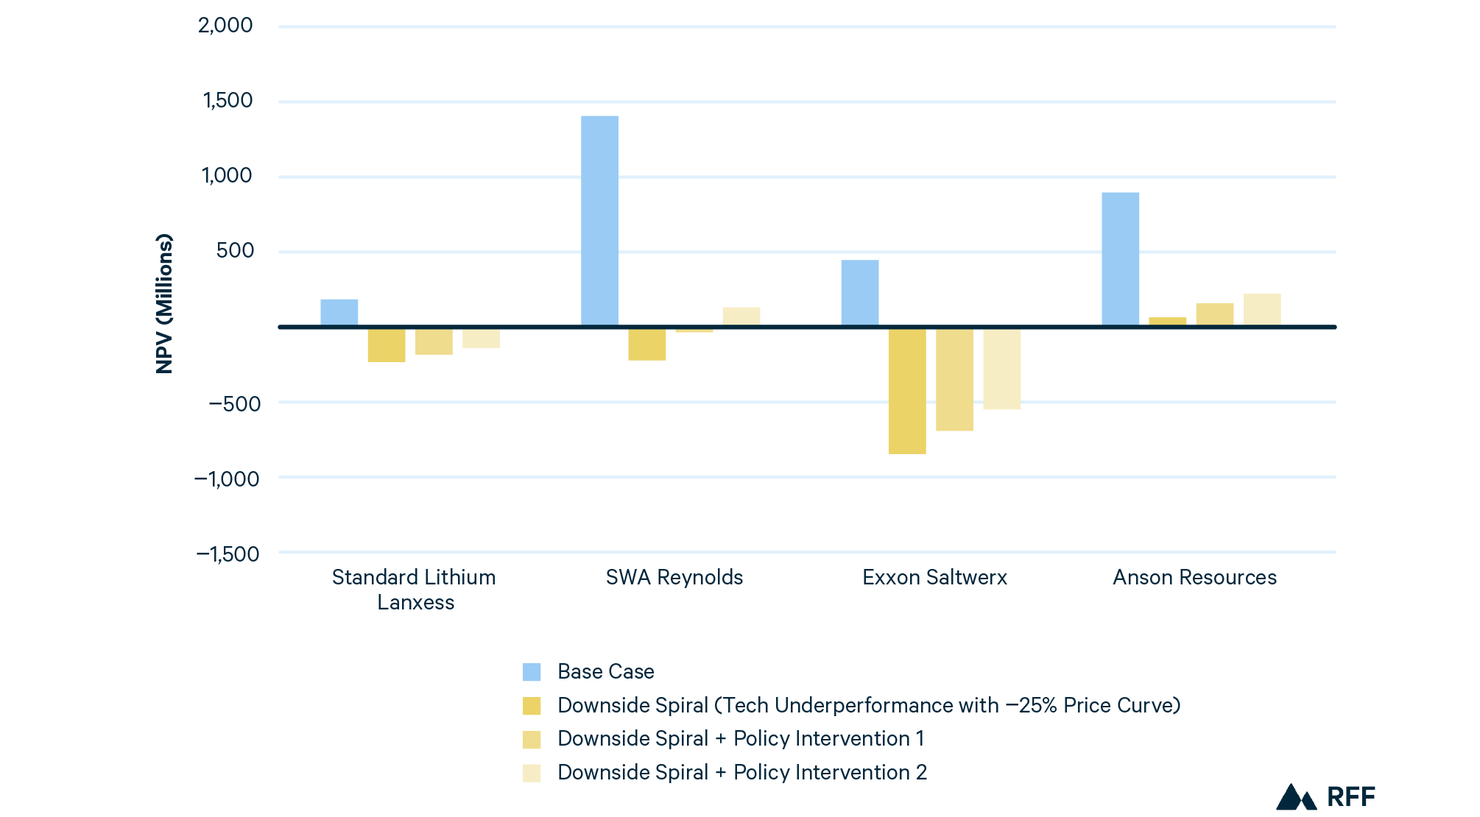
Under the downside spiral, only Anson Resources remains positive, reflecting its unusually low-cost assumptions and modest scale (~10,000 tonnes of LCE per year). Policy intervention 1 improves outcomes for all projects at the margin but does not move most projects into positive territory. Even SWA Reynolds, which starts with the largest base-case NPV, remains negative under this package. However, adding a $16,000 per tonne price floor on top of the other policy interventions has a larger effect, shifting SWA Reynolds into profitability and adding ~22,500 tonnes of domestic LCE production (relative to a scenario with no price floor). Yet Exxon Saltwerx and Standard Lithium Lanxess remain underwater even with the price floor, underscoring our finding that although policy can mitigate downside risks, it cannot fully overcome weak fundamentals.
This illustrates the trade-off inherent in price floors. A price floor guarantees revenue regardless of market conditions, which makes it uniquely powerful in preventing project collapse. But it also removes much of the efficiency filter that market forces apply. In the example above, a $16,000 floor rescues SWA Reynolds even if technical performance and cost control underperform. By design, a floor rewards output without discriminating between efficient and inefficient operators. From a policy perspective, that provides certainty but also risks locking in support for higher-cost projects.
Table 4 shows the fiscal implications of different price floor levels in a scenario where market prices fall by 50 percent (but the other downside spiral conditions do not apply). At a $10,000 floor, only Anson Resources is viable, producing an average of 8,842 tonnes per year. The fiscal cost of this policy is around $82 million in nominal terms ($39 million in present value) over the modeled horizon (through 2047). The effective subsidy is modest, averaging $463 per tonne produced in nominal dollars ($222 in present value). This also shows how fiscally challenging maintaining a price floor is, when prices are set internationally. If market prices end up being lower than expected for a greater number of years, the fiscal cost of a price floor can quickly balloon.
Table 4. Fiscal Cost of Price Floors
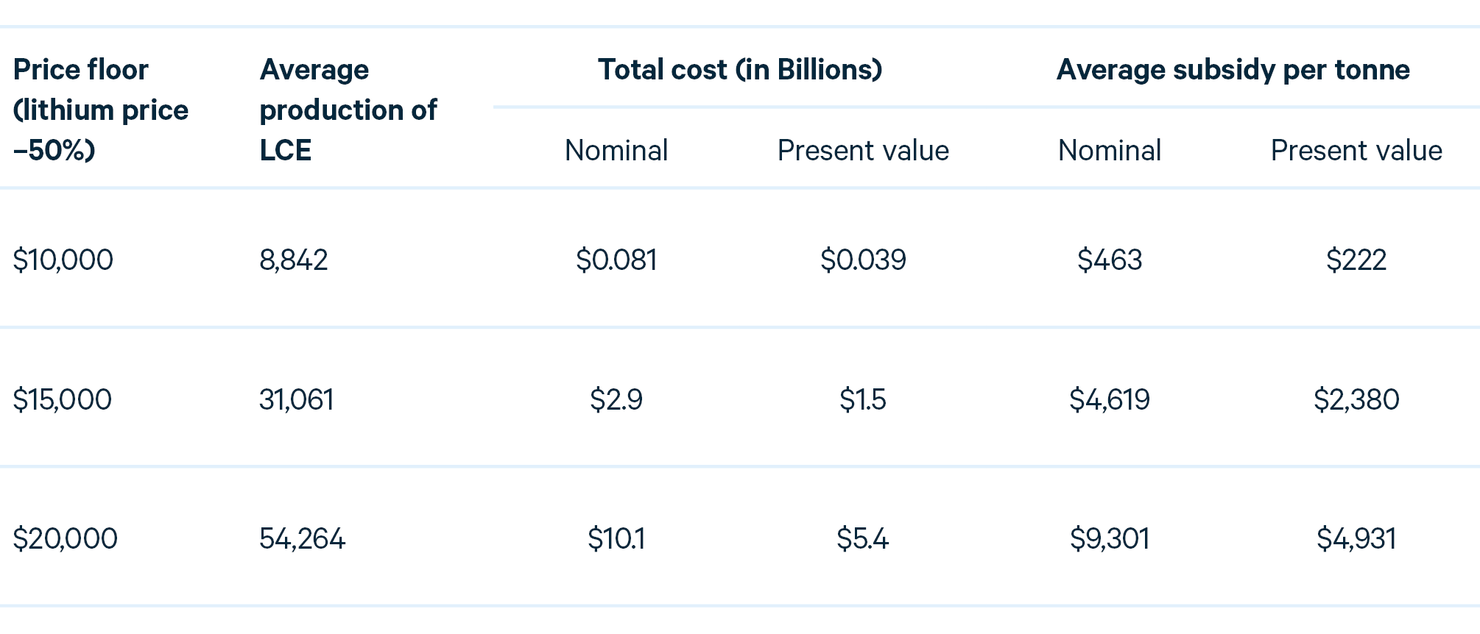
At a $15,000 per tonne floor, additional projects become viable, raising average production to 31,061 tonnes per year. But this comes with a sharp fiscal expansion: $2.9 billion in nominal terms ($1.5 billion in present value), with the average subsidy rising to $4,619 per tonne ($2,380 in present value). A $20,000 per tonne floor brings all four projects into operation, lifting output to 54,264 tonnes per year. The fiscal costs rise along with production to more than $10 billion in nominal dollars ($5.3 billion in present value), equivalent to an average subsidy of $9,301 per tonne ($4,931 in present value).
6. Conclusion
Direct lithium extraction is emblematic of both the promise and the limits of green industrial policy. Our modeling shows that projects like SWA Reynolds could establish a strong domestic lithium industry if market conditions improve and company cost assumptions hold, or if targeted policy support is enacted. In base-case scenarios of market performance, SWA Reynolds achieves an NPV of ~$1.4 billion, and even under downside scenarios it remains comparatively resilient. Yet project viability hinges on factors largely outside a single company’s control: commodity cycles, technological effectiveness, and the cost of capital. Stress tests reveal that setbacks compound quickly. Modest shortfalls in recovery efficiency or delays in construction can easily wipe out value.
For policymakers focused on encouraging the sector’s growth, this begs both optimism and caution. Industrial policy tools can reduce risk through price floors, concessional loans, and tax incentives, but these come at significant fiscal cost. For example, raising the price floor from $15,000 to $20,000 per tonne (which we find to be the most effective policy for supporting all analyzed projects) boosts average output from ~31,000 to ~54,000 tonnes per year but increases total subsidies more than threefold. Furthermore, price floors risk supporting inefficient projects when cheaper minerals could be imported without large fiscal costs. However, local communities stand to benefit through property and severance taxes, which rise with capital expenditures and persist even in downturns, offering a rare measure of stability in a volatile sector. Thus, the federal government will need to weigh the trade-offs of high fiscal costs and the risk of supporting inefficient projects versus the industrial policy and economic development goals that these projects can achieve. DLE thus captures the central tension of the new green industrial economy: It promises strategic security, climate alignment, and rural revitalization, but only if policy can balance the high cost of derisking with the imperative of building durable, equitable supply chains.