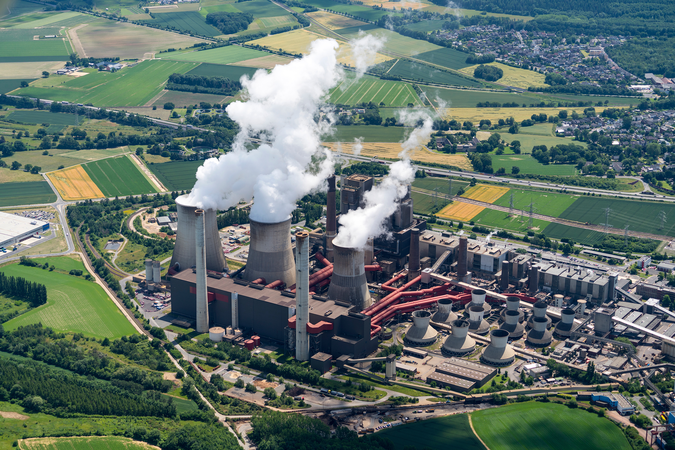
Friendshoring the Battery Supply Chain: Are the New Regulations Feasible?
This report assesses the extent to which the supply chain for lithium iron phosphate batteries can be friendshored, reducing the United States’ reliance on Chinese supplies.
Abstract
Lithium iron phosphate batteries are important for storing intermittent renewable electricity and powering electric vehicles. This report assesses the extent to which the battery supply chain can be “friendshored,” now that clean energy tax credits are subject to stringent limits on involvement of “prohibited foreign entities.” This is not simply a matter of where materials are sourced: the regulated battery inputs also include manufacturing equipment, intellectual property, and technology licensing. The requirements are most problematic for the “midstream” segment of the supply chain—the processing of extracted critical minerals. “Upstream” (mineral extraction) and “downstream” (manufacture of battery components) inputs are less likely to be constrained. To be compliant, manufacturers must find new sources, scale up investment, and reduce dependence on technologies developed by prohibited foreign entities. Scenario analysis indicates that the supply chain is unlikely to be sufficiently friendshored before costly restrictions are triggered. Compliance timelines should reflect industrial realities in the sector.
1. Introduction: The Strategic Constraint Problem
Development of reliable, safe, and affordable batteries is a key part of the global transition toward clean energy technologies. Among different battery technologies, lithium iron phosphate (LFP) batteries figure prominently in the transition. The abbreviation is derived from the chemical content: Lithium, Ferrum (iron), and Phosphate. Cobalt-free, thermally stable, and cost-competitive, LFP represents the dominant chemistry for utility-scale grid storage, a growing share of electric vehicle (EV) batteries, and an important component of the data center infrastructure supporting US artificial intelligence capacity. By supporting decarbonization of vehicle transportation, increased battery use also reduces dependence on volatile petroleum markets (Walter et al. 2026). Globally, EV sales rose around 20 percent in 2025 (Lester and Bostock 2026). By 2030, global LFP battery demand is projected to hit 4.7 TWh, nearly seven times 2022 levels (Statista 2026a).
However, the supply chain for increasing LFP supplies remains heavily concentrated in China. In recent legislation, the United States has implemented policies to reduce dependence on critical mineral–related supply chains dominated by so-called prohibited foreign entities (PFEs), which include China. Whereas the 2022 Inflation Reduction Act included production and investment tax credits to create incentives for domestic manufacturing and allied-nation sourcing (Buffie 2026), the 2025 One Big Beautiful Bill Act (OBBBA) tightened the supply chain compliance framework by introducing restrictions on tax credits for clean energy (IRA Tracker n.d.). Manufacturers must now demonstrate that the share of inputs traceable to PFEs falls below a defined threshold, measured by the “material assistance cost ratio” (MACR). Section 70512 of the OBBBA (Public Law 119-21 formally defines PFE and MACR (https://www.govinfo.gov/app/details/PLAW-119publ21). The definition of PFE in the OBBBA amended 26 U.S. Code § 7701 (https://www.law.cornell.edu/uscode/text/26/7701). “Material” in the MACR definition refers to the relevance of potential connections with PFEs in determining eligibility for tax credits, not to physical material. As explained in the next section, the MACR is not simply a geography test. It is a function of cost structure, contractual relationships, and technological control. Understanding its implications requires examining its mechanics, the entities it targets, and the thresholds that progressively tighten through 2030 (Benchmark Minerals 2026).
The challenge is that China is involved across the LFP battery supply chain. Chinese firms dominate activities ranging from raw material processing and cathode production to graphite anode manufacturing and the specialized equipment on which battery manufacturing depends. As a result, satisfying MACR thresholds requires more than finding different sources for particular minerals or components. Manufacturers must navigate and, in some cases, restructure the technology agreements, equipment sourcing, processing relationships, and other arrangements through which PFE involvement enters the production of a finished battery cell.
This report assesses whether an MACR-compliant, friendshored LFP supply chain is achievable for the United States, and under what conditions. Section 2 explains the MACR framework and its compliance mechanics. Section 3 maps the LFP supply chain against that framework, identifying where PFE exposure is most concentrated. Section 4 examines four types of constraints that determine whether diversification is achievable. Section 5 develops three scenarios that trace how different combinations of policy, investment, and industrial capacity shape could compliance outcomes through 2030. Section 6 draws out the policy implications for building resilient, MACR-compliant LFP supply chains. We find that feasibility depends less on access to raw materials and more on midstream processing capacity, technological dependence, and timing—challenges that firms will find difficult to surmount given the current pace of investment in the LFP supply chain.
2. The Supply Chain Compliance Framework
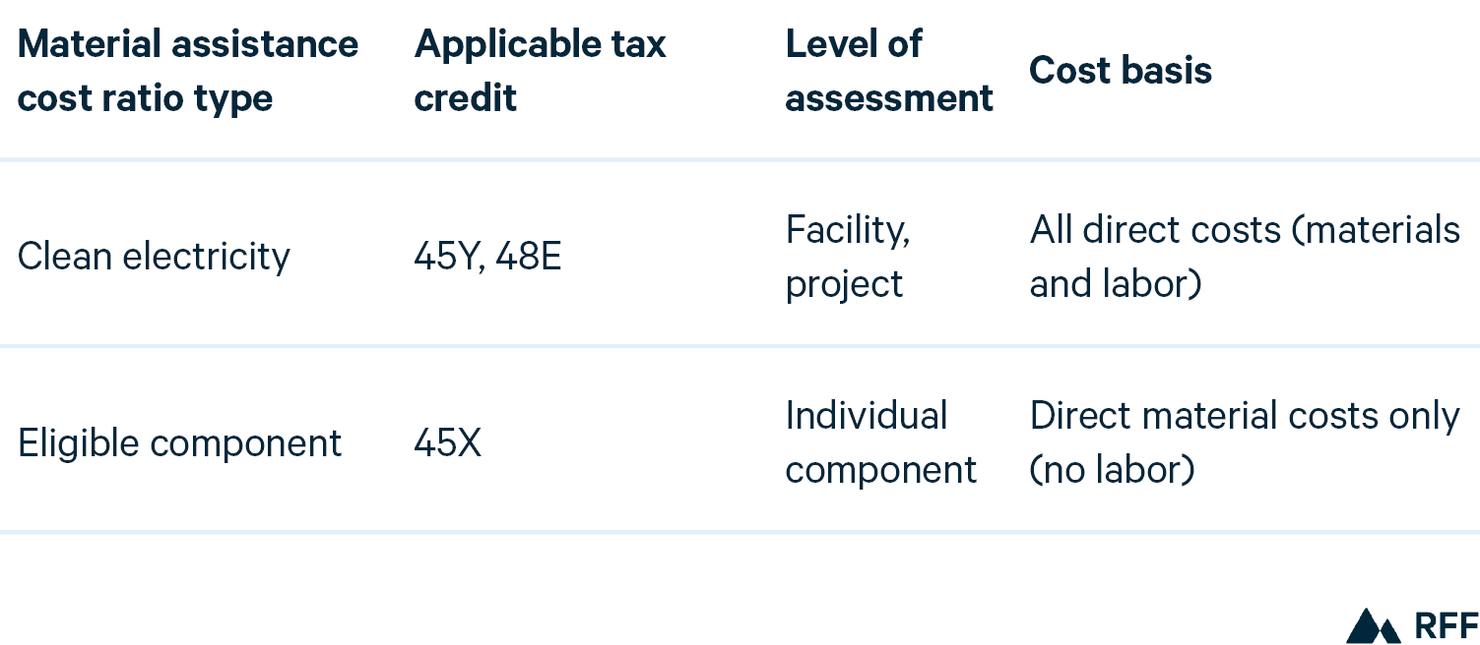
The material assistance cost ratio applies across several clean energy tax credits, each with its own calculation methodology (see Table 1). This report focuses on the Section 45X Advanced Manufacturing Production Credit, which applies to manufacturers of battery cells and components and is the most directly relevant credit for LFP battery supply chains. Section 48E and Section 45Y are closely related but not central to understanding the LFP supply chain compliance challenge addressed here.
Table 1. Regulations for Clean Electricity and Eligible Component Tax Credits
2.1. What Is the Material Assistance Cost Ratio?
The MACR is a cost-weighted compliance metric that measures the percentage of a product’s cost not associated with prohibited foreign entities. A higher MACR indicates less involvement of PFEs; a lower MACR indicates more. If the MACR falls below the threshold percentage for a given year, the product or facility is deemed to have “material assistance from a PFE” and becomes ineligible for the relevant tax credit.
Under US law, a prohibited foreign entity is defined as either a specified foreign entity or a foreign-influenced entity. Specified foreign entities are designated on US government restricted lists, including foreign entities of concern under the 2021 National Defense Authorization Act, as well as firms owned or controlled by the government of China, Russia, Iran, or North Korea.
Foreign-influenced entities are firms that maintain substantial financial or operational ties to specified foreign entities. Whereas the latter are directly owned or controlled by covered governments, the former may be incorporated elsewhere but remain subject to significant foreign influence through ownership stakes, financing arrangements, or contractual control. Under current guidance, a firm may be classified as a foreign-influenced entity when a specified foreign entity possesses sufficient equity ownership, debt exposure, or contractual rights to exert meaningful influence over the firm’s production or sourcing decisions. Current thresholds are 25 percent ownership by a single specified foreign entity, 40 percent aggregate ownership, 15 percent debt exposure, or contractual rights conferring effective control.
2.2. How Does the Regulation Affect Section 45X Tax Credits for Battery Manufacturers?
For LFP battery manufacturers, the Section 45X Advanced Manufacturing Production Credit offers up to $45/kWh for qualifying battery components ($35/kWh for cells, $10/kWh for modules). Although the Section 45X credit also applies to battery modules at $10/kWh, this analysis focuses on battery cells, where PFE exposure is most concentrated and the compliance challenge most acute. These credits scale rapidly as battery production volume increases. A single gigafactory-scale battery cell facility can generate hundreds of millions of dollars in annual Section 45X credits, and the credit is estimated to have catalyzed more than $48 billion in US battery manufacturing investment since the Inflation Reduction Act was enacted in 2022 (Center for Climate and Energy Solutions 2025). However, access to that credit now depends on passing the eligible component MACR test.
The MACR is calculated for each battery component sold during a taxable year, as follows:
MACR = (Total Direct Material Costs − PFE Direct Material Costs) ÷ Total Direct Material Costs
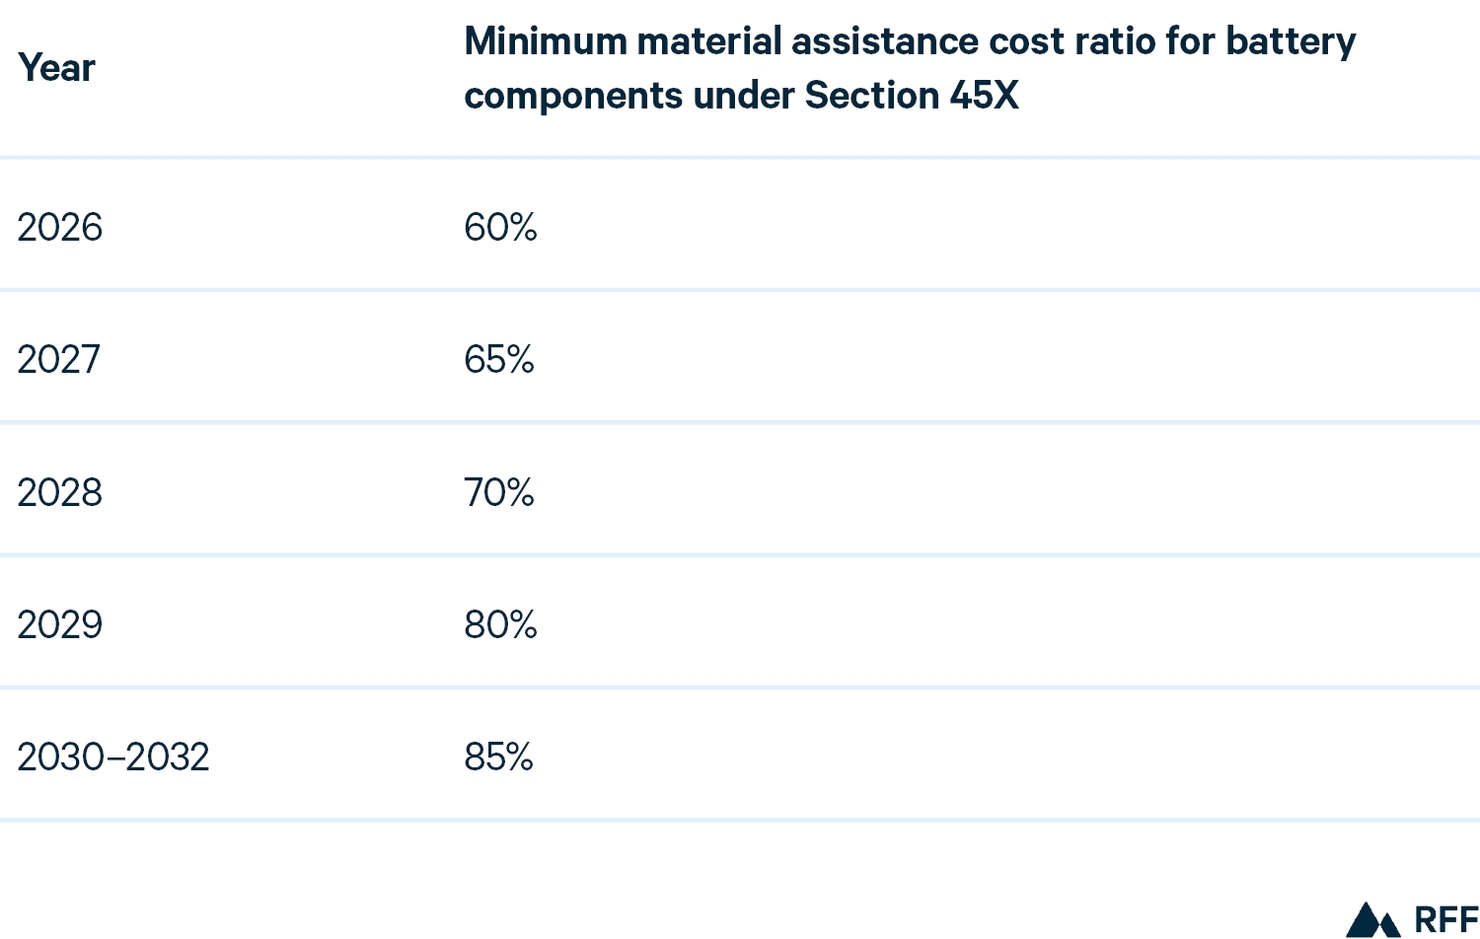
In practice, calculating the MACR requires manufacturers to account for the cost of the direct material inputs that go into the battery cell, from the cathode and anode graphite to the electrolyte and separator. The more those costs are tied to PFEs, the lower the ratio and the greater the risk of losing the credit entirely. The OBBBA establishes minimum non-PFE content thresholds that rise annually. Table 2 shows the schedule for Section 45X battery components.
Table 2. Minimum Inputs not from Prohibited Foreign Entities, by Year
Compliance is self-assessed: manufacturers calculate the MACR on their tax returns, and no government body verifies the figure up front. Instead, the OBBBA strengthens enforcement after the fact. IRS has six years, rather than the standard three, to audit a MACR claim. Penalties for overstating the ratio kick in at a much lower error threshold than for other tax mistakes, and suppliers that provide inaccurate certifications also face penalties.
Accounting for those inputs does not require manufacturers to investigate every entity in the supply chain themselves. Under interim IRS guidance, IRS Notice 2026-15 (Feb. 12, 2026) (https://www.irs.gov/pub/irs-drop/n-26-15.pdf). a manufacturer may rely on suppliers’ written certifications of PFE status and cost attribution; this is the “certification safe harbor.” A manufacturer’s due diligence therefore extends in principle only to its direct suppliers. Nevertheless, this reliance has limits. A manufacturer cannot use a certification it knows, or has reason to know, is inaccurate. Moreover, when a manufacturer has reason to know an input comes from a PFE, the input’s entire cost counts as PFE-sourced in the MACR calculation.
2.3. What Inputs Does “Material Assistance” Encompass?
Perhaps the most consequential feature of the MACR framework is that it reaches beyond physical materials. Under IRS guidance, material assistance includes intellectual property (IP) licensing, equipment supply, and contractual control. A US battery factory that depends on a PFE licensor for sourcing decisions or production control may still be treated as receiving material assistance, even if the licensor operates entirely on US soil.
This matters enormously for LFP. Many domestic cell manufacturers operate under technology agreements originally structured with Chinese equipment suppliers or process technology providers. If those contracts grant the Chinese counterparty meaningful operational influence, including exclusive maintenance rights, royalty arrangements beyond 10 years, or restrictions on the licensee’s independent use of the intellectual property, the compliance clock is already running.
2.4. Takeaway: Compliance Is about Control and Cost Structure, Not Just Geography
For manufacturers building battery capacity in the United States, the MACR framework sets a bar that geography alone cannot clear. Compliance requires that the cost structure of each component reflect meaningful sourcing from non-PFE entities. It further requires that the contractual and technological architecture of production not cede effective operational or sourcing control to specified foreign entities, regardless of where the factory sits. The rising threshold schedule means that a supply chain configuration that clears the bar in 2026 may not be compliant in 2028. And the extension of “material assistance” to intellectual property licensing and equipment dependencies means that even firms that invest in domestic manufacturing capacity may remain exposed if their technology platforms originated in, or continue to be influenced by, Chinese counterparties.
3. The Battery Supply Chain: Implications for Compliance
The LFP supply chain can be divided into upstream mining of critical raw minerals, midstream processing and component manufacturing, and downstream cell and pack assembly. These tiers differ substantially in geography, industrial actors, and diversification timelines.
3.1. Upstream Mining
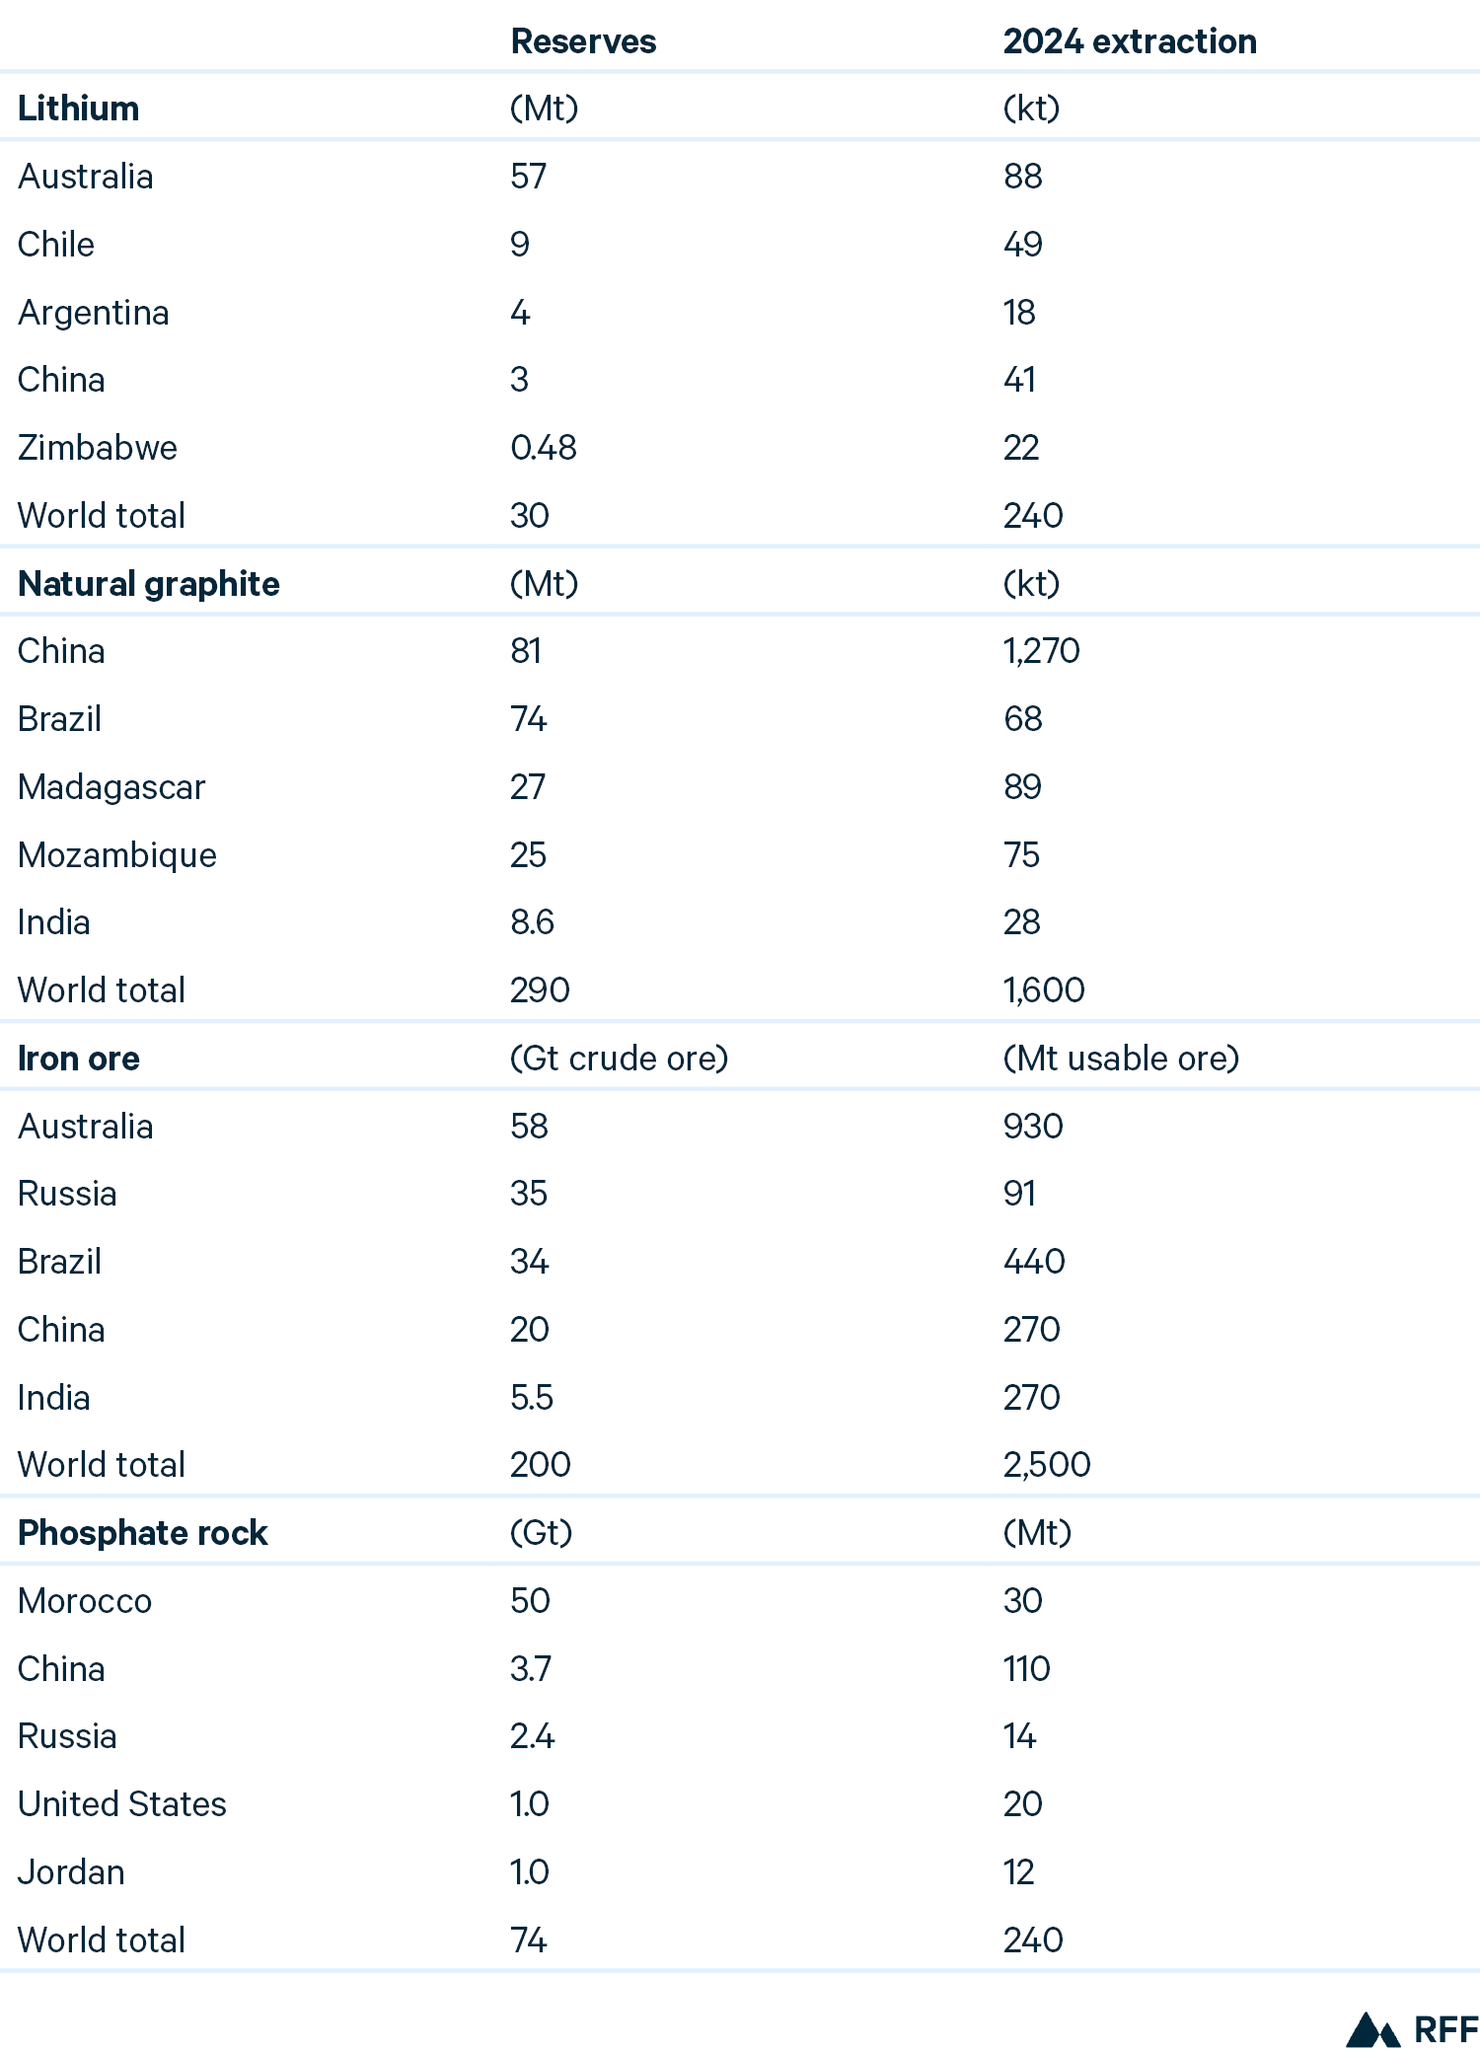
This tier has attracted substantial policy attention through critical minerals strategies and allied nation sourcing requirements. However, the supply base for LFP raw minerals is comparatively dispersed. As shown in Table 3, the four main inputs for LFP batteries—lithium, iron ore, phosphate, and graphite—have different sources.
Table 3. Battery Mineral Reserves and Extraction, 2024
Note: kt = kilotons, Mt = megatons, Gt = gigatons
Source: USGS (2025a).
Resources are found across Australia, Chile, Argentina, China, and the United States. Iron ore is widely available, with large reserves in Australia, Brazil, and Russia. Phosphate and graphite are distributed across Africa, Asia, and North America (see also Statista 2026a).
The two principal graphite-based anode materials used in LFP batteries are natural and synthetic graphite (USGS 2022). In 2024, China, Madagascar, and Mozambique were the three largest exporters of natural graphite (in powder or flake form, HS 250410) by volume (OEC n.d.). The United States was the largest importer and recorded a trade deficit of $91 million in this category (OEC n.d.). The U.S. had a trade surplus of $45.3 million in other graphite-based products (HS 380190) (OEC n.d.). Synthetic graphite is manufactured from carbon-based feedstocks and is therefore not tied to natural graphite deposits, although battery-grade production requires specialized processing capacity. Several federally supported projects indicate that US production capacity may expand, but the timing and scale remain uncertain (US DOE 2024a, 2024b). Nevertheless, sourcing can shift across procurement cycles as projects come online.
3.2. Midstream Processing
The principal constraint emerges after minerals are extracted, when the raw materials are converted into battery-grade components through chemically precise, capital-intensive processes that depend on accumulated know-how. Over the past two decades, China has built integrated, large-scale midstream capacity across the core supply chain segments. This position reflects not only production volume but also tacit process knowledge, specialized equipment, and production yield expertise. Replicating this capacity outside China requires sustained capital investment, access to process technology, and a longer adjustment period than current policy timelines allow, especially as MACR thresholds for Section 45X qualifying battery components rise to 85 percent beginning in 2030.
Figure 1 provides information on the origin of materials across the supply chain. Those batteries require battery-grade lithium carbonate, whereas lithium hydroxide is more closely associated with nickel-rich cathode chemistries (International Renewable Energy Agency 2022). In 2024, lithium carbonate exports were led by Chile and Argentina, and lithium oxide and hydroxide exports were led by China, Chile, and the United States (World Integrated Trade Solution 2024a, 2024b).
Graphite processing is the most concentrated midstream segment. China processes the most battery-grade natural graphite, and the cost gap for production outside China appears to be structural rather than temporary. Bhuwalka et al. (2025) estimate that US production costs for both natural and synthetic battery-grade graphite are roughly 100 to 200 percent higher than Chinese production costs, reflecting higher capital intensity, higher input and equipment costs, weaker economies of scale, and lower near-term shaping yields and process throughput.
Cathode production is a second major midstream vulnerability. China holds approximately 87 percent of global cathode active material production capacity across all battery chemistries, and it produces more than 98 percent of LFP cathode material (Benchmark Minerals 2025b; IEA 2025b). In 2024, China produced an estimated 2.3 million metric tons of LFP cathode active material, an increase of roughly 84 percent from the prior year, against approximately 4.7 million metric tons of installed capacity (Shanghai Metals Market 2025).
Figure 1. Origins of Materials in Lithium Iron Phosphate Battery Supply Chain
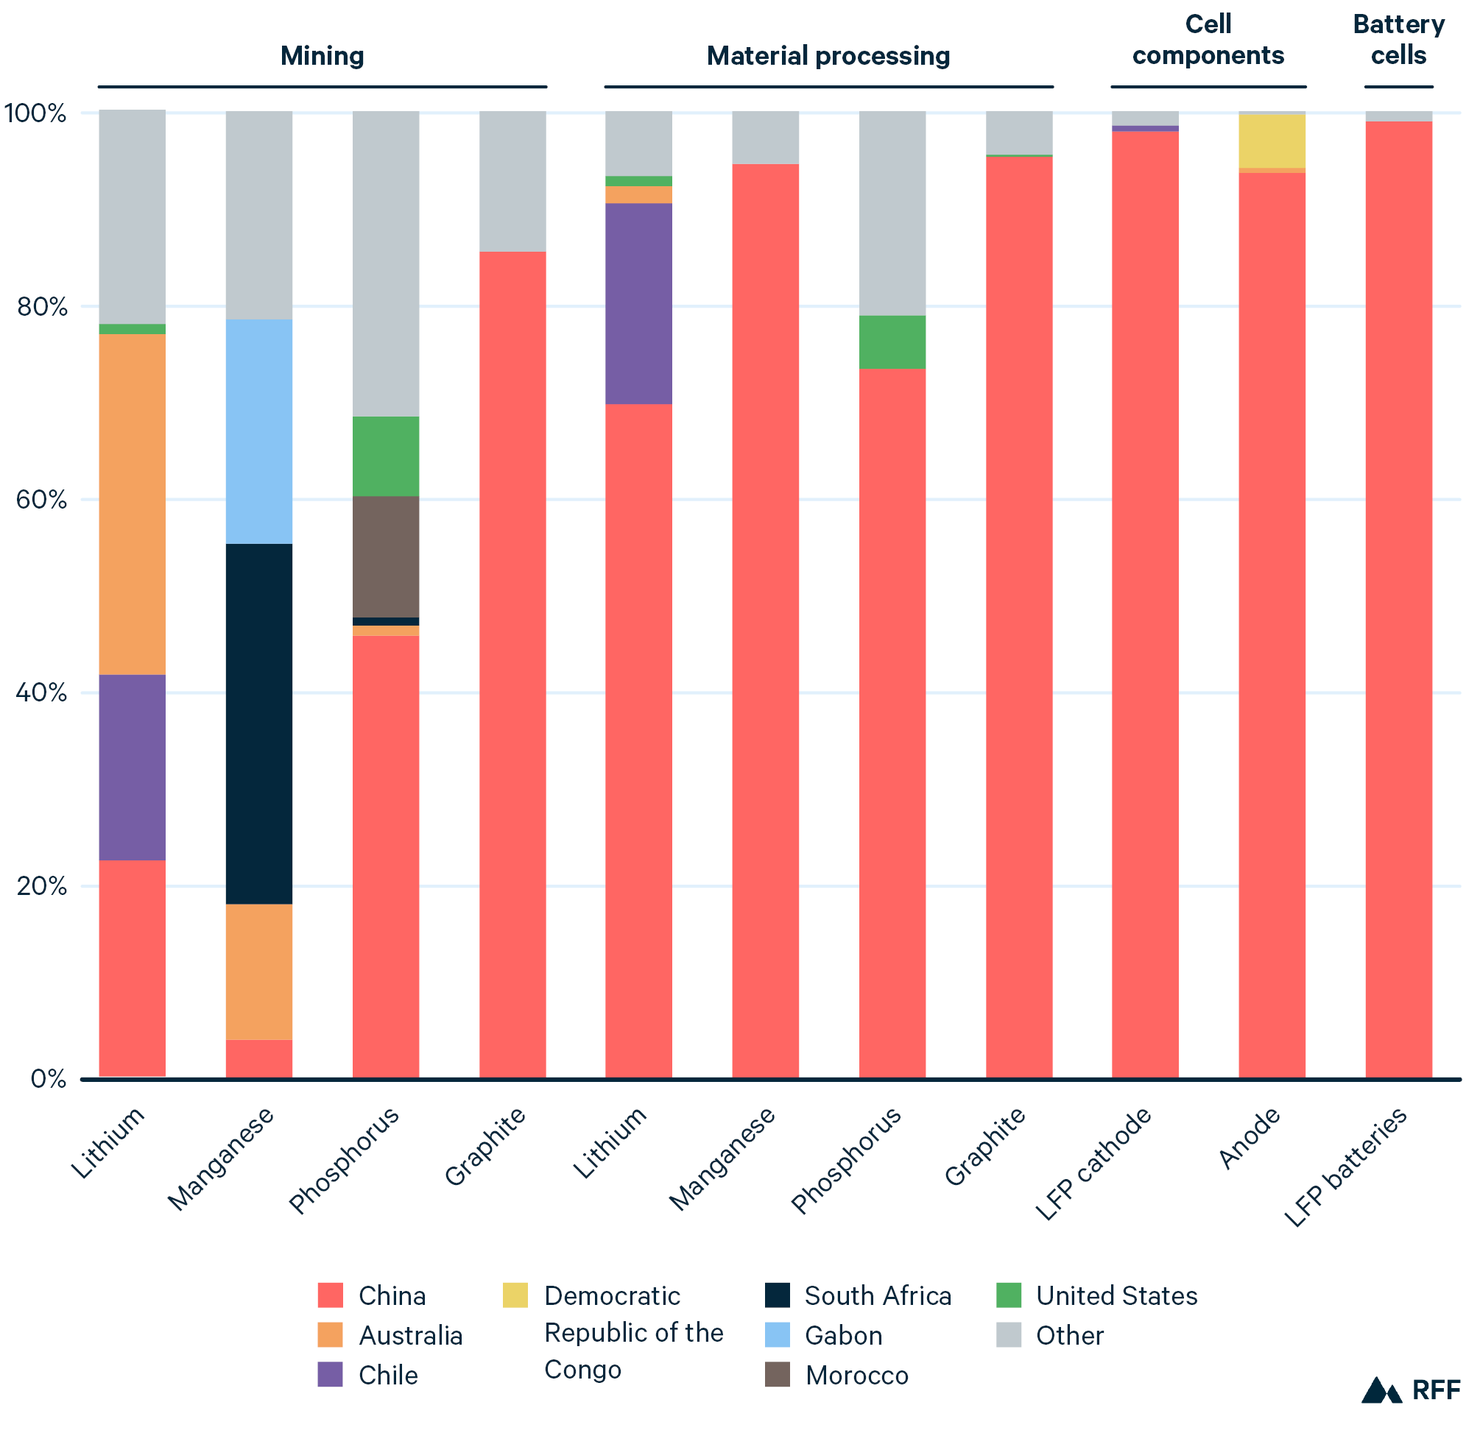
Source: International Energy Agency (2025a).
Electrolyte and separator supply completes the midstream picture, but their concentration profiles are different. For electrolyte, the critical input is lithium hexafluorophosphate (LiPF6), a specialty electrolyte salt for which production capacity is heavily concentrated in China. The United States currently lacks large-scale domestic production and depends on imported electrolyte materials. Separator supply is more geographically diversified, with meaningful capacity held by Japanese and Korean firms, although China has become the largest producer by volume. Together, electrolyte and separator account for roughly 10 percent of EV battery cell cost, making them smaller than cathode and anode materials but still significant sources of supply chain exposure to PFEs, especially given the high concentration of electrolyte and separator production in Asia (McKinsey 2024).
3.3. Downstream Manufacturing
Cell manufacturing, pack integration, and end applications are more geographically diversifiable than midstream material processing, although China’s current share of global cell manufacturing capacity is high. Korean battery manufacturers and emerging North American gigafactories demonstrate credible cell manufacturing capacity outside China, whose share is projected to decline to about sixty-seven percent by 2030 (IEA 2025a). Diversification, however, is not assured because US battery manufacturing is highly sensitive to policy support and EV demand. Following the reversal of EV policy incentives and slowing demand in 2025, more planned U.S. EV manufacturing plants were canceled in the first quarter of 2025 than in 2023 and 2024 combined (Environmental Defense Fund 2025). The critical caveat for compliance with requirements to access tax breaks is that downstream diversification remains contingent on midstream inputs. A gigafactory in North America may still depend on graphite and LFP cathode active material produced in China unless midstream bottlenecks are resolved first. Downstream capacity can therefore shift the geography of cell assembly without necessarily shifting the underlying supply chain risk (IEA 2025b; Reinsch et al. 2024).
3.4. Supply Chain Takeaways
The MACR depends not only on where cells are assembled, but also on the origins and cost shares of the embedded materials, components, equipment, and technology. Because the MACR is a cost-weighted ratio rather than a volume measure, compliance depends on component costs as well as PFE involvement. A rise in the price of non-PFE inputs increases the MACR, which supports compliance, whereas a rise in the price of PFE-sourced inputs reduces the MECR even when physical sourcing is unchanged.
Table 4 maps LFP inputs according to those two dimensions, cost share and level of PFE exposure. The inputs that pose the greatest compliance risk are those that are both high-cost and high-PFE-exposure (the upper right quadrant). For LFP batteries, these are primarily graphite and cell manufacturing. Inputs that are low-cost and low-PFE (the lower left quadrant), such as raw materials, pose low risk. The remaining inputs sit in intermediate positions, where exposure is either contained by low cost share or moderated by limited PFE dependence. MACR compliance risk is therefore concentrated in a narrow set of inputs that combine high cost shares with high PFE exposure, creating binding constraints for supply chain redesign to comply with MACR requirements.
Table 4. Compliance Risks Matrix: Cost Share vs. Exposure to Prohibited Foreign Entities
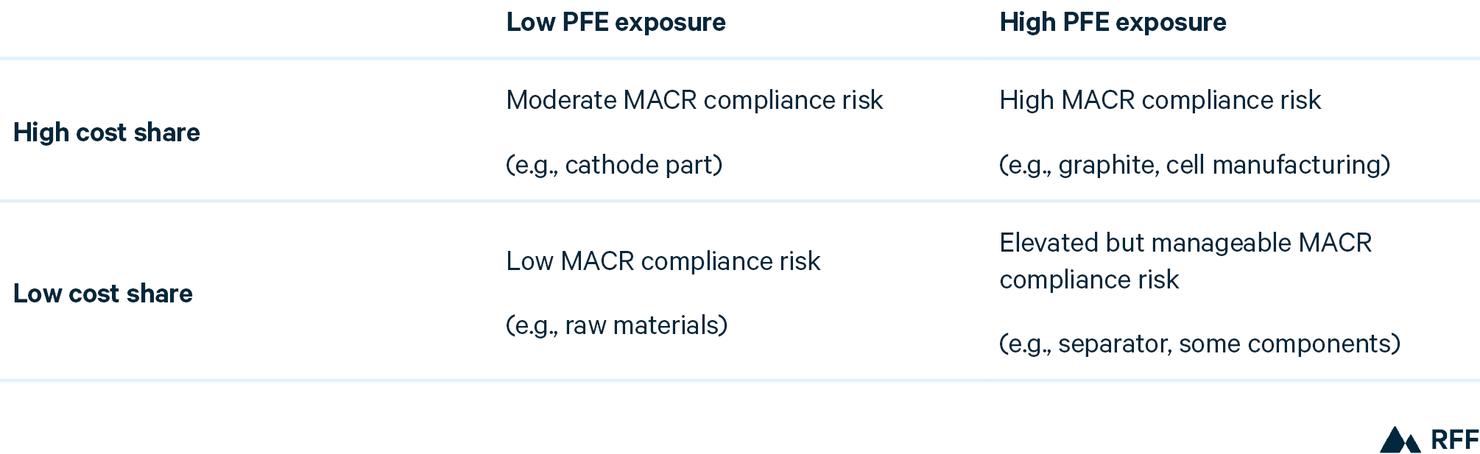
Note: Axes represent drivers of risk; quadrant labels represent MACR compliance outcome.
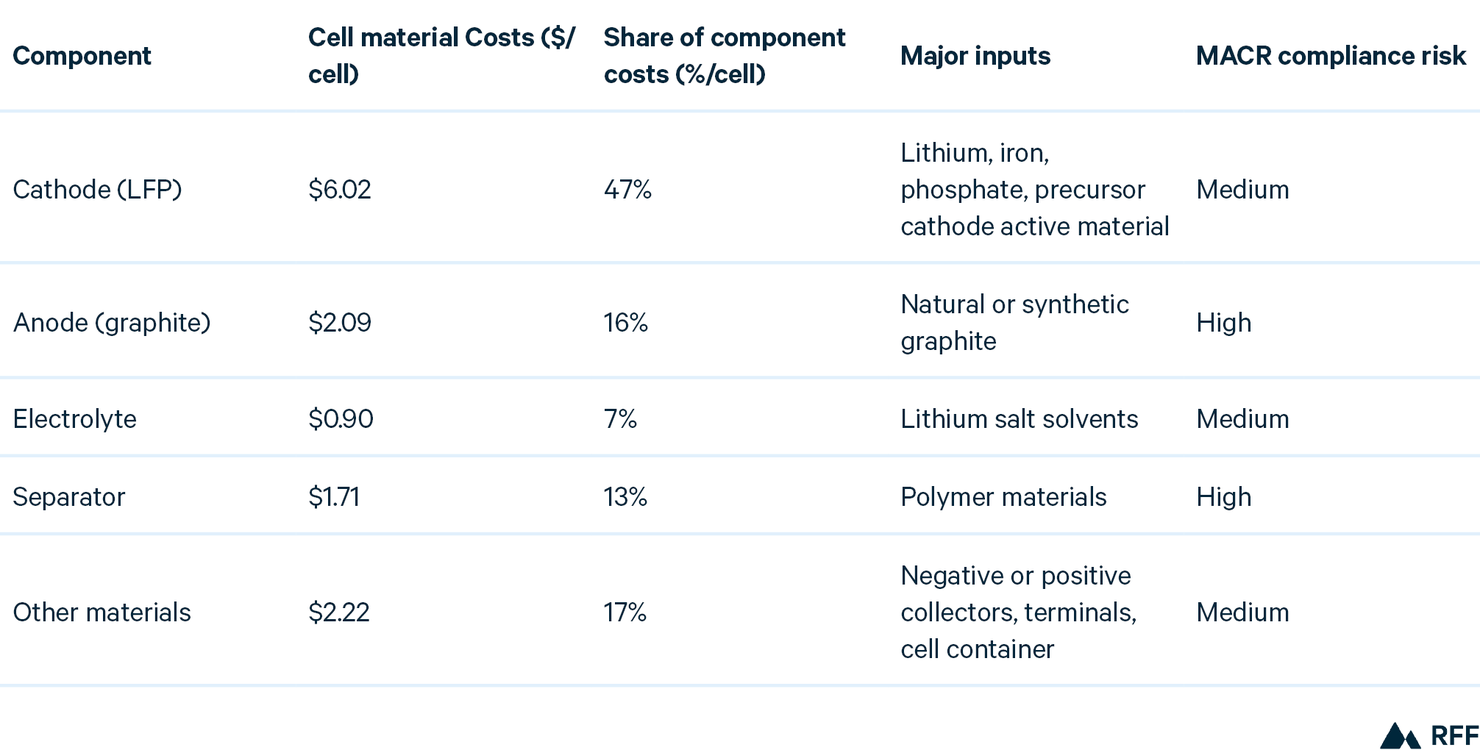
Table 5 illustrates these risk rankings for a specific battery type, the LFP-G Power battery. The Argonne National Lab BatPaC v5.0 model (Argonne National Lab n.d.) provides cost estimates for this battery. Cells are optimized for high-power applications, such as EVs requiring rapid acceleration, with lower area-specific impedance suited to high-current discharge. Cells in the LFP-G Energy battery are optimized for high-energy applications such as stationary storage, with higher energy density and more compact cell designs. The risk findings for the LFP-G Energy battery are similar to Table 5.
Table 5. Cost Structure for the LFP-G Power Battery Designs
The vulnerability of the LFP supply chain is concentrated in the midstream. Midstream diversification is structurally different from upstream mining diversification: it depends on manufacturing capabilities that take considerable time and investment to develop. Building these capabilities for graphite anodes or LFP cathode active material is therefore unlikely to occur within a single procurement cycle and instead require a decade or more of sustained investment. The resulting timeline for midstream diversification is not well aligned with the MACR schedule, under which qualifying battery components must increase their non-PFE content from 60 percent in 2026 to 85 percent beginning in 2030 to retain Section 45X tax credit eligibility. The compliance risk is not simply that China dominates current production but that the policy schedule assumes a pace of non-PFE midstream buildout that current industrial trajectories do not yet support.
4. Where the Constraints Bind in Current Supply Chains
MACR compliance is often framed as a sourcing problem: identify inputs linked to prohibited foreign entities, find alternative suppliers, and restructure procurement accordingly. The evidence from current supply chains suggests this framing understates the difficulty. The constraints that bind are not simply about where materials come from. They extend through the regulatory frameworks that govern how compliance is measured, the capital and trade dynamics that limit how quickly alternatives can scale, and the technology dependencies that persist even after physical sourcing has been redirected. These constraints interact and compound in ways that make the compliance challenge considerably harder to resolve than geography alone would suggest.
4.1. Regulatory and Traceability Constraints
Even when manufacturers can identify PFE-linked inputs, translating that knowledge into MACR compliance is far from straightforward. The framework creates friction in three dimensions: attributing costs to their PFE or non-PFE origin, tracing constituent materials through supply chains where transparency is limited, and unwinding contractual arrangements that were lawful but now trigger PFE exposure. Together, these constraints complicate compliance in ways that go beyond conventional supply chain restructuring.
4.1.1. Cost Attribution
Manufacturers must now assign precise cost percentages to each constituent material and trace those costs to their PFE or non-PFE origin. For LFP battery cells, this is harder than it sounds. Many of the highest-risk inputs, particularly graphite and cathode active material, are sourced from suppliers that are vertically integrated across multiple processing stages (IEA 2025a). Consider a Chinese supplier that mines and processes graphite before selling it to a US cell manufacturer. The MACR rules require the manufacturer to determine what share of that input’s cost is PFE-attributable, and when the entire processing chain sits within a single PFE-linked entity, the answer is, effectively, the whole thing.
Now consider the cell manufacturing level. Here, the manufacturing equipment and process know-how represent a significant share of production costs, and much of that equipment is sourced from PFE-linked suppliers (MarketsandMarkets 2024). Unlike physical materials, equipment costs are not direct material costs under the Section 45X Eligible Component MACR calculation, which excludes labor and capital. However, if that equipment is supplied under agreements that grant the supplier effective control over production parameters, it can trigger PFE status for the manufacturer itself, which shifts the compliance problem from the MACR numerator to the entity-level PFE definition.
4.1.2. Traceability
Battery-grade graphite, one of the highest-risk inputs, is mined, purified, refined, and coated before it enters a cell. At each stage, the material may change hands, cross borders, or be blended with material from other sources (IEA 2025a). The MACR framework requires that constituent materials be traced to the entity that mined, produced, or manufactured them; under the Certification Safe Harbor rules, that tracing is performed link by link, with each supplier certifying to its customer. For graphite, however, the processing chain is rarely transparent even to its participants, so certifications may rest on claims about the material’s origin no one in the chain can verify. And because graphite processing is overwhelmingly Chinese, a cell manufacturer presented with a clean certification for graphite of uncertain origin may have precisely the “reason to know” that makes reliance on it a potential violation (Benchmark Minerals 2026).
The same challenge applies to electrolyte and separator production, where Chinese firms dominate not just supply but also the intermediate chemical inputs. A US manufacturer purchasing electrolyte from a nominally non-PFE distributor may still be exposed if the underlying lithium salts or solvents were processed by a PFE, and the Certification Safe Harbor provides limited relief if the manufacturer has reason to know the certification is inaccurate. IRS Notice 2026-15 does not require full supply chain tracing where a manufacturer has no reason to doubt its suppliers’ certifications. However, because Chinese firms dominate processing, any given input is likely to have passed through PFE hands somewhere upstream, and a manufacturer can rarely confirm that it did not.
4.2. Trade Exposure and the Limits of Substitution
To assess trade exposure, this section examines how the United States can find new sources for LFP inputs, who controls the supply flows that reach US manufacturers, and whether exposure to PFE supplies is narrowing or widening over time. The relevance of these questions to MACR compliance is direct. Because the MACR measures the share of an input’s direct material cost that is not attributable to a PFE, and attributes that cost to the entity that produced the material rather than the country where it was mined, the structure of trade flows determines how each input enters the compliance calculation (Bellile et. al 2026; RSM US 2026).
4.2.1. Feasibility of Substitution
Substitution feasibility is deeply uneven across the supply chain, and the variation maps onto cost share in a way that compounds compliance risk.
US manufacturers obtain raw lithium predominantly from Chile and Argentina, both non-PFE jurisdictions, and this pattern has been stable since at least 2015 (USGS 2025b). Here, trade exposure aligns naturally with MACR requirements because the dominant suppliers are not prohibited foreign entities.
For processed lithium, the picture is more complex. China is the world’s leading exporter of lithium hydroxide. It processes Australian and South American raw material into battery-grade compounds for export to the United States, Japan, and South Korea (Statista/WITS 2024). Even when the raw material source is non-PFE, then, the refining stage creates PFE exposure, since the direct cost of the refined input carries Chinese attribution.
Graphite and LFP cathode active materials are the least tractable—and also the inputs where substitution would most improve the material assistance cost ratio. China accounts for 68–92 percent of US battery-grade graphite imports and more than 98 percent of global LFP cathode material production (IEA 2025a). One case illustrates this clearly. BTR New Material Group, a Chinese company headquartered in Shenzhen, is the world’s largest producer of battery-grade graphite anode materials. It planned to produce graphite from factories in Indonesia and Morocco, which US firms saw as viable non-PFE sources (Taulli and Busby 2025). However, in January 2025, the US Department of Energy designated BTR as a PFE and extended that ruling to its overseas subsidiaries (Taulli and Busby 2025), meaning the location of production does not matter if the company itself remains under Chinese government control (Shihua 2024). Since the MACR attributes material to the producing entity rather than the country of manufacture, third-country production by a PFE-controlled firm yields no compliance benefit (Miller and Chevalier 2026).
4.2.2. Ownership Stakes and Control of Supplies
Geographic origin statistics consistently understate China’s effective control, and the gap falls precisely where the MACR is most sensitive. Because China imports raw lithium carbonate from Chile and Australia (as well as using some material extracted domestically), refines it into battery-grade lithium hydroxide, and exports the processed product, US manufacturers may appear to import from non-PFE sources in the upstream while remaining PFE-exposed at the midstream. China exported $6.22 billion of lithium hydroxide in 2023, with Chile a distant second (Statista/WITS 2024). Ownership compounds the processing concentration, since Chinese firms have acquired roughly $5.6 billion in lithium mining assets across Chile, Canada, and Australia, and China controls more than 60 percent of global lithium refining capacity (WEF 2023). For cathode material and graphite, this control extends across both production and the specialized processing steps. That places a cell’s highest-cost inputs and its most PFE-concentrated inputs in the same position.
4.2.3. Dynamic Trends in Input Sourcing
China produces 77 percent of the world’s graphite, the United States imports 42 percent of its requirement from China, and domestic production in the United States is negligible (S&P Global Mobility 2024). At battery grade, the concentration is higher still, since China accounts for 97 percent of global anode output, and US imports of active anode material from China reached approximately $374 million in 2023, roughly 67 percent of all such imports (USITC 2024). China controls about 75 percent of natural graphite production and dominates spheronization and purification downstream, so relocating extraction does not relieve the processing bottleneck (Crux Investor 2025). The extension of IRA credit eligibility for EVs containing Chinese graphite through the end of 2026 was itself an acknowledgment that no alternative supply exists at scale (Park et al. 2025).
The policy response to this concentration illustrates the limits of trade measures as a substitute for diversification. In early 2026, the Department of Commerce finalized antidumping and countervailing duties on Chinese active anode material that, combined with prior tariffs, brought the effective rate to roughly 160 percent, raising the landed cost of Chinese anode material from about $3,700 to $9,300 per tonne, against domestically produced material at roughly $5,400 per tonne before the Section 45X production credit (Benchmark 2025a). These measures improve the relative cost position of non-PFE producers, but they do not create qualifying supply where none exists at scale, and in the interim they raise input costs for US cell manufacturers that have no alternative source. The same dynamic appears in China’s use of export controls as leverage. In October 2025, China announced licensing requirements on a range of graphite and lithium products effective that November, then partially suspended stricter verification measures for graphite shipments to the United States through late 2026, a sequence that eased immediate friction while leaving the structural dependence and the threat of renewed restriction intact (Crux Investor 2025; Fastmarkets 2025).
Lithium runs in the opposite direction. Chile and Argentina supply roughly 94 percent of US raw lithium imports, with China below 3 percent across the period (USGS 2024). The advantage is partial, since a major share of Australian and Chilean ore is still refined in China before reaching US manufacturers, triggering PFE attribution at the midstream even though the mine itself is non-PFE (WEF 2023).
4.2.4. Trade Exposure Takeaways
The evidence across those three dimensions points to a single conclusion: trade exposure in the LFP supply chain is not uniform but concentrated, and it is concentrated in the hardest places to change. Inputs that can be re-sourced through existing trade relationships, most notably raw lithium, are also the inputs that already contribute little PFE exposure, so diversifying them does little to raise the overall material assistance cost ratio. In contrast, the inputs that would move the ratio most, particularly graphite and cathode active material, currently lack viable alternative suppliers at scale, limiting the feasibility of friendshoring strategies. Critically, even processed lithium carries significant hidden PFE exposure because China dominates global refining. Trade policy has so far been unable to close this gap, since tariffs have raised the cost of Chinese material without creating qualifying supply. Export controls are a further concern related to dependence on China. Friendshoring can reduce MACR risk at the raw material margin, but the binding constraints lie in the middle of the supply chain—where substitution so far is structurally limited and where these inputs also carry the greatest cost weight. Substantial new non-PFE investment will be needed to increase substitution possibilities.
4.3. Capital and Scale Feasibility Constraints
Capital and scale feasibility is here defined as the ability to mobilize finance to develop an MACR-compliant LFP battery supply chain. Mobilizing capital is a primary indicator for mineral capacity development, especially in supply chain bottleneck sectors.
4.3.1. Upstream
The United States primarily imports lithium and copper from countries that have signed a free trade agreement (FTA), mainly Australia and Peru, but less than 15 percent of graphite—critical for LFP batteries—comes from FTA countries (OEC 2026). Replacing the current PFE-dominated supply chain will be challenging for some time to come. China has the world’s largest reserves of natural graphite, at 1 million metric tons, followed by Brazil, at 740,000 metric tons (see also Statista 2026b). China is also the largest producer of graphite in the world. Although investment in critical minerals as a whole is required for a resilient supply chain, investments in bottleneck areas like graphite are especially needed to reduce PFE dependence.
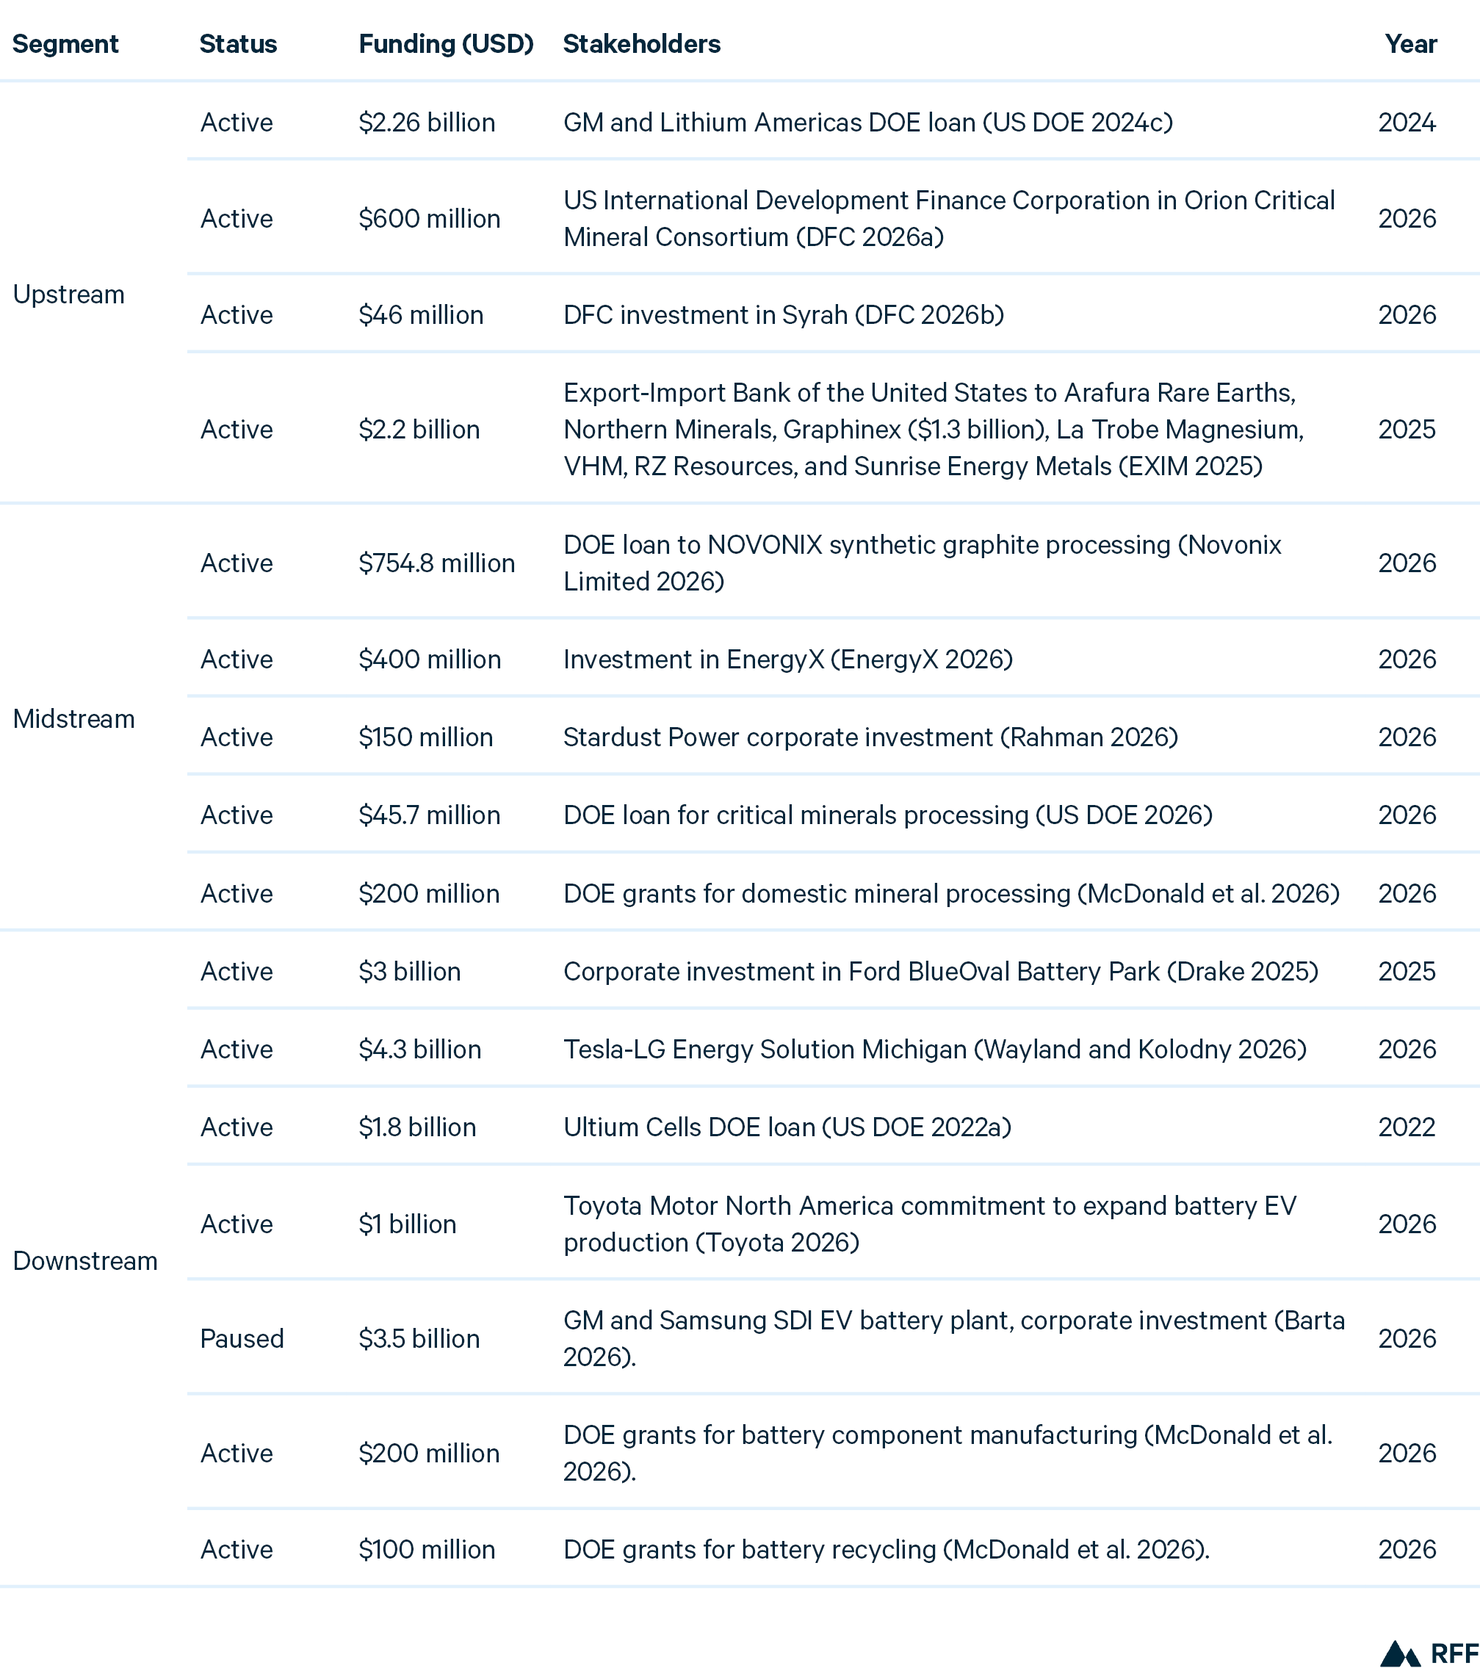
Recent US commitments have moved in that direction. Federal agencies have used a mix of Department of Energy loans, Development Finance Corporation equity, and Export-Import Bank financing to support upstream capacity, both domestically and in allied jurisdictions, with graphite a recurring target; Table 6 compiles the major commitments. The Graphinex and Syrah projects illustrate a pattern of particular relevance to the MACR: each pairs a mine outside the United States with anode or processing capacity intended to serve the US market, so the compliance question is about the ownership and structure of the integrated chain rather than the location of the mine alone.
Allied producers are expanding as well. Canada and Australia have both increased public investment in mineral capacity in recent years, with a growing share directed toward projects that combine extraction with processing and manufacturing rather than mining alone; other FTA partners, including Peru, have announced large projects (Leary et al. 2025; Radwin 2026). The direction is toward greater capital mobilization across FTA partners.
Upstream investment is expanding, but MACR compliance also depends on reducing cost exposure to PFEs. Continued reliance on PFE-dominated minerals such as graphite means that even increased upstream investment may not be sufficient to meet MACR thresholds.
4.3.2. Midstream
Midstream processing remains a major bottleneck in the supply chain, and dependence on PFE-linked processing capacity directly lowers the material assistance cost ratio. Even when upstream minerals are sourced from allied countries, continued reliance on PFE-dominated refining and processing infrastructure can prevent manufacturers from meeting the required thresholds. Developing non-PFE-linked processing capacity will require significant investments. One estimate suggests that the cost of additional lithium processing in the United States just to cover demand for EV manufacturing could be up to $25 billion, depending on the EV adoption scenario (Whitlock et al. 2025). That in turn is only a fraction of the future total US demand for processed lithium.
Processing capacity outside China continues to lag. Like graphite processing, lithium processing in the United States is constrained (Cai and Nakano 2026). However, many processing projects that would increase capacity are planned. There has also been an uptick in support for upstream projects combined with midstream processing. Syrah’s graphite processing facility in Louisiana is one such integrated supply chain strategy. Though indicative of movement toward integrating processing with mining, these efforts remain limited in scale relative to global demand.
Several spherical and synthetic graphite facilities are under development in the United States, including projects by Graphite One (Alaska), Westwater (Alabama), and Syrah Resources (Louisiana), with planned capacities ranging from roughly 7,500 to more than 45,000 t/yr. Synthetic graphite production is also scaling up, with NOVONIX and Anovion expanding capacity, though total output remains modest relative to projected demand. Anovion’s planned Georgia facility targets 40,000 tonnes, and Novonix’s Chattanooga plant targets 20,000 tonnes (Syrah Resources n.d.; Anovion Technologies 2023; Novonix Limited 2026; US DOE 2022b). In lithium, the Silver Peak (brine) facility remains the only operating site, but multiple projects are under development, including Piedmont Lithium (hardrock spodumene), Thacker Pass (clay), and Tonopah Flats (clay), with planned production reaching up to 40,000 tonnes per year in initial phases. More planned projects are listed in Table 6.
Canada and Australia are similarly advancing investments, particularly in refining and processing capacity linked to upstream resource bases. In Canada, Metals Australia is planning a large-scale graphite refinery in Quebec, and Rock Tech Lithium is developing lithium conversion capacity in Ontario (Metals Australia 2026); Rock Tech Lithium 2026). Additional initiatives, including projects by Focus Graphite, are focused on advancing graphite processing and materials development in Canada.
Outside China, South Korean producers represent the most credible near-term source of LFP cathode active material. However, commercial-scale LFP production remains limited and is only beginning to emerge. L&F, a South Korean company, is expected to become the first company to mass-produce LFP cathodes outside China. POSCO Future M, another South Korean company, is developing additional capacity through a joint venture with China’s CNGR (L&F Plus 2026; POSCO Future M 2025). Because POSCO’s production relies on a Chinese partnership, it remains uncertain whether its output will qualify as non-PFE under MACR rules. Meanwhile, most other Korean cathode manufacturers, including LG Chem, remain focused on nickel-based chemistries rather than LFP (LG Chem 2025). Consequently, despite growing investment, non-Chinese LFP cathode active material production is likely to remain constrained in the near term, limiting manufacturers’ ability to source qualifying cathode materials. This challenge is compounded by a broader shortage of domestic cathode production capacity in the United States, where projected demand is expected to significantly outpace supply by 2030 (Reinsch et al. 2024).
4.3.3. Downstream
As of 2026, the United States had 12 operating battery manufacturing plants and 23 under development (Plante et al. 2026). In addition, since 2019, 180 primary component facilities have been planned for development (Cai and Nakano 2026). Based on production data from 29 US-based facilities, current and planned capacity stood at 210 GWh in 2024 and was expected to reach approximately 820 GWh by 2032 (Bui and Slowik 2025). However, since early 2025, many U.S. battery manufacturing investments and projects have been cancelled (Cai and Nakano 2026). As of early 2026, at least $22 billion USD in battery manufacturing investments have been cancelled (Gearino 2026).
Forge Nano and Group14 Technologies have announced a collaboration to produce lithium-ion battery cells in the United States using a predominantly domestic supply chain, combining advanced materials with US-based manufacturing infrastructure (Forge Nano 2026). Innovation in manufacturing processes is also supporting industry scale-up. Major automakers, such as Toyota Motor North America, continue to invest in production capacity (Pulsenics 2026). However, battery facilities have faced delays or closures. For example, GM and its partner, Samsung SDI, indefinitely paused construction on their planned EV battery plant in New Carlisle, Indiana (Barta 2026).
Farther downstream of manufacturing, the EV adoption market is an important piece of the supply chain. A slowdown in the EV market has been driven in part by rollbacks in tax incentives and subsidies, combined with uncertain outlook on policy stability. Despite the slower EV market, recent developments in EV deployment and related technologies reflect continued expansion in end-use demand alongside emerging new applications. New Flyer of America secured additional orders from the Washington Metropolitan Area Transit Authority for hybrid and battery-electric buses (NFI Group 2026).
At the same time, battery applications are expanding beyond traditional transportation. SK On is exploring supply agreements with a US defense contractor for batteries in AI-powered unmanned submarines, though large-scale deployment is not expected before 2028 (Korea Bizwire 2026). There are also some efforts to strengthen capacity in battery recycling. Aqua Metals and American Battery Factory have announced plans to evaluate colocating a lithium-ion battery recycling facility alongside battery manufacturing operations in Arizona (Aqua Metals 2026).
Downstream manufacturing has seen increasing investment, but further growth will require sustained support and it remains dependent on upstream and midstream inputs that shape overall cost structures. Because MACR compliance is determined by the composition of material inputs, downstream expansion alone cannot ensure compliance if earlier stages of the supply chain remain exposed to PFE-linked sources.
4.3.4. Capital and Scale Feasibility Takeaways
US LFP supply chain capacity development projects reflect a mismatch between current investment patterns and the requirements of the MACR framework. Table 6 lists recent supply chain capacity investments. Although investments are being made across the supply chain, the downstream and upstream segments are comparatively well funded, but the midstream is comparatively underfunded. Midstream investment will be critical if downstream projects are to succeed in the MACR framework. Moreover, if upstream projects are well funded but midstream capacity remains underdeveloped, mining projects might have to ship ore out to be processed internationally, complicating MACR compliance. Projects that link upstream and midstream capacity development can help breach such supply chain gaps.
Many of the projects were only recently announced, and the ecosystem is in flux. Achieving a resilient and fully compliant LFP supply chain will require not only expanded mining investment but also sustained long-term financing, coordinated industrial policy, and targeted support for processing and refining capacity in the United States and allied countries. Investment transparency would help support research and analysis for effective investments and policymaking.
Table 6. Examples of New Funding, by Supply Chain Segment
4.4. Technological Dependence Constraints
To assess technological dependence on prohibited foreign entities, this section focuses on the midstream stage of the LFP supply chain, where raw minerals are converted into functional battery materials. As established in Section 3, the midstream is structurally different from upstream extraction and downstream assembly: it requires chemically precise, equipment-intensive, know-how-dependent processes that were developed overwhelmingly in China over the past two decades (RMI 2023; EIA 2025).
4.4.1. Graphite Processing (Anode Material)
Graphite represents the most immediate constraint in the supply chain because it is the anode material used in virtually all commercial LFP batteries. As noted in Section 4.2, the cost gap for production outside China reflects accumulated processing expertise in spheronization, carbon coating, and furnace yield management that non-PFE producers have not replicated at scale (Oxford Economics 2024; Bhuwalka et al. 2025). Synthetic graphite provides only a partial alternative, since synthetic precursor supply is also dominated by China. Graphite demand for battery anodes is projected to roughly quadruple between 2023 and 2030, yet more than 90 percent of battery-grade graphite in 2030 will likely still originate in China (IEA 2024).
4.4.2. Cathode Active Material
A similar concentration risk appears in the cathode supply chain, although the market dynamics differ. China’s current dominance reflects cumulative advantages in precursor chemistry, proprietary sintering technology, and colocated raw material supply, creating a structural competitiveness gap that procurement changes alone cannot resolve (Craig-Scheckman and Moore 2025). Ownership structure further complicates compliance assessment, since China controls not only domestic production but also significant equity stakes in international cathode facilities. As a result, trade flow reorientation without ownership verification may understate true PFE exposure (Fraunhofer FFB 2025).
As noted in Section 4.3, Korean producers represent the only credible near-term alternative outside China for LFP-specific cathode active material capacity, and that capacity remains far below commercial scale. US cathode production capacity is anticipated to remain limited until at least 2030. Moreover, it is unclear whether the technologies are sufficiently independent of PFE influence to meet MACR requirements.
4.4.3. Electrolyte and Separators
Electrolyte salts present an additional compliance vulnerability. Production of lithium hexafluorophosphate (LiPF6), the electrolyte salt that facilitates ion transport, involves a highly concentrated specialty chemical supply chain. China dominates LiPF6 production, with estimates ranging from more than 70 percent of global capacity to nearly 95 percent of global production (Market Growth Reports 2026; Prismane Consulting 2023). The United States has no large-scale domestic producers, relying entirely on Asian imports of a material that degrades in transit (US DOE 2022b). Electrolyte salts have been identified as a supply chain investment gap, with nearly all US supply sourced through PFE channels (US DOE 2025).
Separators are thin membranes that prevent electrical contact between the anode and cathode while allowing lithium-ion transport through the electrolyte (Li and Duan 2023). They present a comparatively lower concentration risk. Japanese firms Asahi Kasei and Toray, along with US-based Celgard, have historically led the market, although China’s SEMCORP (also known as Yunnan Energy New Material) has overtaken these incumbents by volume (Fraunhofer FFB 2025). Asahi Kasei has committed more than $1 billion to a new wet-process separator plant in Canada targeting the North American EV market (Asahi Kasei 2025).
4.4.4. Technological Dependence Takeaways
The above analysis reveals a structural compliance problem: a battery producer may make individually rational friendshoring decisions at each stage of the supply chain and still fail MACR compliance in aggregate.
This can be illustrated through a plausible sourcing scenario. A US manufacturer sources lithium from Chile (an FTA partner and non-PFE jurisdiction), builds a cell factory in Ontario, Canada (another FTA partner), and purchases LFP cathode active material from a South Korean supplier (a third FTA partner). On a materials sourcing map, this appears to be a friend-shored supply chain. However, three technology linkages still create potential MACR exposure.
First, the graphite in the anode was processed in China because no FTA country processor can currently supply battery-grade spherical graphite at commercial scale (EIA 2025). Second, the cell factory remains exposed to Chinese battery-manufacturing equipment suppliers. Chinese vendors occupy leading positions in the lithium-ion battery equipment market, accounting for 68 percent of sales among the world’s top 25 suppliers in 2024, with especially high shares in cell assembly equipment and formation and testing equipment (Interact Analysis 2026). Reliance on Chinese firms that supply lithium-battery production lines and manufacturing equipment can create a technology linkage to Chinese firms even when cell production is located outside China. Third, as discussed above, the Korean LFP cathode active material supplier relies on Chinese process technology, as illustrated by Posco Future M’s LFP cathode joint venture with China’s CNGR. This suggests that even cathode production located outside China may remain linked to Chinese firms through technology partnerships, joint ventures, and know-how transfer arrangements.
Under the MACR framework, each of these technology links to PFE entities constitutes a potential compliance risk, which can be mitigated by manufacturer certifications, due diligence, and the availability of supply-chain records. As discussed in Section 4.1.2, IRS guidance does not require automatic full-chain tracing absent red flags, so whether these technology links can be detected remains uncertain. The technology trap is therefore not simply a matter of where production occurs. Rather, it reflects the extent to which China’s competitive advantages in cost, scale, process expertise, and vertically integrated equipment production are embedded throughout the global battery supply chain. Geographic relocation alone cannot remove these dependencies.
5. Scenario Analysis: Three Paths for US Battery Manufacturing
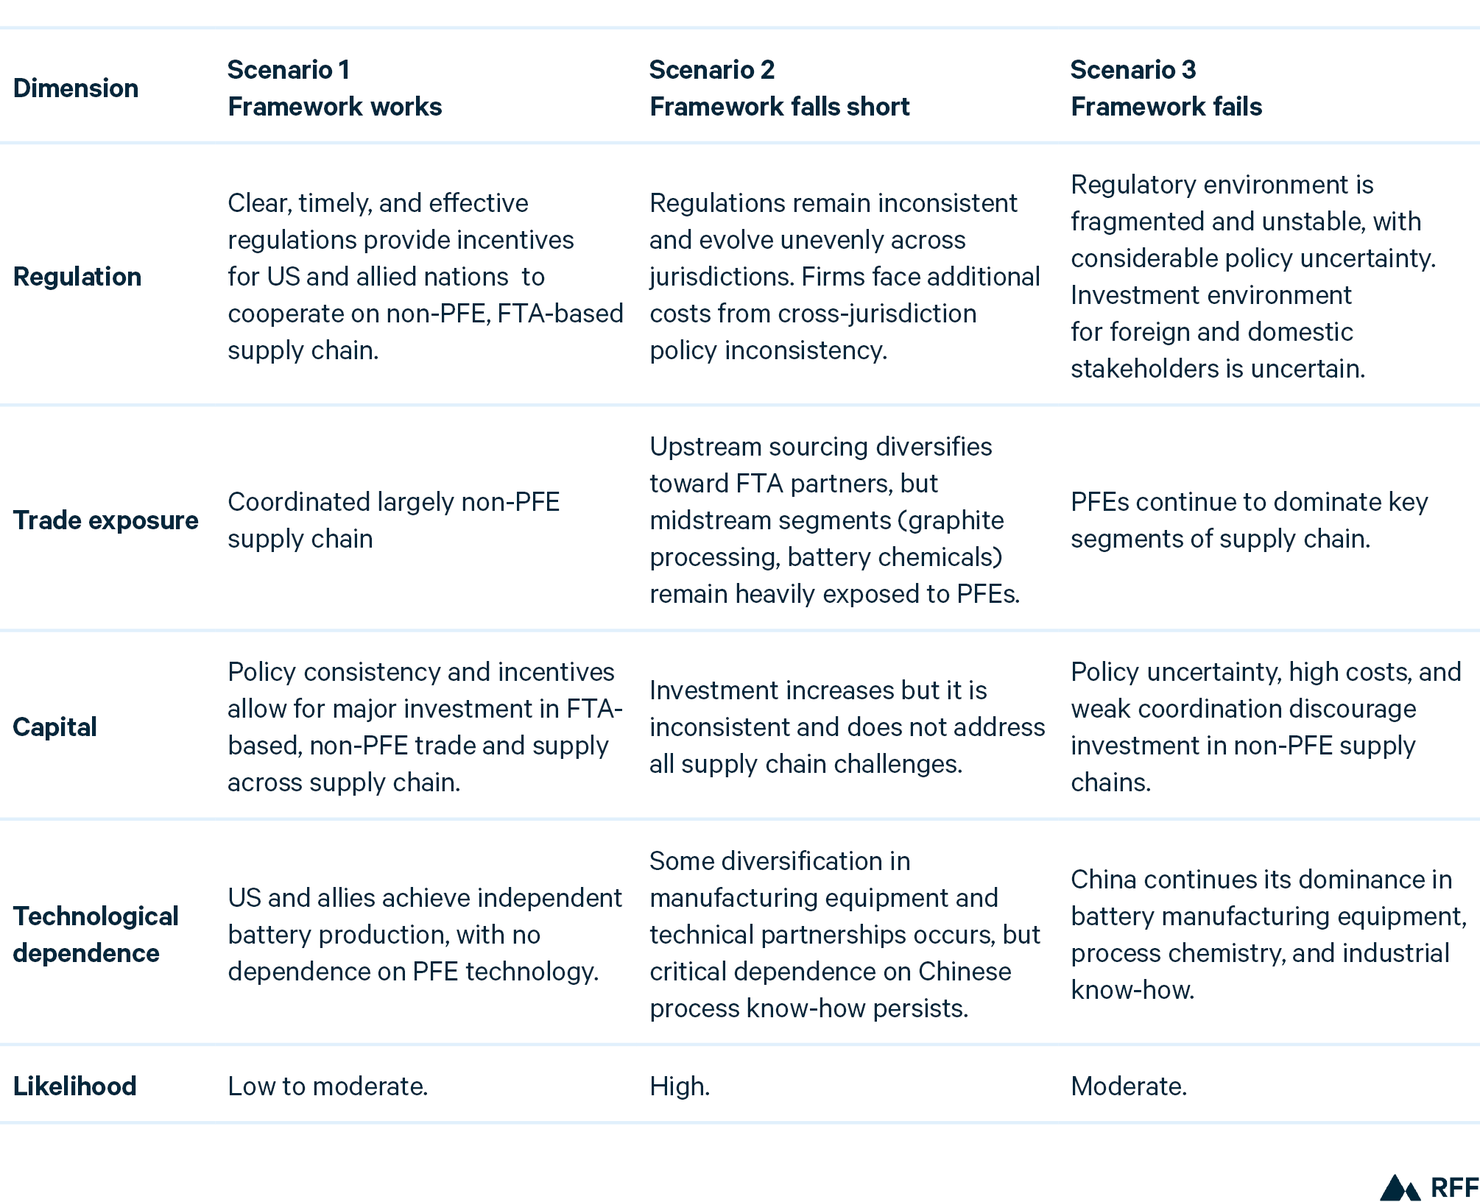
The following scenarios are used to assess the extent to which the MACR framework can achieve its policy goals, achieve mixed results, or fail to operate as an effective incentive. The forces behind each path, including regulatory friction, trade exposure, capital gaps, and technological dependence, are already shaping industry dynamics, suggesting that these scenarios represent credible future trajectories. The scenarios are summarized in Table 7.
5.1. Scenario 1: The Framework Succeeds and an Adequate Friendshored Supply Chain Emerges
The United States and its allies expand non-PFE processing and manufacturing capacity, allowing battery producers to meet rising MACR thresholds and reduce dependence on Chinese-controlled supply chains. Allied governments and the United States coordinate effectively on midstream industrial policy. Non-PFE graphite processing, LFP cathode production, and electrolyte supply scale in time to allow manufacturers to clear the 2026 and 2027 thresholds while building toward 2028 and beyond. Public-private partnerships, sustained manufacturing incentives, and supply chain traceability systems reduce both cost and compliance uncertainty. Manufacturers restructure PFE licensing agreements early and develop alternative process technologies through allied R&D partnerships.
Likelihood: Low, at least in the near term. The building blocks exist, but not with the necessary scale or cost competitiveness. Policy consistency and capital deployment have not materialized quickly enough.
Watch for: Expansion announcements from non-PFE graphite processors, FTA-based cathode supply agreements, and sustained Department of Energy financing commitments.
5.2. Scenario 2: The Framework Expands Friendshored Capacity, But Not Fast Enough
The United States and its allies make meaningful progress toward diversifying LFP supply chains, but the pace of industrial development does not expand critical midstream capacity fast enough to meet rising MACR thresholds. Upstream sourcing increasingly shifts toward domestic producers and FTA partners, allowing manufacturers to meet the 2026 and 2027 requirements with manageable effort. However, the most difficult segments of the supply chain—graphite processing, electrolyte salts, and LFP cathode active materials—remain heavily dependent on Chinese production networks or technologies.
Investment in non-PFE processing capacity continues, but expansion is uneven and insufficiently coordinated. Shifts in policy signals impede long-term supplier commitments. The infrastructure needed to replace Chinese graphite processing, electrolyte production, and cathode manufacturing scales more slowly than anticipated. As MACR thresholds rise to 70 percent and then 85 percent, manufacturers that appeared compliant in the early years find themselves increasingly exposed to midstream bottlenecks and sourcing constraints.
Likelihood: High. This is the most plausible near-term trajectory. The 2026 and 2027 thresholds appear achievable for many well-capitalized manufacturers, but the sharp increase in requirements thereafter represents a structural challenge that current investment trends are unlikely to overcome.
Watch for: Delays in non-PFE graphite qualification, limited announcements of FTA-based electrolyte and cathode supply agreements, continued reliance on Chinese processing capacity, persistent scarcity of MACR-compliant cell components, expiration of safe-harbored equipment and capacity before compliant replacements come online, widening bifurcation between well-capitalized manufacturers able to secure compliant supply and those unable to do so, and manufacturers’ increasingly incorporating MACR compliance risk into project financing decisions (Wood Mackenzie Power and Renewables and American Clean Power Association 2026; Anderson 2026).
5.3. Scenario 3: The Framework Fails and US Manufacturers Remain Dependent
Investment in domestic and allied supply chains do not overcome the structural advantages of existing PFE-linked production networks. Policy uncertainty, high capital costs, and weak international coordination discourage sustained investment in non-PFE processing and manufacturing capacity. Chinese dominance in battery manufacturing equipment, process technologies, and critical midstream inputs remains largely intact, leaving manufacturers with few viable alternatives.
As compliance thresholds tighten, the gap between policy requirements and available supply chain capacity continues to widen. For many manufacturers, achieving compliance requires sourcing changes, technology substitutions, and capital expenditures that cannot be justified economically. The Section 45X credit remains available in principle but becomes unattainable in practice for much of the industry.
MACR fails to function as an incentive. Some manufacturers do not reach the point of forfeiting credits– they never attempt compliance at all. If early supply chain assessments reveal that the required thresholds are beyond reach, firms will absorb the loss of incentives rather than undertake costly and uncertain restructuring efforts. Others will scale back domestic investment plans, delay projects, or shift production to jurisdictions where compliance constraints are less restrictive. Rather than catalyzing diversification, the framework increasingly reflects the underlying absence of viable non-PFE alternatives.
Likelihood: Moderate. This outcome becomes more likely if the expansion of non-PFE midstream capacity, particularly in graphite processing, cathode active materials, and electrolyte production, continues to lag behind the rising compliance thresholds. The risk is likely to emerge through a gradual erosion of confidence in the commercial viability of compliance.
Watch for: Delays in qualifying non-PFE graphite and cathode suppliers, persistent dependence on Chinese midstream inputs, low uptake of tax credits, , and manufacturers’ statements indicating that compliance requirements are difficult to meet under current supply chain conditions.
Table 7. Scenario Comparison
6. Policy Implications
As current and future administrations consider policies and strategies to achieve resilient domestic supply chains for lithium iron phosphate batteries, the following observations about the material assistance cost ratio policy may provide support.
6.1. Compliance Requires More Than Geographic Diversification
Supply chain diversification and supply chain independence are not necessarily the same thing. As production shifts toward allied countries, questions of ownership, technology licensing, and contractual control become increasingly important for determining whether dependence on prohibited foreign entities has actually been reduced. This traceability challenge may become more significant as compliance thresholds rise. In free-trade-agreement countries like Peru and Australia, Chinese investment is already embedded in significant mineral projects. Although the material assistance cost ratio requirements of the OBBBA consider ownership and control relationships, supply chain complexity may create implementation challenges. Continued refinement of traceability and disclosure requirements could improve the ability to verify compliance as firms diversify production across allied countries.
6.2. Midstream Capacity Is the Critical Constraint
The analysis suggests that the barriers to compliance with the material assistance cost ratio requirements of the OBBBA are concentrated in the midstream of the supply chain, where the raw materials are processed. Although some upstream resources can be sourced from domestic or allied producers, the processing and manufacturing stages that transform those materials into battery-grade inputs remain heavily concentrated in China. As a result, the feasibility of achieving high levels of content not sourced from prohibited foreign entities depends less on the availability of raw materials and more on the pace at which processing capacity independent of prohibited foreign entities can be developed.
6.3. Policy Consistency and Capital Access Enable Diversification
Policy consistency and capital flow will be the main determinants of compliance with material assistance cost ratio requirements because expanding midstream capacity requires substantial long-term investment. Stable policy signals encourage firms to commit capital by reducing regulatory uncertainty and improving project economics through incentives like the Section 45X Advanced Manufacturing Production Credit. Although these incentives may not always eliminate the cost advantage of Chinese suppliers, they narrow the gap and improve the business case for domestic and allied production. Moreover, firms often evaluate these investments not solely on short-term production costs but also on such strategic objectives as supply chain resilience, reduced geopolitical exposure, and long-term technological independence.
Policy consistency also supports technological development by providing the foundation necessary for governments and firms to make long-term innovation investments. Government loan programs, grant mechanisms, and public-private partnerships can help spur geographically diversified innovation and industrial capacity. At the same time, it may be more appropriate for policymakers to prioritize market independence rather than complete technological independence, recognizing that some degree of global interdependence is both inevitable and economically efficient. Resilience may be better measured by the ability to access multiple reliable suppliers and avoid excessive concentration in any single market, rather than by full domestic control over every stage of the supply chain.
6.4. Compliance Timelines Should Reflect Industrial Realities
The most likely outcome is neither full compliance nor outright policy failure, but a middle path (Scenario 2), in which supply chains diversify meaningfully but critical midstream bottlenecks remain, and manufacturers make progress toward reducing dependence on PFEs yet struggle to meet increasingly stringent compliance thresholds for accessing tax credits.
This finding highlights a potential mismatch between policy timelines and industrial capacity development. Policymakers should monitor whether the compliance thresholds are rising faster than processing capacity not associated with prohibited foreign entities can realistically grow. If midstream expansion continues to lag behind rising thresholds, the limited availability of incentives will delay progress toward diversification.