Advanced Clean Energy Infrastructure: Effects of the Draft Energy Infrastructure Act
This issue brief examines the potential effects the Energy Infrastructure Act, proposed by West Virginia Senator Joe Manchin, on advanced clean energy technology and infrastructure.
Introduction
Advanced energy technologies have received growing attention in recent years as nations look to decarbonize power sectors and drive dramatic emissions reductions goals. These low-, no-, and negative-carbon options may undergird power sector decarbonization, but they are more likely to be able to function at scale and in a cost competitive manner if they receive funding to support additional research, development, and demonstration (RD&D). The Energy Infrastructure Act, proposed by West Virginia Senator Joe Manchin, would appropriate funding for advanced nuclear, geothermal, diurnal storage, and carbon capture technology RD&D. The legislation would also appropriate funding for electricity transmission investment and for continued operation of existing nuclear power plants.
Funding for Advanced Energy Technology Research, Development, and Demonstration
Advanced energy technologies have the potential to enable the production of more reliable, less expensive clean energy, helping the United States—and the world as a whole—to reduce greenhouse gas emissions.
Proposed Actions
Sections 10001, 10002, 10004, and 10007 in the Energy Infrastructure Act appropriate funding for advanced nuclear, geothermal, diurnal storage, and carbon capture technology RD&D.
Results
Our analysis, which is based on results from Shawhan et al (2021), projects that the advanced energy technology RD&D funding provided by the act would result in significant benefits compared to a case with no such funding. The nature of the benefits depends on background policies, and we consider two sets of background policies. We call the first set “business as usual” or “BAU.” That set assumes that state and electric utility clean energy policies continue to become somewhat more stringent, but that there are no new national environmental policies. Against that policy backdrop, the main benefits of funding advanced nuclear, CCS, and geothermal RD&D is emission reductions, while the main benefit of funding diurnal storage and DAC RD&D is cost savings, especially for electricity customers.
The top half of Figure 1 shows the projected greenhouse gas emission reductions resulting in 2050 from one year of the RD&D funding, with BAU background policies, compared to emissions in the same year without the RD&D funding. On average across the technologies, the estimated benefits of the additional RD&D with BAU background policies are approximately seven times as large as its costs, under the assumptions in Shawhan et al. (2021).
Against the backdrop of a national clean electricity standard (CES), the main benefit of the added RD&D funding is cost savings, especially for electricity customers. The bottom half of Figure 1 shows the projected emission effects of the Energy Infrastructure Act funding against this policy backdrop. We assume that the CES quantity targets are reached. As a result, in our modeling results, the CES largely sets the national power sector emissions, and the main effect of making clean energy technologies less costly is to reduce costs. Against this policy backdrop, the average estimated benefits of the added RD&D are more than ten times the costs.
Figure 1. Estimates for Carbon Dioxide Equivalent Abated in the US Power Sector, per Year of Proposed Funding, Compared to Situation with No Funding (metric tons)
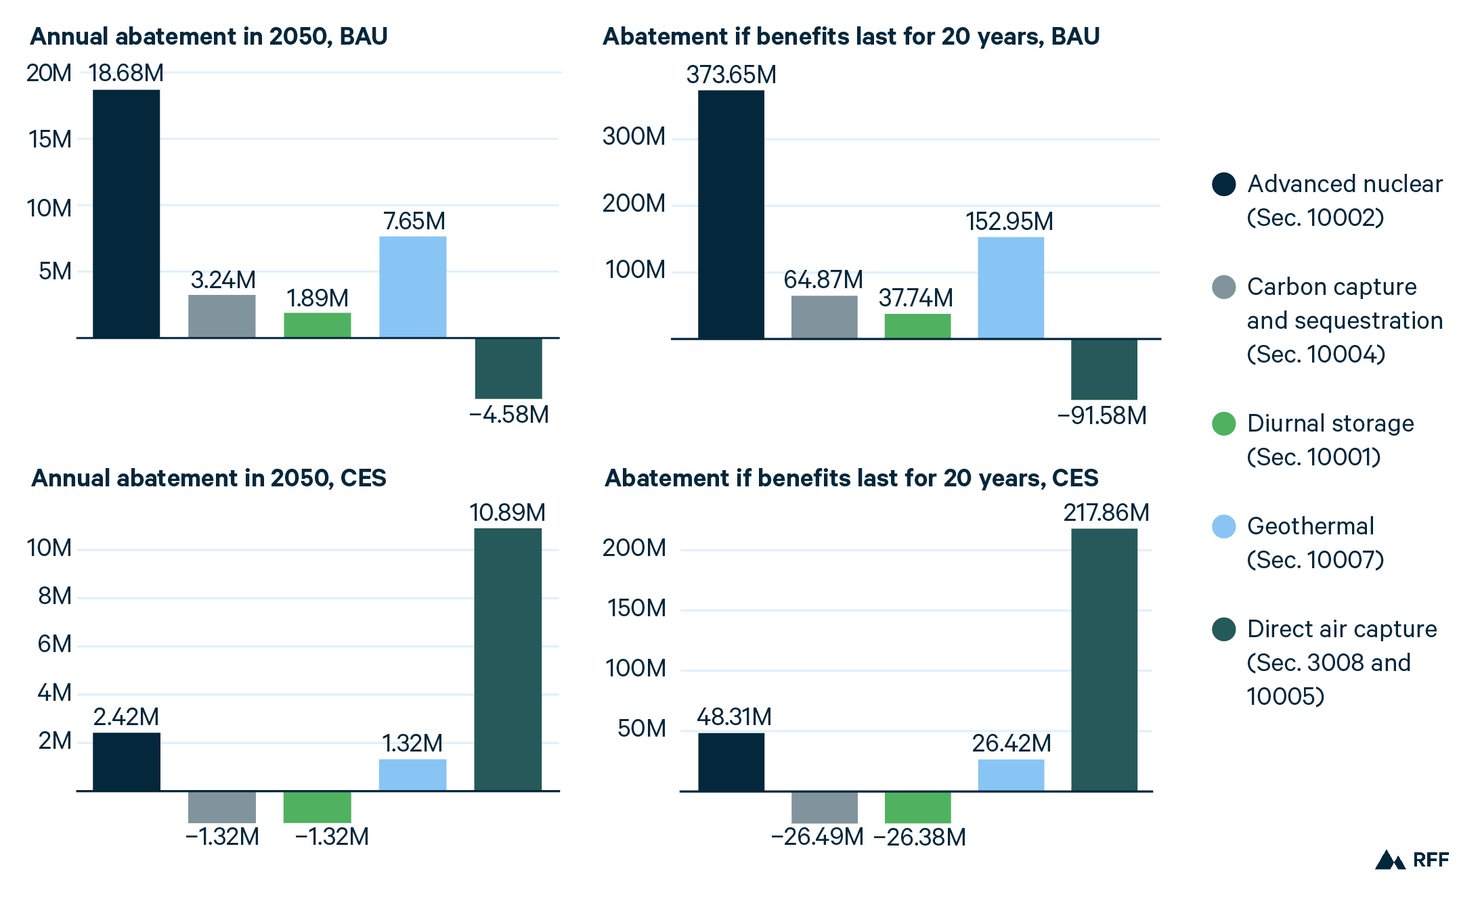
The results in Figure 1 reflect the assumption that only one technology at a time gets cheaper while all others stay the same. Thus, the results cannot be added together, as the total US power sector emissions reductions of reducing the costs of all examined technologies at the same time would be lower than the sum.
As mentioned above, it is important to note these estimates project the effects of RD&D funding in the Energy Infrastructure Act as compared with zero RD&D funding of this kind. The US Department of Energy has been funding RD&D for these technologies, and the amount of funding authorized for these technologies increased in December 2020 when the Congress passed, and President Trump signed, the Energy Act of 2020. Consequently, the funding proposed in the draft Energy Infrastructure Act might represent a reduction of RD&D funding—and hence a reduction of projected benefits—compared to the funding authorized in the Energy Act of 2020.
Shawhan et al. (2021) found indications that the benefits per dollar of RD&D funding could, in fact, increase with larger amounts of funding, because larger levels of funding make the technology more likely to be significantly less costly than the alternatives, and create a situation in which the technology can produce billions of dollars per year in estimated benefits.
The benefits estimated here are solely benefits in the US power sector. All five of the technologies are or could be valuable outside the US, as well as outside the power sector, so their global and economy-wide potential benefits may be many times larger.
Assumptions
Our analysis here is based on Shawhan et al (2021), which assesses the value of advanced energy funding in the United States and from which we estimated a benefit-to-cost ratio per dollar invested in RD&D for each of these advanced energy technologies. We distill the benefits of the draft Energy Innovation Act using the same assumed benefits breakdown from the study to estimate the environmental benefits. We further separate the environmental benefits into health and greenhouse gas abatement benefits.
Once we separate the greenhouse gas-only benefits, we divide these benefits by the social cost of carbon in 2050 to yield the estimated short tons of CO2 equivalent abated in that year in the US power sector. We multiply this estimate by 20 years to reveal a 20-year US power sector abatement estimate for each technology. We estimate these values using results of two policy scenarios from the study: business as usual (BAU) and under a national clean energy standard (CES).
We make several key assumptions based on work from Shawhan et al (2021) to estimate the US power sector emissions reductions of this RD&D funding. First, we convert the funding outlined in the bill (assumed to be nominal dollars) to 2020 dollars using a 1.4 percent assumed inflation rate and discounted to 2021 using a 3 percent discount rate. Then, we assume that the proposed funding levels would last for 10 years (as was assumed in the study) and divide these discounted costs by ten years to get an estimate of average annual RD&D funding in 2020 dollars. We then multiply the benefit/cost ratios in 2050 from the study of investing in RD&D funding for 10 years from FY2022–31 to estimate the dollar value of the benefits in 2050. Note that the ratios shown in Shawhan et al (2021) are based on societal costs, which are composed of additional RD&D costs and spillover private sector costs as predicted by experts. For this purpose, we adjust the ratios to include only the additional government RD&D funds. We also only include benefits in the year 2050 and assumed one-year costs, thus showing different ratios than those displayed in Shawhan et al (2021).
Transmission Construction and Upgrades
Investment in new transmission lines can enable rapid decarbonization of the electric grid. Reducing emissions from the power sector will require a significant investment in renewable energy like solar and wind, and more transmission can bring low-cost renewable energy sited in remote areas to load centers where electricity is consumed. Building new transmission can also help balance grid operations by interconnecting multiple regions.
Proposed Actions
Section 1007 of the Energy Infrastructure Act establishes a $2.5 billion revolving loan fund for the US Department of Energy (DOE) to serve as a figurative “anchor tenant” for construction of new transmission lines and upgrades for existing lines. As an anchor tenant, DOE would invest in these upgrades, helping total support and financing to reach the levels necessary for each supported new transmission line or upgrade to be built.
Results
Our analysis projects that the loan fund would result in an estimated 1.1 million metric tons of CO2-equivalent emissions reductions annually by its 25th year.
Figure 2. CO2-Equivalent Abated Per Year Through Government Investments in Transmission Lines (Metric Tons)
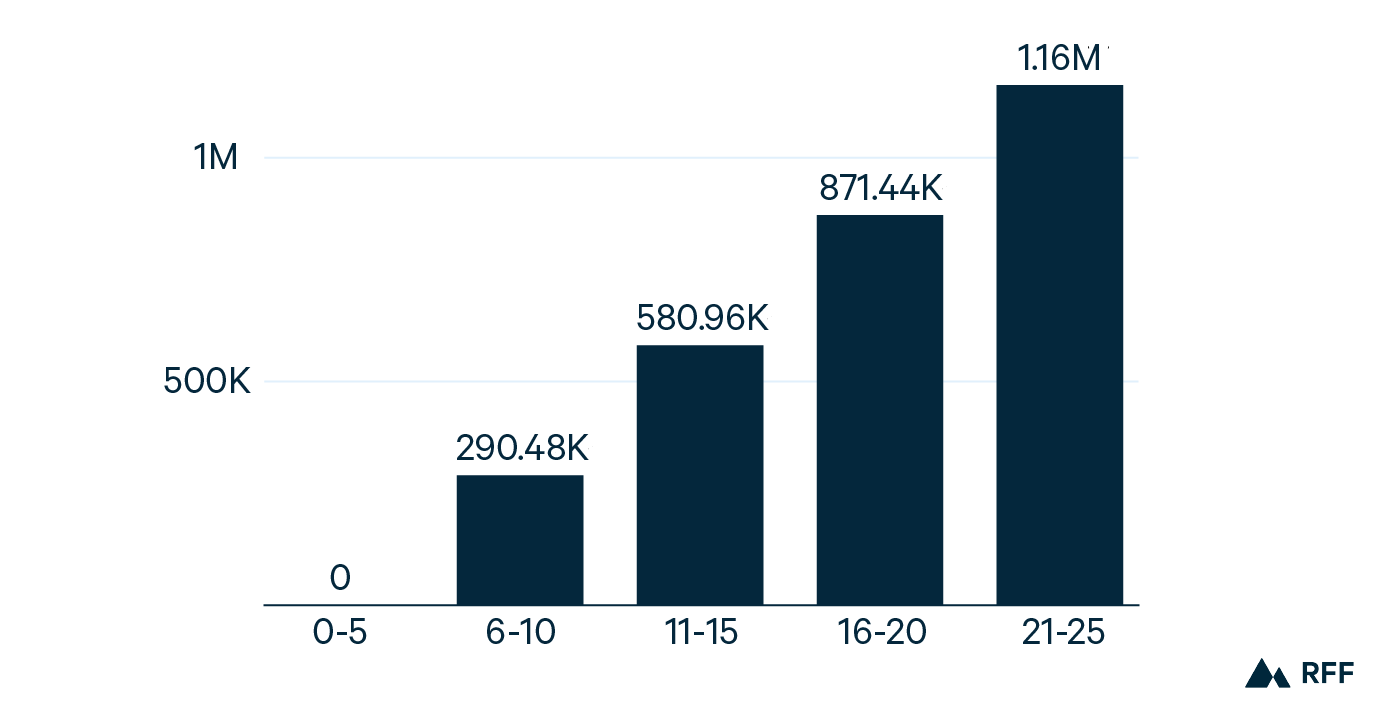
To estimate emissions reduction per dollar spent on transmission expansions, we use the results of preliminary RFF modeling of a national transmission macrogrid in the year 2035 with a capacity of 3 GW and a total length of approximately 6,000 miles. The resulting projected emission reduction is 60.75 short tons abated per year per GW-mile. We estimate the costs of building the macrogrid using estimates from EIA (2018). We then divide the cost of building the macrogrid by the GW-miles of capacity in the macrogrid to yield a cost of $948,623 per GW-mile, which we use to compare to the value of the proposed revolving loan fund.
We assume that if the government funds 25% of the total cost, the new lines being financed by the loan fund at any given time will cost $10 billion, which would fund about 10,542 GW-miles of transmission. We multiply the emission abatement per GW-mile by the total estimated GW-miles that would result from the revolving loan fund to reveal emissions abated per year.
In our modeling, even without a national CES, emissions are largely set by state, regional, and utility policies, so the main benefits of the added transmission are not emission reductions but rather cost savings from enabling the use of less costly generation. These cost savings are large—in our modeling results, the estimated benefits of added transmission capacity exceed the costs by a factor of between 2 and 4.
Assumptions
To estimate the carbon benefits of the proposed fund, we make several key assumptions. First, we assume that the funds will be used to build new transmission lines and upgrades only, and that DOE will need to lend the funds for five years before turning over its stake in the line to other buyers or funders and lending the funds to a different transmission project. We also assume that the DOE loan covers 25% of the total cost, and thus the cost of the line or lines built with the funds will be four times the value of the fund. Lastly, we assume that 50% of the lines built will be additional, meaning that 50% of the lines that receive funds would not have been built without government support, and thus only half of the total estimated emissions benefits of the new lines are considered additional as a result of the revolving loan fund.
The Civil Nuclear Credit Program
Nuclear power plants generate energy without emitting greenhouse gases, but many plants in the US are currently unprofitable or at risk of becoming unprofitable and consequently shutting down. Modeling in Shawhan and Picciano (2019) projects that retiring nuclear power plants would be replaced almost entirely by natural gas-fueled generation. Subsidizing nuclear power plants with government funds can allow this carbon-free resource to remain online.
Proposed Actions
Section 3203 of the Energy Infrastructure Act allocates $6 billion to fund nuclear plants to prevent them from retiring—$1.2 billion annually from FY21 through FY25.
Results
Our analysis projects that the $1.2 billion per year of funding for nuclear power plants provided by the act could preventing the closure of nuclear plants that have a total capacity of 37 GW. This would result in an estimated 116 million metric tons of emissions reductions per year relative to the situation in which that nuclear capacity is unsubsidized.
We rely on estimates from Shawhan and Picciano (2019) for this analysis. The estimates present the annual funds necessary to maintain all unprofitable nuclear plants located within RTO regions that have mandatory capacity markets (as proposed by Secretary of Energy Perry). Shawhan and Picciano (2019) finds that if all unprofitable nuclear plants were subsidized just enough to cover their going-forward costs, $900 million would be needed annually to save the 20 GW of nuclear capacity that was otherwise projected by the model to retire in those regions. The total nuclear capacity in those regions is 38 GW.
We solve for the estimated capacity that could be saved with $1.2 billion annually assuming both a uniform-price auction with asking prices equal to uncovered going-forward costs (“Uniform Subsidy”), and an arrangement in which each subsidized unprofitable nuclear plant is subsidized only enough to cover its otherwise uncovered going-forward costs and only the least needy of the plants requiring subsidization are subsidized (“Minimum Subsidies”). Both of these sets of assumptions are idealized, and the real-world subsidies might be larger, and the amount of capacity preserved consequently smaller, than under these assumptions.
Requiring plants receiving subsidies to provide transparency into their accounting can make the results close to the optimal results under idealized assumptions; it can greatly increase the efficiency of either type of program. Without requiring financial transparency from these plants, either type of program would likely be subject to very significant overpayments to generators and much less capacity saved and emissions reductions.
Assumptions
We assume that the portion of the national nuclear fleet that would be unprofitable is the same as the portion unprofitable in the regions considered in the Shawhan and Picciano (2019) study, which is about 53 percent of 100 GW, or roughly 53 GW. We assume that the average subsidy needed to keep unprofitable generators online is the same as that found in the study, or $45 million per GW per year, and we assume a linear supply curve with the highest subsidy need being $90 million per GW per year, which results in a supply curve slope of about 1.7 million dollars per GW. We also assume that the annual emissions abated per GW saved are consistent with the study results, or 3 million short tons per GW in 2025.
References
EIA (2018). Assessing HVDC transmission for impacts of non-dispatchable generation. https://www.eia.gov/analysis/studies/electricity/hvdctransmission/pdf/transmission.pdf
Shawhan, D. L., & Picciano, P. D. (2019). Costs and benefits of saving unprofitable generators: A simulation case study for US coal and nuclear power plants. Energy Policy, 124, 383-400.
Shawhan, D., Cleary, K., Funke, C., & Witkin, S. (2021). The Value of Advanced Energy Funding. RFF Working Paper 21-10.