Hidden Costs of Repealing EPA’s Carbon Pollution Standards: Consequences for the Environment, Households, and Society
This brief addresses the gap in the EPA’s recent analysis of Carbon Pollution Standard repeal with an updated cost-benefit assessment showing health damages outweigh compliance cost savings and climate damages widen the gap.
On June 11, 2025, the US Environmental Protection Agency (EPA) proposed a repeal of the existing Greenhouse Gas Standards and Guidelines for Fossil-Fired Power Plants, hereafter referred to as the Carbon Pollution Standards (CPS). EPA’s repeal is part of the new administration’s deregulatory agenda for the US power sector, whose stated goals are to lower costs and to meet rising electricity demand. The proposed repeal would lead to measurable changes in outcomes for the nation’s electric power sector, especially when assessed in conjunction with the One Big Beautiful Bill Act (OBBBA) and updated electricity demand forecasts.
Policymakers and the public alike are paying attention to the action’s likely result of slowing US greenhouse gas emission reductions. In this issue brief, we consider the economic costs of the greenhouse gas emissions unabated due to this repeal and evaluate other costs and benefits for the US population from the proposed repeal using updated data.
Indeed, according to our analysis: if the EPA conducted a cost-benefit analysis using updated electricity demand projections and including the electricity tax credit changes from the OBBBA, then the repeal of the CPS would fail a traditional cost-benefit test—even without factoring in the increase in greenhouse gas emissions.
With the repeal of the CPS, US residents will likely see:
- Increases in coal generation of 169–456 TWh by 2040, or 4.8–8.7 times as much coal generation as was expected with the regulations in place.
- An increase in cumulative CO2 emissions from the power sector by 1.2–5.8 gigatons by 2050.
- A net increase of 2.1–3.3 percent annually in national average electricity prices from now to 2050. This combines the 1–1.4 percent decrease from CPS repeal with the OBBBA increases of 3.3–4.7 percent over the same period.
- Net increases in average net household electricity costs of $67–$97 per year in the 2030s, driven by the CPS’s decreases of $19–$24 annually and the OBBBA’s increases of $87–$121 annually over the same time period. However, CPS repeal savings for households increase in the 2040s to $34–$44 annually on average per household over the decade due to coal plants remaining online.
- Increases in health damages that exceed the savings from lower compliance costs. The climate and health damages from this regulatory repeal will be 4–8 times the savings from reduced compliance costs across the modeled sensitivities. Considering solely the health effects along with the power sector’s financial outcomes, there is a total net cost of $128.9 billion (2024 US dollars) through 2050 to US society in our central case.
1. Modeling and Regulatory Context
EPA’s 2025 Regulatory Impact Assessment (RIA) of the proposed rule to repeal the CPS repurposes analysis from 2024 that justified the original rulemaking (EPA 2025; 2024a). Since 2024, the power sector has faced a variety of new stressors. First, current and expected electricity demand growth is higher than was anticipated in 2024. The Energy Information Administration (EIA), which is the source of electricity demand projections for EPA’s 2024 RIA, released an updated forecast of electricity demand growth in the United States in its 2025 Annual Energy Outlook (AEO) that presents an average annual growth rate twice as high as that in the RIA forecast. Second, international and domestic fossil gas markets have greater uncertainty given ongoing geopolitical conflict in Europe and the Middle East, trade renegotiations, and the uncertain energy market impacts of the Administration’s goal to “unleash American energy”. Finally, Congress passed the OBBBA, weakening the tax credit incentives for investment in renewables and enhancing the incentive for investment in carbon capture and sequestration originally enacted as part of the Inflation Reduction Act (IRA) that became law in 2023.
This issue brief incorporates the updated legislation as well as EIA’s updated electricity demand forecast in our modeling analysis. We also consider sensitivities of high and low fossil gas prices as well as an additional high-demand scenario to account for broader uncertainty in the power sector. We quantify the impacts of repealing the CPS on the environment, households, the power system, and society in the United States.
EPA finalized the CPS in 2024 under Section 111 of the Clean Air Act. These standards place emissions requirements on existing coal generating facilities and new fossil-gas generating facilities. Section 111 requires EPA to identify the best system of emissions reductions (BSER) as a benchmark for the emissions standard that facilities must meet or exceed to comply with the regulation. The BSER can vary by type of facility based on characteristics such as fuel type, technology, output, and vintage. Figure 1 shows a summary of CPS emissions standards and the BSER they are based on. Facilities can comply with the emissions standard by cofiring with other fuels, reducing generation, adopting emissions controls technology, retiring capacity, or other methods that enable the facility to meet the emissions rate.
Figure 1. Carbon Pollution Standards for Fossil-fueled Power Plants
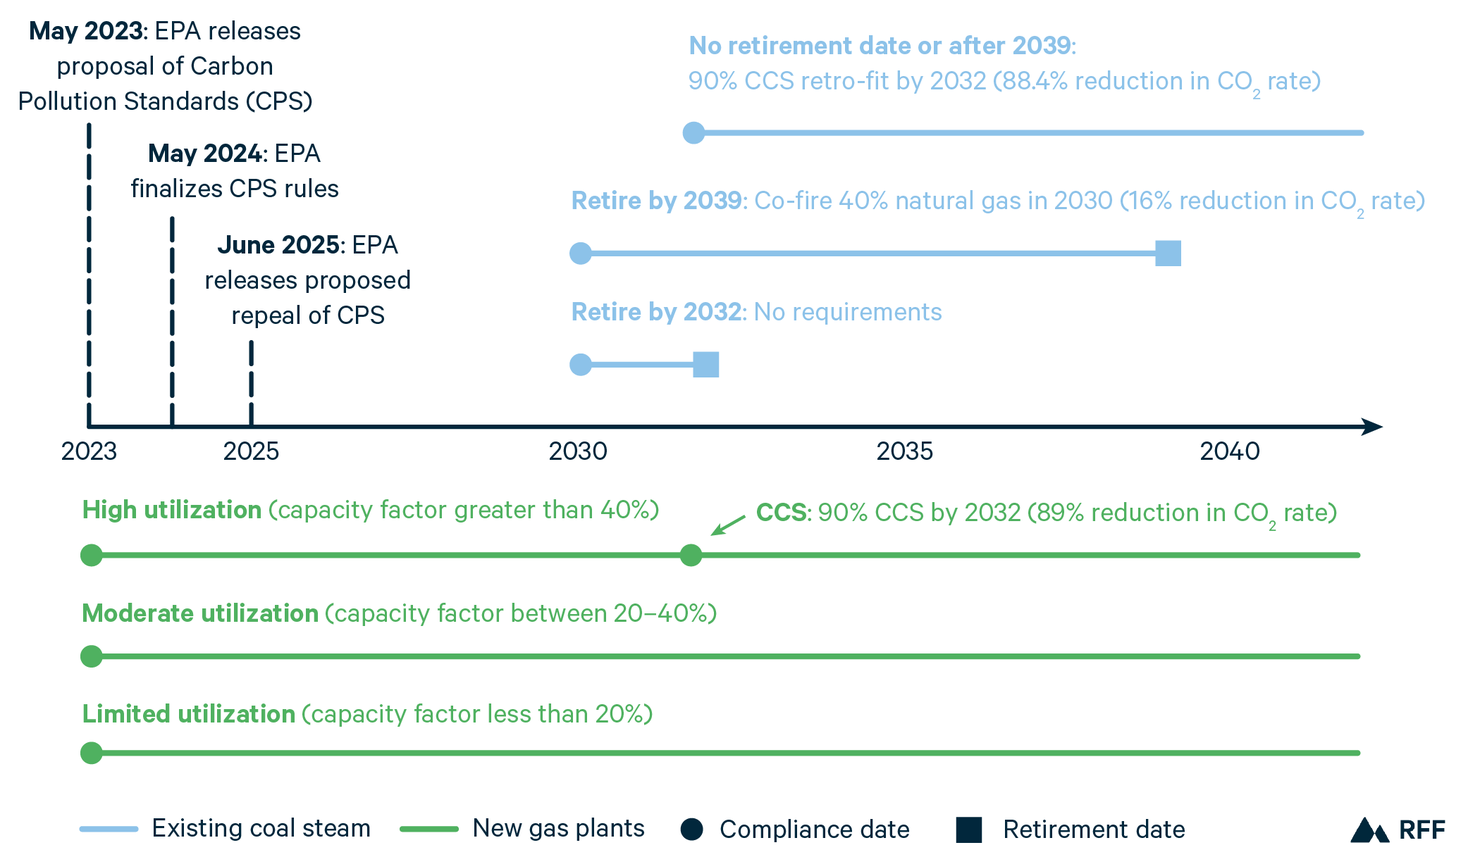
Notes: States may consider remaining useful life and other factors to address exceptional circumstances at individual coal units. CCS = Carbon Capture and Storage.
Source: Bistline et al. 2025.
US power sector CO2 emissions, with the CPS in place, were projected to fall 73–86 percent below 2005 levels in 2040 and increase electricity prices by 2.2 percent in the same year according to a multimodel analysis (Bistline et al. 2025). This previous analysis was conducted under the assumption that the IRA would remain in place, so it does not reflect the OBBBA’s higher tax credit for carbon capture for enhanced oil recovery or the phasedown of tax credits for renewables. By contrast, our analysis includes the OBBBA and interprets the “commence construction” provisions of OBBBA as being sufficiently achievable as to allow wind and solar projects projected to come online no later than 2029 to receive full tax credits. However, real-world conditions, as well as a recent executive order that could mean that wind and solar projects would not receive full tax credits effective immediately, may make our modeled emissions and price increases from the OBBBA conservative interpretations.
We use Resources for the Future’s (RFF) Haiku electricity market model to evaluate the effects of repealing the CPS, incorporating updated tax incentives and a few different electricity demand and fossil gas price sensitivities. In our high-demand scenario, we use the high electrification scenario from the National Renewable Energy Laboratory’s Electrification Futures Studies (Mai et al. 2017) to augment the updated EIA reference case demand forecast from AEO 2025. Our high and low fossil gas price scenarios are from EIAs 2023 forecast of low and high oil and fossil gas supply respectively. Central case gas prices also come from AEO 2023.
2. Power Sector Emissions and Generation
To measure the environmental impact of the repeal of CPS, we compute emissions differences between a baseline policy scenario that includes the CPS to a scenario without them. For each sensitivity of fossil gas prices and demand, we compare relevant outcomes to a baseline with the same corresponding input assumptions. All scenarios include the electricity tax incentive changes contained in the OBBBA.
Figure 2 displays the modeled CO2, SO2, and NOx emissions increases from the repeal of the CPS. Repealing the 111 regulations would increase cumulative CO2 emissions from the power sector by 1.2–5.8 gigatons by 2050. For context, this range is roughly equivalent to annual US power sector emissions of 1.5 gigatons and economywide energy-related CO2 emissions of 5.7 gigatons in 2022 (EPA 2024b). The fossil gas price sensitivities define the lower and upper bounds. The high-demand scenario diverges significantly from the central case cumulative CO2 emissions increase of 1.7 gigatons by bringing about an additional 1.3 gigatons of cumulative emissions between 2040-2050.
Figure 2. Power Sector Emissions Increases from Repeal of EPA’s Carbon Pollution Standards
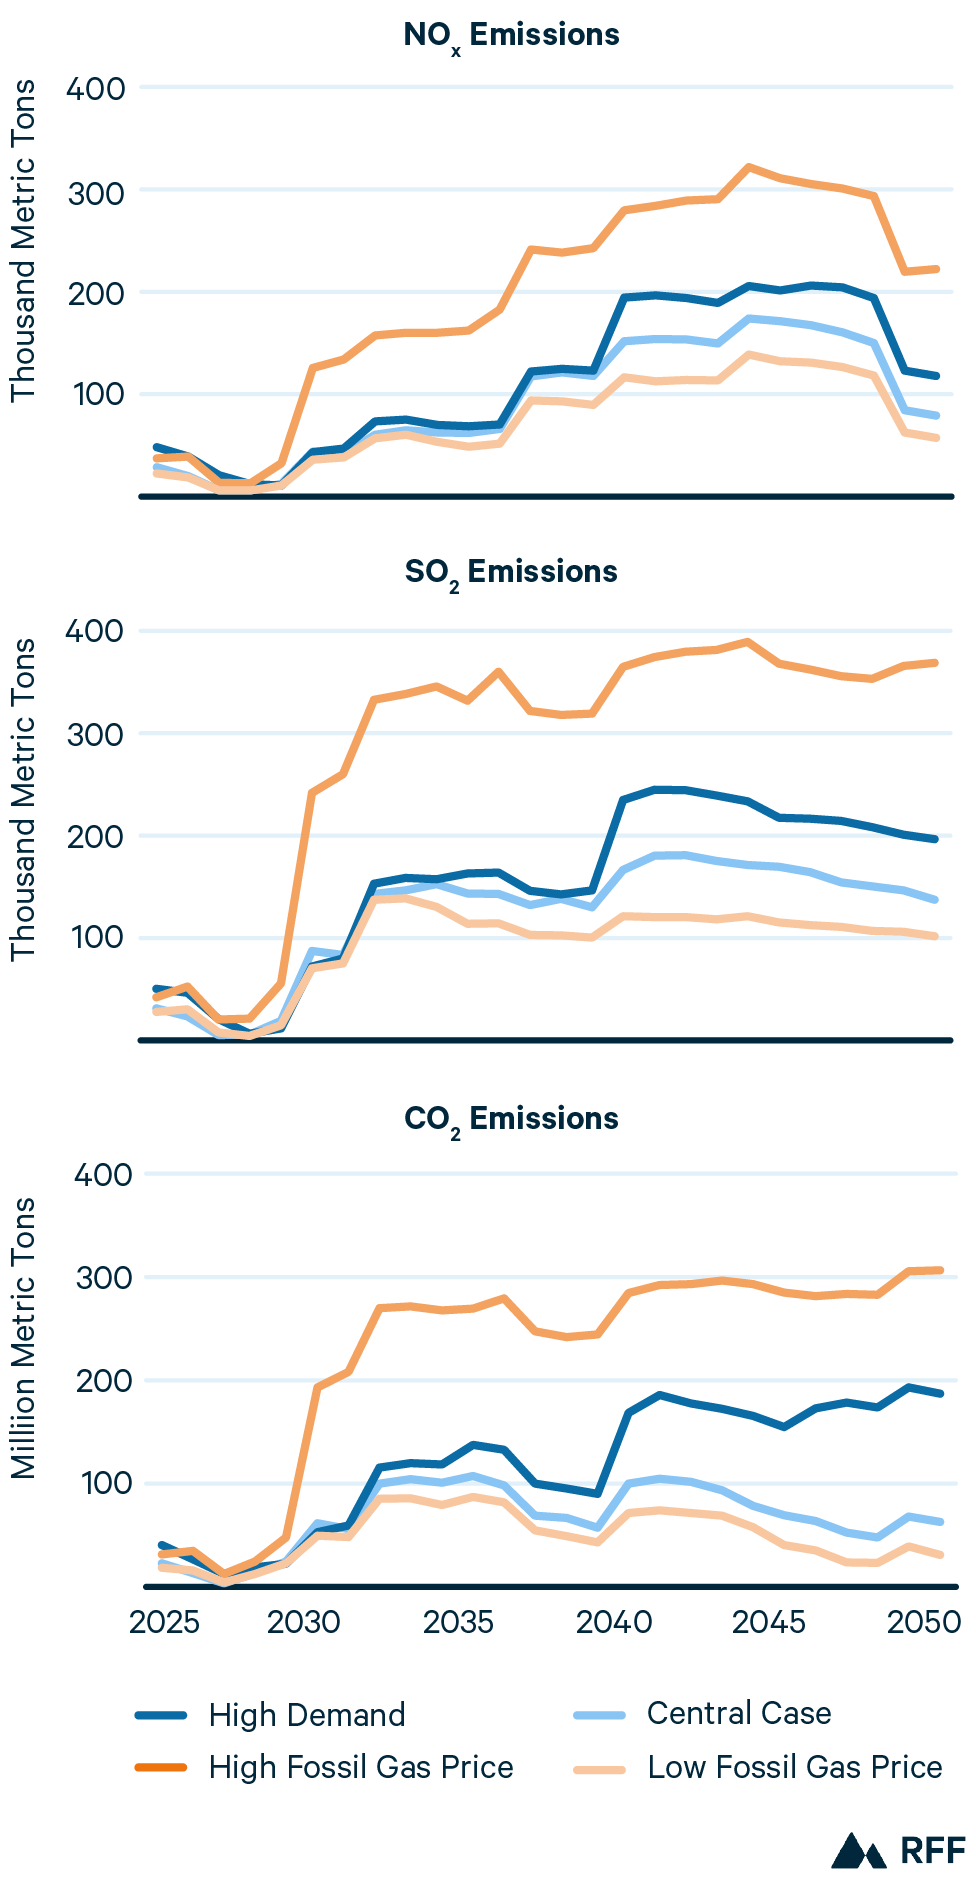
CO2 emissions translate into cumulative climate damages of approximately $109–497 billion (2024 US dollars) when we use a social cost of carbon estimate that discounts future benefits at 3 percent (Rennert et al. 2022). For a 3 percent discount rate the social cost of carbon is $104 (2020 US dollars) per metric ton in 2030. This social cost of carbon estimate is lower than the value EPA used for the 2024 RIA.
The CPS were also expected to yield substantive health benefits from the reduction of SO2 and NOx emissions, which contribute to local air pollution and the concentration of fine particulates (PM2.5). By repealing the CPS, average annual SO2 emissions are set to increase anywhere from 93–285 thousand metric tons alongside an increase in the average annual NOx emissions from 73–194 thousand metric tons. The net present discounted value using a 3 percent discount rate of future PM2.5 related health damages associated with CPS repeal ranges from $157-476 billion (2024 US dollars) across sensitivities. The most recent estimates of national average health damages per ton emitted of SO2 and NOx associated with their contributions to fine particulate pollution come from (EPA 2024c). We assume cost per ton grows linearly between the 5-year periods EPA reports. Emissions after 2040 are valued using the 2040 cost per ton estimate since estimates were not made available for after 2040. Values are adjusted from 2019 US dollars to 2024 US dollars using GDP deflators.
2040 is a pivotal date for the power sector in regards to the repeal of CPS. With this regulation in place, all coal plants without carbon capture technology would have to retire by 2040. When repealed, coal capacity without carbon capture technology remains online. Coal has higher content of CO2 and SO2 than fossil gas and zero-emissions technologies, driving the emissions increases in Figure 2.
Figure 3 displays the change in power generation, by fuel, from the repeal of the CPS. Across sensitivities, annual coal generation increases 169–456 TWh by 2040. As of 2023, there are 227 utility scale coal fired power plants, with net generation of 675 TWh in the same year. The average coal plant produces just below 3 TWh of generation annually in the United States. The range of changes in 2035 coal generation with repeal translates to the equivalent of 50–150 coal plants in 2023. For context that is 4.8–8.7 times as much coal generation as was expected with the regulations in place. Fossil gas price sensitivities also bound the extent to which coal generation increases. With central case assumptions, fossil gas generation decreases because coal serves a greater share of base load demand in the absence of the CPS. In the high-demand case, renewables that otherwise would have come online, even after tax credits expire, are instead displaced by additional generation from existing coal capacity, while usage of fossil gas remains relatively unchanged.
Figure 3. Power Sector Generation Changes from Repeal of Carbon Pollution Standards
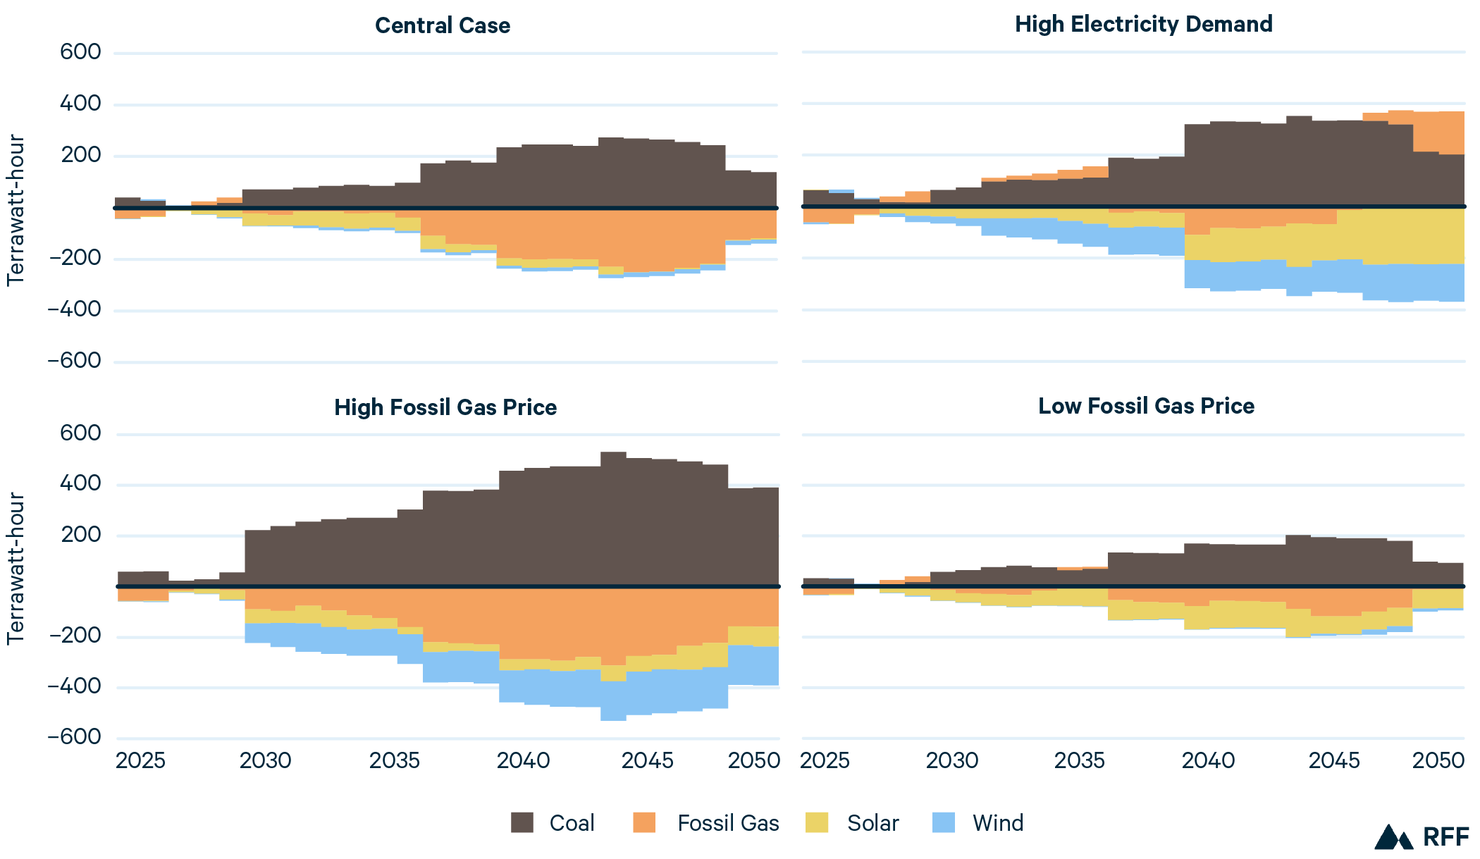
In analyses of the CPS done before the OBBBA and recent increase in demand growth, EPA (2024a) and Bistline et al. (2025) find that coal generation would be substituted by a combination of fossil gas and renewables. With higher demand projections and the changes to tax credits from the OBBBA, there are fewer renewables in the updated baseline; and substitution in the central case CPS repeal is primarily from fossil gas to coal. Except for the high-demand sensitivity, the CPS repeal is expected to lead to more coal generation and less fossil gas generation, with reduced substitution of renewables than was expected prior to the OBBBA, worsening health outcomes for US residents.
3. Electricity Prices and Household Electricity Bills
The costs of compliance with the CPS are typically either partially or fully passed on to ratepayers through electricity prices. Repealing the regulation undoes these potential price increases, resulting in benefits for ratepayers. Our analysis indicates that annual national average electricity prices will fall by 1–1.4 percent across the next 25 years from the CPS repeal. However, the OBBBA increases prices by 3.3–4.7 percent on average over the same period, leading to a combined effect of 2.1–3.3 percent increases to average annual electricity prices from 2025–2050.
To understand the cost savings households experience from CPS repeal, we examine the difference in retail electricity prices between scenarios with the CPS and scenarios without them. We then calculate the changes in household electricity expenditures from repealing the CPS. The CPS are not the only electricity policy change to impact households going forward; the OBBBA is also expected to result in substantial increases in electricity prices and consumer bills. Additionally, the CPS were originally implemented with the tax credits for carbon capture (which the OBBBA enhanced) in mind, and in the context of EPA expanding the emissions reductions and electricity price reductions from the IRA. For these reasons, we contrast the CPS impacts on electricity prices and household expenditures with the additional changes to both measures coming from the OBBBA.
Figure 4 shows the price changes across sensitivities from the OBBBA with the dotted lines, and from the combined effect of the OBBBA and CPS repeal with the solid lines. The OBBBA is expected to increase prices 2.7–3.9 times as much as the CPS repeal decreases prices.
Figure 4. Percent Change in Retail Price from the OBBBA and CPS
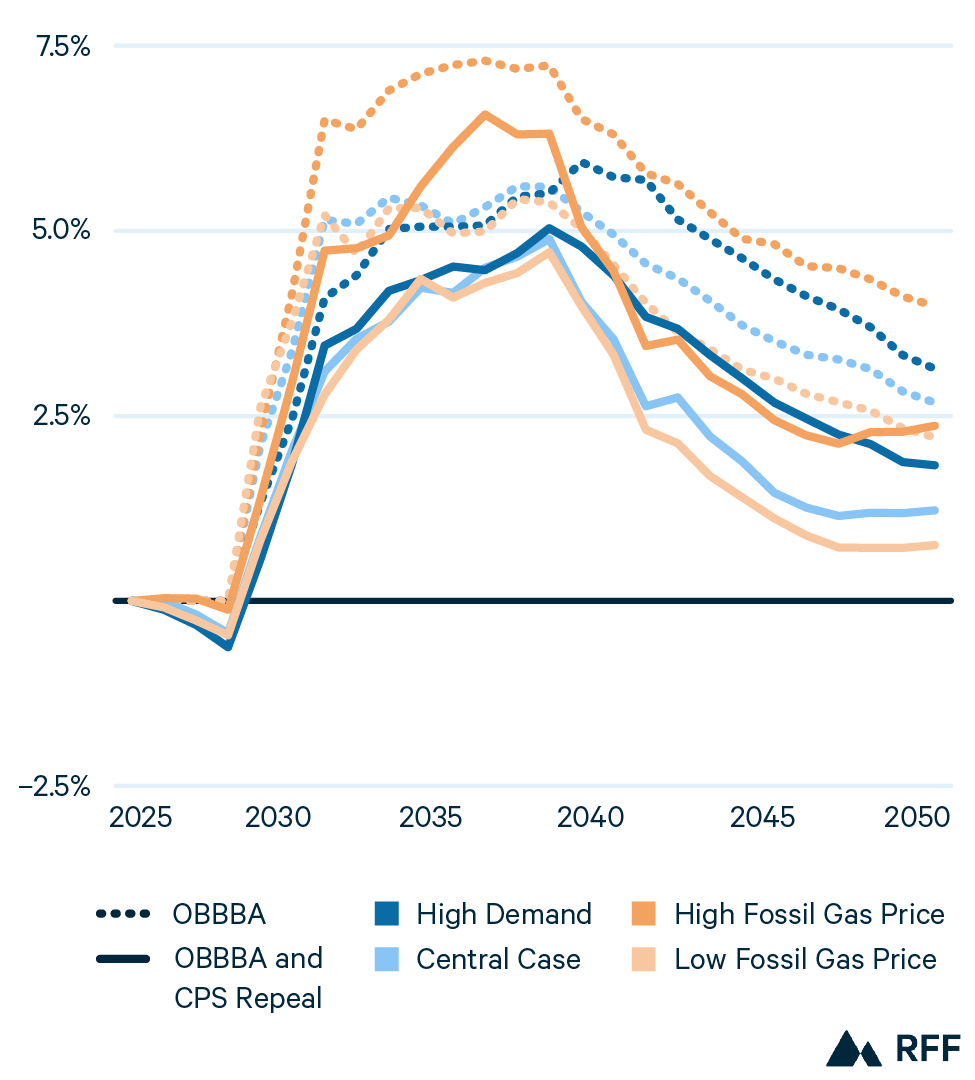
Note: OBBBA = One Big Beautiful Bill Act; CPS = Carbon Pollution Standards.
The largest electricity price impacts of the combined policies are expected after 2030 for two reasons. First, we assume projects starting construction before 2026 will be eligible to receive the clean electricity tax credits as long as they come online within 4 years with the tax credits passing through to households. If the US Treasury Department issues guidance that changes the definition of commence construction for renewable projects, then we’d expect greater price increases from the OBBBA and smaller decreases from CPS repeal. In general, our approach provides a lower bound estimate of the effect of the OBBBA on electricity rates and an upper bound estimate of the electricity expenditure reductions households experience under CPS repeal. Estimates from Energy Innovation, Princeton REPEAT Project, and previous RFF analysis have higher increases in percentage terms for retail prices due to earlier expected phasedowns of credits than this analysis assumes. Secondly, the CPS did not have requirements on fossil generation until 2030 at the earliest, so the cost savings we see before 2030 come from the minor changes in generation and capacity changes driven by changes in future compliance planning in our model.
Figure 5 shows the changes in average annual household electricity expenditure across each of the three periods as a result of both the passage of the OBBBA and the CPS Repeal. In the 2030s, the CPS repeal is projected to save households on average $19–$24 annually across sensitivities, while OBBBA is projected to cost households $87–$121 annually over the same time period. On net, the combined policies are expected to cost households $67–$97 per year in higher electricity bills. The savings from the CPS repeal are amplified in the 2040s, with savings averaging $34–$44 annually over the decade. These estimates assume number of households grows according to assumptions in the EIA AEO 2025 reference case. These cost savings 15 years down the road are from coal plants remaining online. Our analysis does not account for the potential costs of maintenance or other costs required for keeping aging fossil generators online.
Figure 5. Change in Average Annual Household Electricity Expenditure from OBBBA Passage and CPS Repeal (2025–2050)
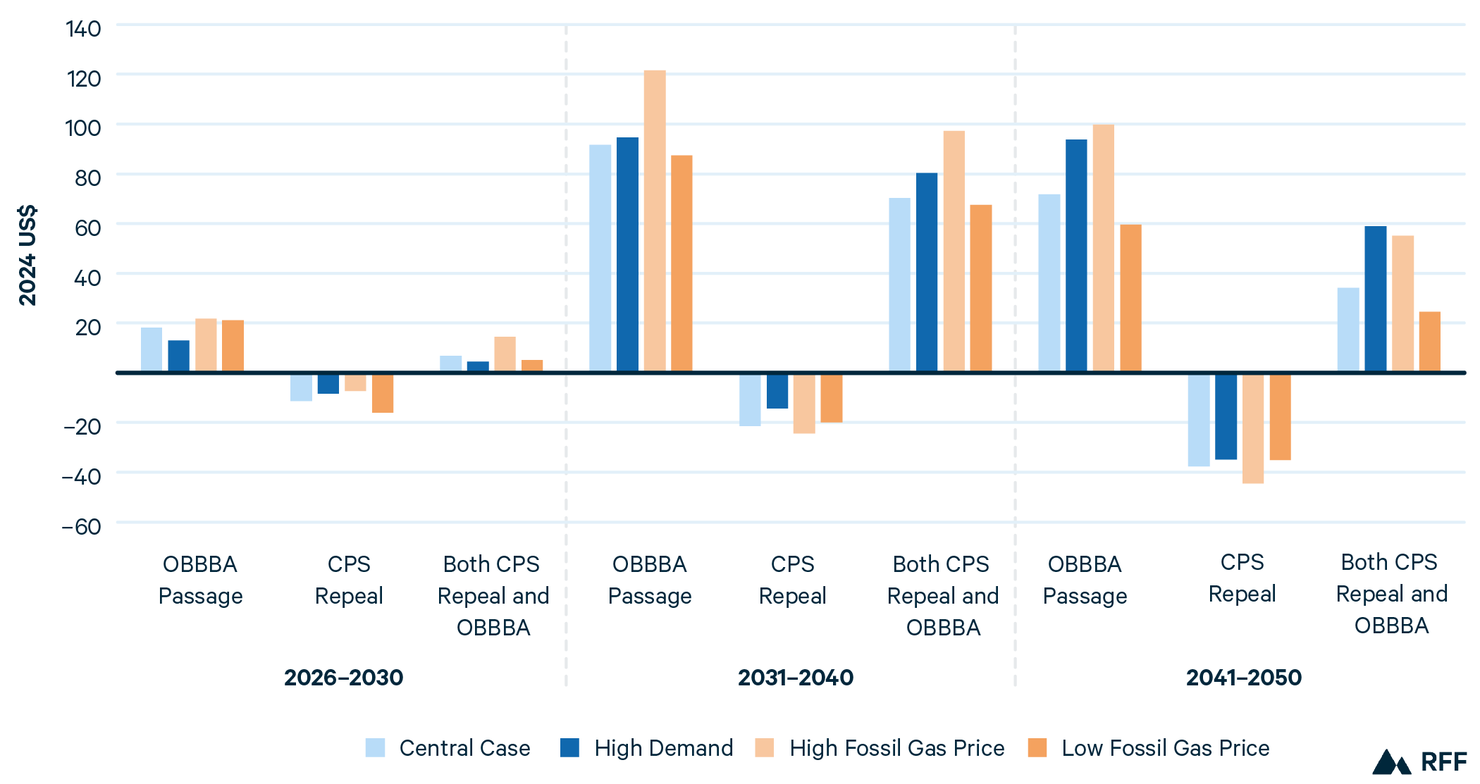
Note: OBBBA = One Big Beautiful Bill Act; CPS = Carbon Pollution Standards.
The scenario with the least savings from the CPS repeal is the high-demand scenario; and the scenario with the most savings is the low fossil gas price scenario. When considering the net impact of the OBBBA and the CPS repeal, low fossil gas prices lead to lower costs and high fossil gas prices lead to the highest costs. In combination, power sector policy changes from the OBBBA and CPS repeal functionally expose households to greater price volatility from global fossil gas markets that are subject to fluctuations from geopolitical conflict and trade tensions that we’ve seen rising in recent years (Peplinski and Roy 2025).
4. Cost-Benefit Analysis
Considering both climate and health damages, this regulatory repeal is expected to cost the United States $198–855 billion. These estimates are significantly higher than the current EPA RIA because they include an updated baseline of higher demand and lower renewable deployment that better reflects current conditions and because they include health and climate costs from the repeal that EPA did not reflect in its analysis.
EPA’s RIA for repeal of the CPS relies heavily on analysis from the original RIA conducted when the CPS was finalized, though including some consequential changes. The first is that the new RIA excludes consideration of climate damages from the regulatory repeal. The second is that EPA did not include the evaluated health damages associated with the regulation’s repeal in the topline net benefit numbers reported in the RIA. Here we use a similar methodology to EPA but, to have a more accurate estimate of the costs and benefits, include the excluded benefits, the recent changes to clean electricity tax credits, and update the assumptions about electricity demand growth.
To estimate compliance costs, we calculate the change in present discounted value, using a 3 percent discount rate, of total power system costs over the period of 2025–2050 with and without the CPS in effect. This calculation does not include subsidies, administrative costs, or transfers and is simply the cost of capital investment, operations and maintenance, and fuel. For health benefits and climate benefits, we use the same values for the social cost of carbon and costs per ton of SO2 and NOx as in the previous section to calculate the climate and health benefits respectively and then find the present discounted value for health and climate benefits separately.
Table 1 shows the total cost-benefit calculation of repealing the CPS under different sensitivities. As shown in the bottom rows of the table, the repeal is still net costly to society under all the sensitivities, with or without the climate benefits included. Health damages from air pollution are 2.3–4 times greater than avoided compliance costs across sensitivities. Inclusive of health and climate damages, costs of repeal are 3.9–8.25 times more than avoided compliance costs.
Table 1. Net Present Value Cost of Repealing EPA Carbon Pollution Standards, with a 3 Percent Discount Rate, by Sensitivity Scenario
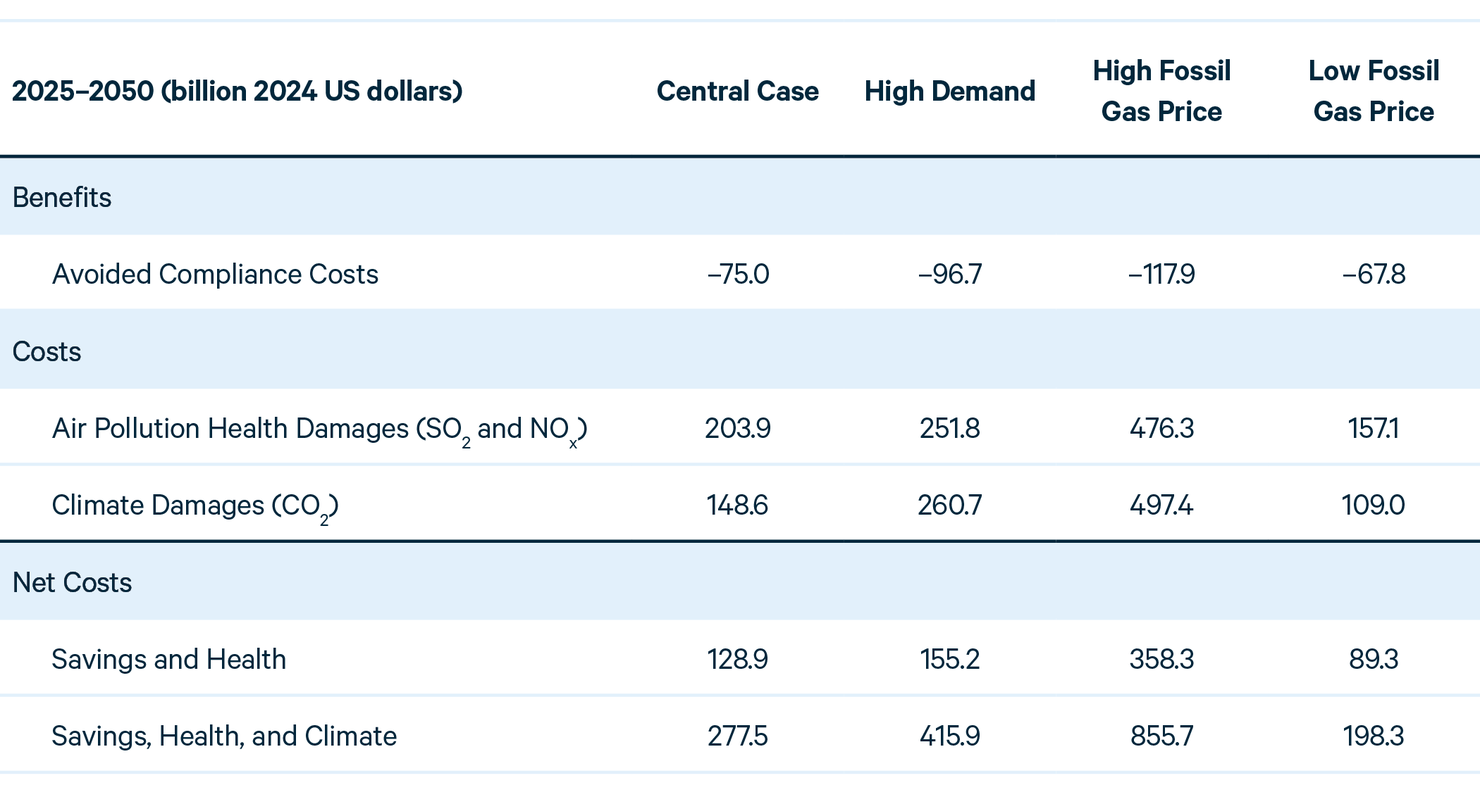
Note: Any comparison of particular numbers from this table to costs or benefit calculations made under other assumptions is potentially logically inconsistent as the benefits and costs herein are part of a single integrated economic modeling assessment.
EPA estimates the net present value resource cost savings, using the baseline from the 2024 RIA and a 3 percent discount rate, were $53 billion from 2026–2047. Our $75 billion avoided compliance cost finding is not directly comparable to EPA’s estimates because we include higher electricity demand, a longer time window (2025–2050), and updated assumptions around tax credits.
Fossil gas sensitivities bookend the range of health, climate, and avoided compliance cost estimates from repeal with low gas prices leading to the lowest cost savings and the lowest avoided damages and the opposite being true for high fossil gas prices. These results occur because the baseline scenario with the CPS in place has less coal generation when gas plants are cheaper to operate.
6. Conclusion
EPA’s assessment of the impacts of CPS repeal relies largely on its RIA when the rule was finalized but excludes the measurement of benefits which underly EPA’s previous analysis that found CPS to have greater benefits than costs to society. Underlying the policy justification of the CPS repeal is the idea that the United States will have higher electricity demand growth than previously anticipated and there is therefore a need to reduce costs on the power system and slow retirement of existing fossil generators to meet that additional demand. The effects of such enhanced demand growth are not incorporated into EPA’s analysis of the proposed repeal, leading to an inconsistency between the motivation for the repeal and the underlying analysis.
The effects of the CPS repeal on electricity consumers depend on the underlying policy framework. The modest price decreases arising from CPS repeal are more than nullified by the electricity price impacts of the OBBBA. In addition, the environmental effects of CPS repeal which are excluded from EPAs RIA are negative, with increases in emissions of SO2 and NOx resulting in health damages valued in the hundreds of billions of dollars over the next 25 years.
The overall cost benefit picture for CPS repeal indicates that repealing the CPS rule is not net beneficial even if only the health impacts of the additional SO2 and NOx emissions are considered, with increased health care damages ranging 2.3–4 times the size of the electricity cost savings. Including the climate damages from increased CO2 emissions under repeal tips the cost-benefit balance further in favor of preserving the CPS.