The European Union Emissions Trading System: What Can We Learn from the Proposed Changes to One of the World’s Longest-Running Carbon Pricing Policies?
This issue brief dives into key proposed changes to the European Union Emissions Trading System and their implications for several industrial products.
Introduction
On July 17, 2026, the European Commission published a proposal to revise the EU emissions trading system (ETS). ETS revisions tend to happen roughly every five years to account for changes in the European Union’s overall climate policy and the global economy. Earlier this year, the European Union confirmed its climate target for 2040 of reducing greenhouse gas (GHG) emissions by 90 percent relative to 1990. In this issue brief, we review some of the key proposed changes to the ETS design, especially as related to allowance allocation and other design elements that are relevant to industrial product regulation.
1. Allowance Supply: More Supply and a More Flexible Supply
As a cap-and-trade system, the EU ETS shrinks the allowance supply each year by a fixed amount—the linear reduction factor. Under the current trajectory, no new allowances would be issued after 2039. Under the proposed new trajectory, the cap is lowered more gradually, especially after 2036, so that it will not reach zero until 2048. For reference, in 2025, total ETS emissions were 1,009 metric tons of carbon dioxide equivalent, a 51.8 percent reduction compared to 2005 (the ETS launch year). Figure 1 shows the development of the ETS allowance supply and emissions covered by the system since 2013.
Figure 1. EU Emissions Trading System Allowance Supply and Emissions by Sector, 2013–2025
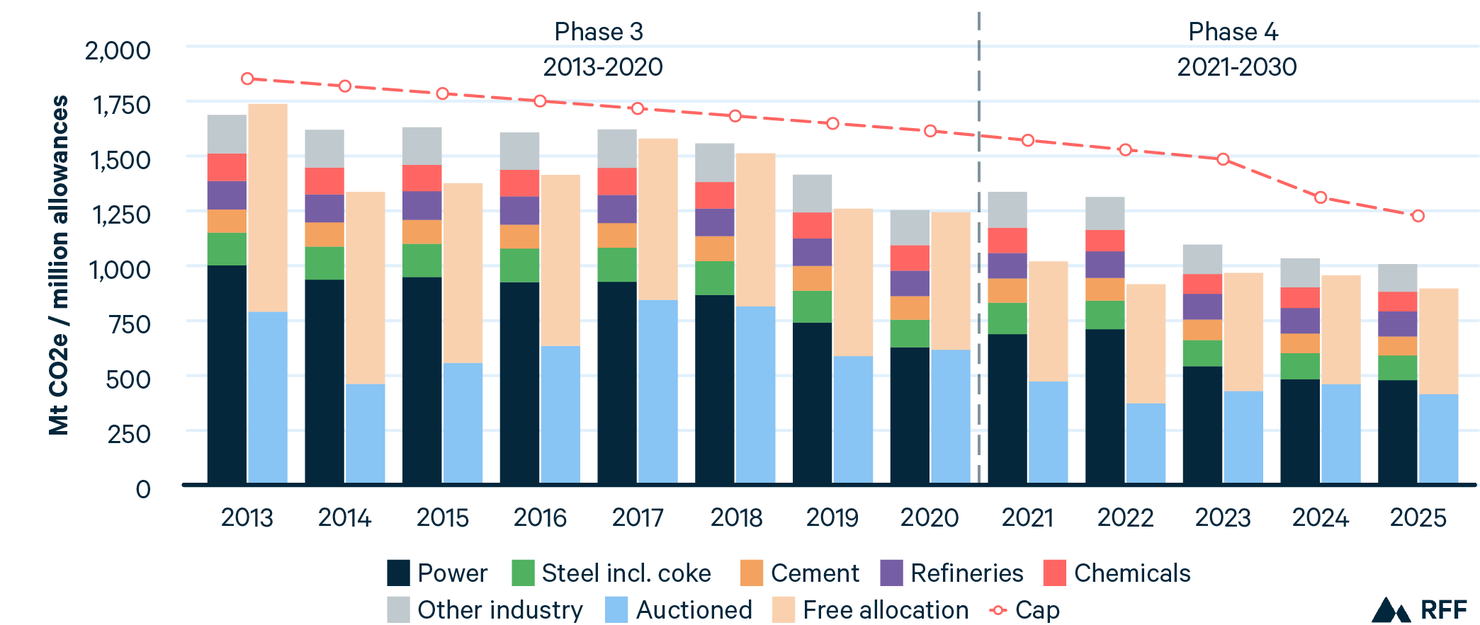
Left bar: verified emissions by sector. Right bar: free allocations (top) and auctioned allowances (bottom). Cap for power plants and industry installations calculated with the linear reduction factor (1.74% to 2020; 2.2% 2021–2023; 4.3% from 2024) on the 2024 (-90M) rebasing. UK, maritime and aviation are excluded throughout. The allowance supply across Phase 3 and Phase 4 represents the supply after the ‘Backloading’ and the ‘Market Stability Reserve’ adjustments—both which withhold allowances from the auctioning schedule based on parameters set in the EU ETS legislation.
The European Union proposes to create room for additional ETS supply through the purchase of 260 million international carbon credits (funded by selling ETS allowances). This would increase domestic emissions in exchange for more international reductions, but only if the credits can be procured in the desired quantity and quality. If not, the ETS cap will still be reduced commensurately. Another source of additional supply is permanent carbon removals. The European Union proposes that companies under the ETS can also buy units certified under its carbon removal certification mechanism and use these for compliance. Because permanent carbon removal is costly, likely exceeding the ETS allowance price, it is unclear if the volumes of removals will be significant.
2. Allowances Allocated for Free: More Conditionality, More Benchmarks?
Free allocation in energy-intensive industries in the EU ETS has been justified as a compensation mechanism against the risk of carbon leakage risk. With protecting industrial competitiveness as a goal, making free allocation conditional (e.g., on low-carbon investment) has been resisted. This may be changing, as the commission suggests making it conditional on companies submitting transition plans for their facilities that align with the European Union’s climate neutrality goals. Twenty percent of free allowances may face even stricter rules, as operators will need to prove that they invested the value in actual decarbonization of their facilities. Unlike with the other allowances, this 20 percent would not be allocated ex ante but several years later, after verification of the investments.
Although conditionalities like this may be heavily contested during the upcoming legislative process, the proposal reflects a core challenge in free-allocation design. It carries a high opportunity cost in foregone auction revenue that could be used to finance green industrial policy. Shifting free allocation from a compensatory logic to directly supporting low-carbon investments can be a way to bridge a period when allocation mostly benefits conventional, higher-emitting producers to one where it benefits lower-carbon producers as a decarbonization coinvestment mechanism.
Figure 2. Free Allocation and Verified Emissions in the EU Emissions Trading System
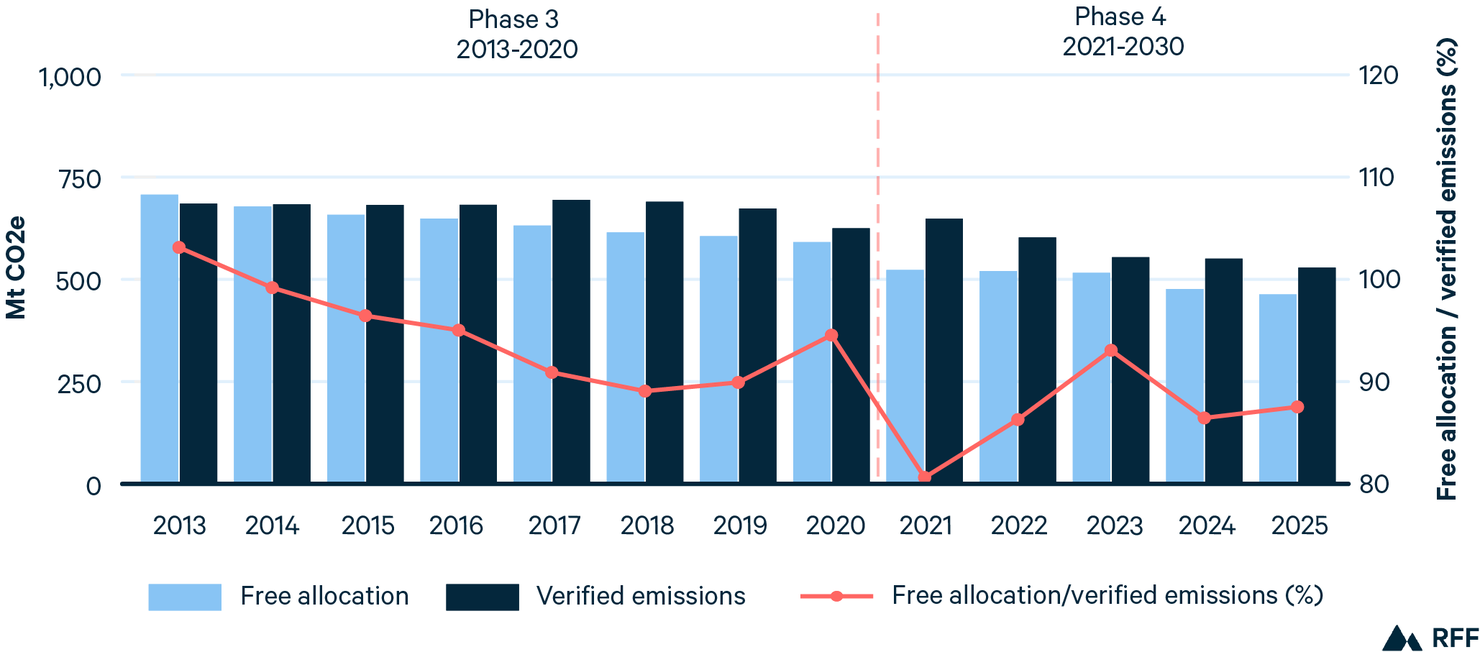
Includes EU ETS stationary installations, excluding the power sector, 2013-2025. 2025 verified emissions include values completed from EEA (July 2026) country-by-activity data for countries with incomplete Union Registry reporting (DK, MT, BG, LV, LU, PL, FR, XI); free allocation is complete.
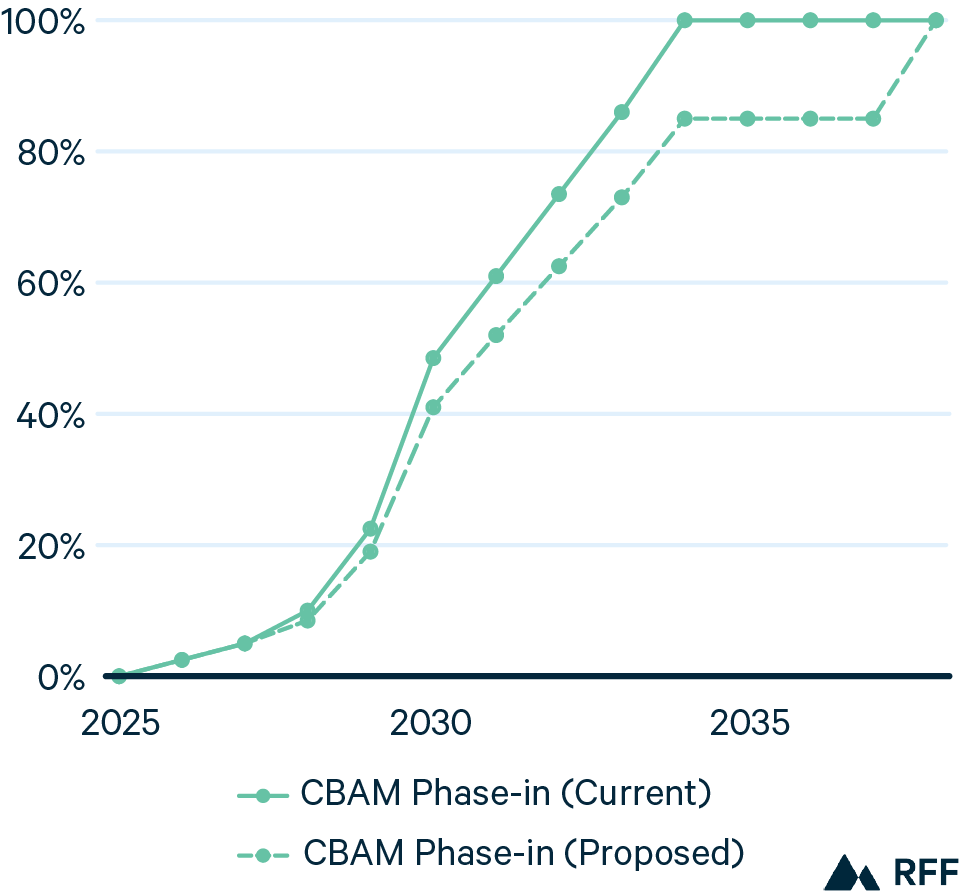
The European Union’s carbon border adjustment mechanism also fits here, as it will gradually replace free allowances. However, the proposal suggests a more gradual phaseout of free allowances to sectors included in the carbon border adjustment mechanism (CBAM), so the effective price for CBAM certificates will not reflect the full ETS price for a few years longer (until 2038), as the price is adjusted for the share of free allocation (see Figure 3). The full CBAM payment obligation depends on not just this CBAM factor but the emissions embedded in imported goods. If actual emissions data cannot be verified, default values apply as a fallback approach, which act as an intensity benchmark.
Figure 3. Current and Proposed Phase-In of the EU Carbon Border Adjustment Mechanism
3. Benchmarks: Technical Allocation Rules Can Affect Decarbonization Incentives
A more technical change to free allocation concerns benchmarks. These are set at the product level and should ensure that free allocation volumes are “benchmarked” to the 10 percent most efficient EU installations for a given product. However, some industrial facilities yield many different products (e.g., refineries or the chemicals industry). In these cases, input-based fallback benchmarks are used that relate more to generic industrial processes (heat and fuel consumption, expressed as GHG emissions per terajoule of input) than to products (expressed in output terms as tons of GHG per ton of product). Examining the evolution of ETS benchmarks can provide insight into policy design choices that also are relevant when considering product carbon intensity standards—a topic that Resources for the Future will work on over the coming year.
Heat and fuel benchmarks in the EU ETS are based on a baseline (2007–2008) performance and have been ratcheting since then. The lower the value, the fewer free allowances per unit of product. Benchmark values are updated based on sector-wide performance, with the percentages having lower and upper bounds set by the ETS legislation. The 2026–2030 period had a maximum update rate, leading to a benchmark value that is 50 percent below the 2007–2008 baseline (EU 2026/1412).
Fallback benchmarks cover multiple sectors, but some sectors may have decarbonization options, such as biomass combustion, that others do not. Governing sectoral heterogeneity is hard and comes with concerns from industry, which argues that sectoral specificities justify differentiated treatment. In response to this, the commission will now develop sectoral fallback benchmarks. However, doing so may prove challenging, as drawing system boundaries is an inherently difficult task. The more sectoral specification, and therefore more disaggregation, the more cross-sectoral competition will be limited and complexity increased.
Oil and gas activities are among those sectors subject to fallback benchmarks. In distinguishing between sectors, the commission ensures that oil and gas extraction activities still face the largest benchmark reduction. Likewise, the update rate has been calibrated so that the maximum available allowance budget would be used—akin to a reverse engineering approach. Both cases show how bespoke rules for different sectors may win out over a uniform set of rules.
Some sectors have received more free allowances than their emissions over the years; others have been in deficit (Figure 4). Over time, more sectors should end up in deficit as benchmarks are tightened. Combined with the higher ETS price in recent years, this leads to higher effective carbon costs for industrial sectors. Setting rules many years in advance and keeping them unchanged is politically hard to sustain, as it produces different outcomes across sectors as economic circumstances evolve. This revision shows how a regulation with a uniform set of principles for allocation can still be politically fragile and lead to industry lobbying for differentiated treatment. This is an important lesson when designing an industrial product carbon intensity standard, whose durability is strongly related to political acceptance rather than just stringency. In addition, any standard (or benchmark) is designed and calibrated on current conventional production technologies and not possible low-carbon technologies that are not yet commercially available at scale. When it is based on vastly lower-GHG performance, the impact on lagging performers can be stark. This is desirable from a climate but not an industry perspective. Yet, more disaggregated treatment of sectors may impact decarbonization between different competing products by limiting substitution and competition.
Figure 4. EU Emissions Trading System Allowance Supply and Emissions by Sector, 2013–2025
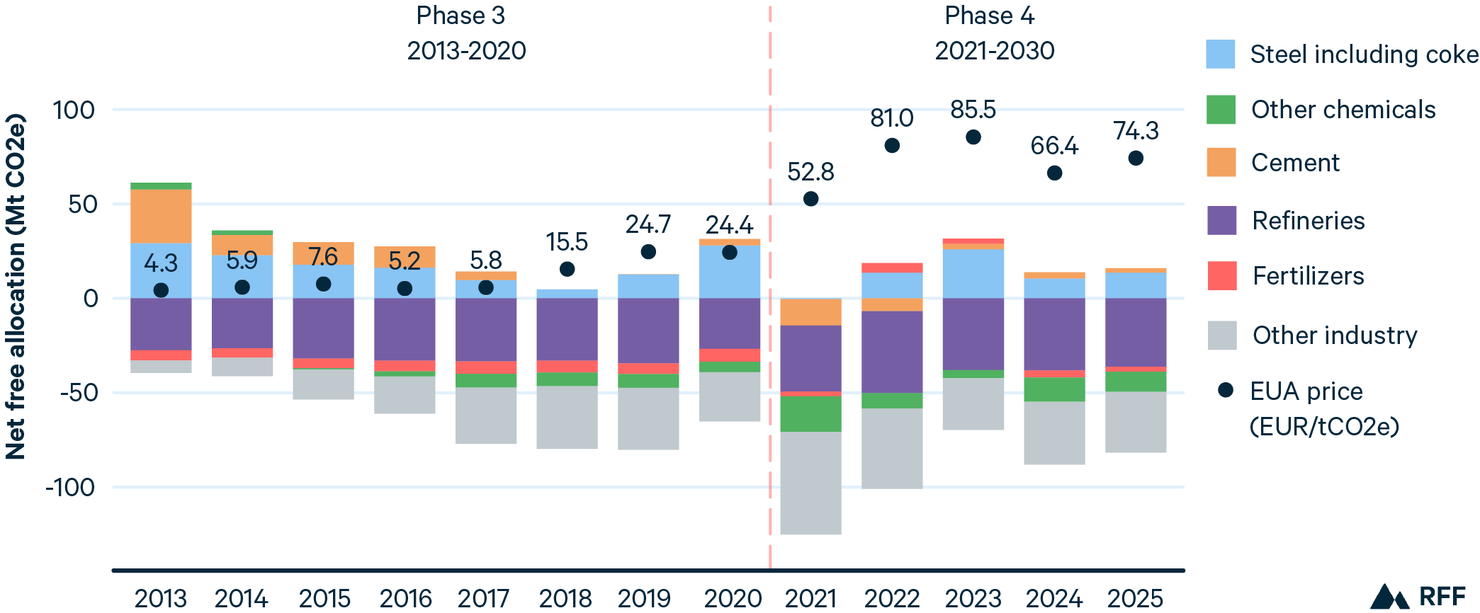
Note: Includes EU ETS stationary installations, excluding the power sector, 2013-2025. Net free allocation numbers represent allocation volumes after accounting for emissions. Steel including coke: 24.10, 19.10; Cement: 23.51; Refineries: 19.20; Fertilizers: 20.15; Other chemicals: 20 excluding 20.15. NACE 35 (power) is excluded. Other industry covers the rest. Net free allocation (free allocation - verified emissions) shown for the 27 EU Member States, Iceland, Norway, Liechtenstein, and Northern Ireland. 2025 verified emissions include values completed from EEA (July 2026) country-by-activity data for countries with incomplete Union Registry reporting (DK, MT, BG, LV, LU, PL, FR, XI). EUA price reflects the nominal annual average.
4. Next Steps for Revising the EU Emissions Trading System
Now that the commission released its proposal, it is up to the EU legislators—the European Parliament and member states in the Council of Ministers—to negotiate a final outcome. This usually lasts over a year. Much of the proposed ETS design changes can still change significantly throughout this process—as happened in the past, too. The European Parliament’s environment committee already adopted its position in September, and proposes some changes such as making the entire free allocation of the 20% least-efficient facilities conditional on low-carbon investments. The rest of the European Parliament, including members on its industry committee, still need to discuss the proposed changes, however. At Resources for the Future, we will continue to examine the evolution of the EU ETS, its lessons for other carbon pricing systems, and implications for the CBAM and other trade-related policies, such as product carbon intensity standards.