Industrial Deep Decarbonization: Modeling Approaches and Data Challenges
This report presents an overview of decarbonization options for six key industrial sectors and reviews the strengths and weaknesses of different approaches to modeling industrial emissions reductions.
Abstract
Industrial energy consumption represents almost 40 percent of current global total final consumption and is still dominated by fossil fuels. In this paper, we present key decarbonization options—namely fuel switching and electrification, carbon efficiency, material efficiency, carbon capture and storage, and circular economy practices—and analyze their potential for decarbonization in six main energy-intensive industrial sectors: steel, cement, chemicals, light manufacturing, aluminum, and pulp and paper. We then develop a framework to distinguish among the different modelling approaches to industrial energy demand and emissions, with specific focus on the data challenges that constrain modelling and the difficulties of modelling innovation and technology diffusion. We present the most widely used models of industrial energy demand and emissions and classify them along three key dimensions: the analytical approach underlying each model, the methodology used to generate decarbonization pathways, and the granularity with which different industrial sectors be represented. By highlighting the strengths and weaknesses of available tools for industrial emission modelling, we point to necessary future model development efforts that would greatly improve the ability to develop deep decarbonization pathways for industry.
1. Introduction
Increasing carbon efficiency and switching to carbon-neutral technologies for industrial production are imperative to achieve deep greenhouse gas (GHG) emissions reductions and to address climate change, as well as to ease concerns regarding energy security and higher energy prices. Energy consumption by the industrial sector represents almost 40 percent of current global total final consumption and is still dominated by fossil fuels, in particular coal. In 2021, industry was the second-largest emitting sector, after power generation, and was directly responsible for emitting 9.4 gigatonnes (Gt) of CO2. This estimate, which is equivalent to a quarter of global emissions, does not include indirect emissions from electricity used for industrial processes (IEA 2022c). Industrial energy and carbon intensities vary significantly across sectors as well as within sectors across different countries, with six sectors emerging as particularly energy- and emissions-intensive (see Section 2).
The aim of this paper is to describe the most common approaches to the modeling of industrial emissions, with a particular focus on the ability of available models to depict the different mitigation options relevant for energy-intensive industries. These options range from increasing energy efficiency to developing and deploying novel negative-, zero-, or low-emissions technologies. Importantly, producing quantitative forecasts of industrial energy demand and emissions is strongly dependent on the availability of past data for model calibration. Furthermore, different modeling approaches and methods are characterized by the capacity to provide more or less detailed scenarios in terms of geographic, sectoral, and technological detail. Understanding the strengths and weaknesses of available approaches and tools for industrial energy and emissions modeling provides the basis for developing and interpreting results that can be used to inform energy- and climate-related policymaking.
We also describe the most promising deep decarbonization options in each sector and discuss whether and how these options are represented in industrial energy models. It is important to recognize that deep emissions reductions cannot be achieved by pursuing a single decarbonization strategy alone; rather, these reductions are more likely to be achieved through a combination of many mitigation options, as well as investment in and support for different technologies and subtechnologies. Conversely, ignoring some of these options and promoting only select ones reduces the likelihood of achieving deep decarbonization targets. Therefore, our assessment of the relevance of various mitigation options for industrial deep decarbonization should not be interpreted as suggesting that one option should be chosen over the others.
The paper is organized as follows. Section 2 identifies and describes the energy-intensive sectors that account for the majority of industrial energy demand and emissions, the focus of this paper. Section 3 reviews the available strategies through which industrial energy emissions can be reduced. Section 4 illustrates more detailed and specific technological options in each of the key energy-intensive sectors. Section 5 provides an overview of the data available to measure industrial energy demand and emissions, which are critical inputs for model development and calibration. It also discusses the difficulty of obtaining data to model several of the decarbonization approaches that are relevant in industrial sectors for deep decarbonization, due to limited data coverage and detail. Section 6 presents a framework to distinguish among the different modeling approaches to industrial energy demand and emissions, while Section 7 summarizes common approaches to modeling innovation and technology diffusion. Section 8 looks at the key models that have been used in the literature to this end, and Section 9 concludes.
2. Energy-Intensive Industry Sectors
While all industrial sectors rely on fossil fuels for their production activities, energy intensity varies significantly across them. The most energy-intensive sectors worldwide are steel, cement, chemicals, light manufacturing (as defined in Section 2.4), aluminum, and pulp and paper. Historically, these sectors accounted for about half of all industrial sectors’ delivered energy use (EIA 2016). The aim of this section is to justify our focus on a limited number of carbon-intensive sectors by describing their contribution to economic growth (output), energy demand, and CO2 emissions. To this end, we rely on the IPCC Sixth Assessment Report (IPCC 2022) for steel, cement, and chemicals and IEA reports (IEA 2022a,d,e) for light manufacturing, aluminum, and pulp and paper. It is important to note that in providing this overview, we take a global perspective and largely abstract from national specificities and intersectoral heterogeneity.
2.1. Steel
Crude steel production rose globally by 41 percent between 2008 and 2020. Worldwide, around 40 percent of steel is used in buildings, 20 percent in industrial equipment, 18 percent in consumption goods, 13 percent in infrastructure, and 10 percent in vehicles. Emissions associated with steel production Percentages sum up to 101 percent. This is due to rounding in the original source of the data., primarily from the use of coke ovens and blast furnaces, are estimated at 3.7 to 4.1 gigatonnes of CO2 equivalent (GtCO2e), accounting for 20 percent of all worldwide direct industrial emissions in 2019 (IPCC 2022).
2.2. Cement
Since the mid-20th century, cement output has grown faster than world population , indicating an increase in the use of cement for infrastructure and buildings. In 2019, direct emissions from cement manufacturing were estimated at between 2.1 and 2.5 GtCO2e, or 14 to 17 percent of total worldwide direct industrial GHG emissions, despite major advances in energy efficiency in this sector over the past two decades. Typically, about 40 percent of these direct emissions result from the combustion of fuels to produce the high temperatures needed in the manufacturing process, and the remaining 60 percent occur during the decomposition of calcium carbonate (IPCC 2022).
2.3. Chemicals
Chemical products include plastic, rubber, fertilizers, solvents, and other substances such as food additives and pharmaceuticals. In 2019, the chemical sector’s emissions were estimated at 1.1 to 1.7 GtCO2e, or 10 percent of total worldwide direct industrial emissions. Processes used to produce chemicals such as ammonia (used in the production of nitrogen fertilizers), methanol (used in the production of adhesives, resins, and fuels), and olefins and chlorine (essential components of plastics emissions) are very energy-intensive (IPCC 2022).
2.4. Light Manufacturing
In 2019, light manufacturing accounted for 17 percent of total industrial emissions. Between 2010 and 2020, overall output from these industries increased, although emissions fell by around 2.3 percent over the same period (IEA 2022d). According to the IEA definition, light manufacturing includes a diversified set of industries: food production (14 percent of light manufacturing emissions), timber (1 percent), machinery (8 percent), vehicles (2 percent), textiles (3 percent) and other consumer goods (55 percent), construction (9 percent), and mining (8 percent).
2.5. Aluminum
In 2021, aluminum, a crucial input in several critical energy transition technologies, accounted for approximately 3 percent of the world’s direct industrial CO2 emissions. Over the past 10 years, the global aluminum industry’s direct emissions have been rising gradually as a result of rising production. Because of slight improvements in emissions intensity over time and leveling output in 2019, emissions decreased for the first time in 10 years, but this trend subsequently reversed. The aluminum manufacturing process uses significant amounts of electricity, and the source of electricity is important in determining its overall emissions profile. In 2021, direct emissions from the sector were 275 megatonnes (Mt), but overall emissions including indirect emissions from power consumption were substantially larger, at 1.1 Gt of CO2 (IEA 2022a).
2.6. Pulp and Paper
In 2021, pulp and paper production reached 190 Mt of CO2 emissions, which is a historic high and accounts for nearly 2 percent of total industrial emissions. Paper output is expected to expand until 2030, and therefore improvements in the industry’s emissions intensity are required to reduce future emissions from pulp and paper. Future paper output is expected to rise slightly as a result of an increase in packaging and sanitary paper goods, particularly in developing economies, which more than compensates for the decline in printing-related paper production (IEA 2022e).
3. Available Approaches for Industry Decarbonization
While industrial processes across and within sectors differ greatly, five high-level strategies can be identified to reduce industrial energy emissions: (1) fuel switching, including alternative feedstocks, and electrification of industrial production; (2) carbon efficiency improvements through more efficient or digital technologies (energy efficiency) or through zero-carbon technologies; (3) improvements in material efficiency, including through radically novel processes and business models; (4) deployment of carbon capture and storage technologies; and (5) circular economy practices based on the reduce, repair, refurbish, reuse, and recycle paradigm. Some of these strategies are more in line with deep decarbonization targets, while others represent more marginal improvements. In this section, we provide a broad definition of each of these approaches. In Section 4, we discuss the extent to which each approach is relevant for each sector and provide concrete and promising examples of specific technologies in each energy-intensive sector.
3.1. Fuel Switching and Electrification
One way to reduce energy emissions is through fuel switching and electrification, which represent a move from a carbon-intensive energy carrier to one that has low or zero associated emissions. Fuel switching entails a shift away from coal, refined oil products, and natural gas toward sustainable energy sources such as biofuel, solar heating, geothermal, sustainable hydrogen or ammonia, nuclear, or net-zero synthesized hydrocarbon fuels. The ability of fuel switching to achieve drastic emissions reductions depends on the nature of the chosen fuel as well as on the specific industrial sector under consideration.
For instance, biofuels—namely, fuels from biogenic sources—are available in a variety of forms, some of which have properties similar to those of fossil fuels and the same uses. While biomethane, biomethanol, and bioethanol are available today at costs generally comparable with those of fossil fuels (IPCC 2022), the extent to which their use will lead to deep decarbonization is questioned in the literature: while their carbon cycle goes into and out of the atmosphere, they may not in fact be GHG-neutral because of the way they are produced, which involves changes in land use, soil carbon depletion, and fertilizers (Hepburn et al. 2019). However, most biofuel, chemical, and biogas manufacturing techniques create considerable side flows of concentrated CO2, which can be easily absorbed when combined with carbon capture and storage and carbon capture and utilization (e.g., bioenergy with carbon capture and storage, or BECCS) and might represent a source of negative emissions (IPCC 2022).
Yet the use of biogenic carbon to achieve deep decarbonization across all sectors is challenging. Capturing carbon during a production process and using it as a feedstock would require large amounts of hydrogen to transform the CO2 into a variety of chemicals through a reaction process (IPCC 2022). Furthermore, the sustainable supply of biomass faces significant challenges, including the availability of land for bioenergy crops, water use needs by bioenergy crops, the necessity to adapt bioenergy crops to a changing climate, and the ability to transport and store large quantities of crops. All these challenges currently are not fully managed, nor are they likely to be in the near future (Harris et al. 2018: Bui et al. 2023).
Switching to solar energy, which has no associated GHG emissions, is more in line with deep decarbonization targets. Direct solar heating in industry, for instance, has an acknowledged potential, particularly in countries with high solar irradiance and industries with modest heat demands, such as food and beverage production, textiles, and pulp and paper (IPCC 2022). Major barriers to adoption for these technologies are location and application specificity, the need for energy storage technologies to compensate for intermittency (Asiaban et al. 2021), high capital costs, and the absence of standardized mass production for equipment.
Direct electrification is a switch from direct fuel use toward electricity and represents an important option to achieving industrial carbon neutrality (IPCC 2022). Electricity is a versatile energy carrier that can be produced from a variety of primary sources, with significant potential for process improvements in terms of end-use efficiency (Eyre 2021), quality and process controllability, digitizability, and the absence of direct local air pollutants. The emissions reductions that can be achieved through electrification vary depending on the specific sector or subsector. For instance, they are higher in manufacturing, which uses fossil fuels as energy carriers, but lower in the chemical sector, which uses fossil fuels as feedstocks and not to generate energy or heat. Furthermore, the potential for emissions reductions depends on whether the electricity is produced using low-GHG-intensity primary sources (wind, solar, hydro, advanced geothermal nuclear, fossil fuels with capture and storage) (IPCC 2022). Roelofsen et al. (2020) estimate that almost half of the fuel consumed for energy can be electrified with technology that is already available.
As discussed in Section 4, important progress is being made in all industrial sectors; however, electrification is most easily achieved in light manufacturing sectors. For sectors with large needs of high-temperature heat (e.g., primary steel production), significant technological barriers still have to be overcome. Direct induction and infrared heating are options for higher temperature requirements, whereas steam boilers, curing, drying, and small-scale process heating are easily electrifiable from a technical point of view. Of course, electrification is economically attractive only if electricity prices are comparable to those of fossil fuel (IPCC 2022). Because of a variety of factors, electricity and fossil fuel prices vary by country, yet the EU average electricity price per kilowatt hour (kWh) has been consistently lower than that of gas since 2008 by a factor of three to five (Eurostat 2022).
3.2. Energy Efficiency Improvements in Production Process
Increasing the energy efficiency of production processes is a second approach to reducing GHG emissions from the industrial sector. Energy efficiency improvements not resulting from fuel switching are an important, yet incremental, mitigation strategy, as they often do not entail radical technological changes. Energy efficiency can be achieved through two channels: advances in energy-saving best available technologies (BATs) and shifting industrial plants’ specific energy consumption to a more efficient technology, ideally a BAT (IPCC 2022). While improving energy efficiency in industrial processes has a high emissions reduction potential, energy efficiency alone will not lead to deep decarbonization in industrial sectors. For instance, combustion produces approximately 10 percent of global GHG emissions due to high-temperature heat in basic material manufacturing processes (Sandalow et al. 2019), yet until recently, efforts and investments to reduce carbon emissions in heat generation were relatively limited; consequently, technological approaches for decarbonizing industrial heat production are still far from maturity (ICEF 2020). There is still high potential for the use of non-high-temperature waste heat, particularly if coupled with high-temperature heat pumps to increase the temperature of the waste heat to the needed level (Nandhini et al. 2022).
Another key method to improve energy efficiency is through digitalization. The development of technology including sensors, communications, analytics, digital twins, machine learning, virtual reality, and computing technologies enables future advances in process control and optimization. Smart energy solutions with real-time tracking enable the optimization of new technologies, energy demand responsiveness, and energy supply-and-demand balance, including pricing, product quality control, and forecasting and reducing unproductive time for humans and robots (IPCC 2022). Significant investments in digital solutions are being carried out in most industrial sectors, also as a result of public commitment to promote the transition toward Industry 4.0 (see, e.g., EU 2020; ABI Research 2022; Verdolini 2023). Industry 4.0 refers to rapid improvements in industrial systems and product design, production, and maintenance as a results of what the literature has defined as the fourth industrial revolution (hence the 4.0), mostly promoted by the widespread diffusion of digital technologies (European Parliament 2015). Yet the potential for digital technologies to reduce emissions through increased efficiency is higher in non-energy-intensive sectors and generally limited in energy-intensive sectors (IPCC 2022). Importantly, quantitative evidence is scarce regarding the impact of digital technologies on industrial energy demand and associated emissions. As a result, it is hard to inform models regarding the potential enabling role of digital technologies. Moreover, appropriate governance of digitalization will be required to ensure that the benefits of digital technologies are used “deliberate[ly] for the good” (Creutzig et al. 2022).
3.3. Material Efficiency
Material efficiency, the supply of goods and services with less material, is increasingly recognized as a critical strategy to lowering GHG emissions in the industry (IEA 2019). Yet, similarly to energy efficiency, material efficiency is not sufficient to achieve the deep decarbonization of industry. Options for improving material efficiency exist at every stage of a material’s or product’s life cycle, such as by designing lightweight products, optimizing to preserve end-of-life service while reducing material use, and developing circular principles. The precise open physical mapping of current material supply chains allows material efficiency measures to be tracked down to where emissions are emitted, and these alternatives may be comparable to decarbonization and conventional energy efficiency techniques (IPCC 2022). Many material efficiency actions, such as designing lightweight items, result in direct GHG emissions savings in the short term; others also have long-term emissions reduction effects. For example, developing a product that can be reused or has a longer lifespan reduces emissions both today and in the future. While material efficiency is generally not well represented in climate-energy-economy models, the International Energy Agency developed a scenario in 2015 that projects a 17 percent decrease in industrial energy demand in 2040 (IEA 2015) due to increased material efficiency.
3.4. Carbon Capture and Storage Technologies
Carbon capture and storage (CCS) and carbon capture and utilization (CCU) represent potential options to achieve deep decarbonization, but these technologies have not yet been proven at a commercial level, and there are concerns about the long-term storage of carbon. For instance, the most developed method for long-term CO2 storage in subsurface pore space is sequestration in sedimentary formations. Major potential hazards from CO2 storage in subterranean pore space include leakage from wellbores or nonsealed cracks in the caprock, building of pressure in the reservoir that might result in caprock hydraulic fracturing, and pollution of drinking water. Induced seismicity may result from the injection of CO2 into subterranean reservoirs. Most studies believe that produced earthquakes carry a modest risk of causing fault displacements and compromising reservoir security, but others contend that even small- to moderate-magnitude earthquakes can damage the seal and undermine the integrity of sequestration reservoirs (Kelemen et al. 2019).
CCS and CCU use similar capture technologies to collect concentrated flows of CO2 from smokestacks; the main difference between the two is what occurs to the CO2 after it is captured. CCS involves the recovery and storage of CO2 from combustion, gases, and ambient air to the geosphere for thousands of years (IPCC 2022). CCU involves the capture of carbon from one process and its reuse for another, lowering emissions from the first process, yet potentially, but not inevitably, releasing carbon to the environment in subsequent operations (Tanzer and Ramirez 2019). The net potential impact of these technologies on carbon emissions is a source of debate in the literature. Their contribution to deep decarbonization scenarios depends on the initial source of carbon, fossil fuel or biomass, as well as the period of storage or usage, which can range from days to millennia (IPCC 2022). According to recent analysis, CCS can technically achieve near-zero CO2 emissions in applications where the CO2 can be captured during the production process, with highly variable partially negative emissions over the life cycle if the origin is biogenic fuels. Brandl et al. (2021), for instance, argue that capture rates up to 98 percent are technically feasible and result in negligible increase to the overall system costs. However, achieving net zero would require the indirect capture of residual emissions by complementary carbon dioxide removal technologies, such as afforestation, BECCS, or direct air capture with carbon storage (DACCS). While not a mitigation option, direct air capture (DAC) could be used to offset both fuel and process emissions at industrial plants. DAC refers to chemical processes that separate CO2 from the ambient air. The required energy to capture CO2 increases as the concentration of CO2 falls, so the energy requirement to remove a single ton of CO2 from the atmosphere is quite high. (The concentration of CO2 in the air is about 400 parts per million [ppm], compared with about 120,000 ppm in flues at coal-fired power plants.) The costs of DAC depend on the source of the energy, and estimated costs vary from $100 to over $1000 per ton (NASEM 2019). To date, investment in DAC facilities has been limited because of the highly uncertain future of this technology, which is for several reasons: DAC is generally considered to be among the more expensive carbon dioxide removal (CDR) pathways; most CDR pathways offer benefits besides CO2 removal, whereas DAC provides no cobenefits; and DAC requires large amounts of energy per ton of CO2 removed. More recently, funding and incentives have targeted the further technological development of this mitigation option, including in the United States and the European Union. A recent modeling analysis concludes that the contribution of CCS to emissions reductions is high in the sectors of steel, cement, and refineries, as well as the power sector to a lesser extent. The emission reduction potential of CCS varies however across different countries of the world and depending on the socio-economic pathway modelled. (Turgut et al. 2021).
3.5. Circular Economy Approaches
Finally, industrial energy emissions can be lowered through circular economy (CE) approaches to the provision of goods and services. This would entail strategies to reduce, repair, refurbish, reuse, and recycle. CE practices can contribute significantly to emissions reductions, though alone they are not sufficient to achieve deep decarbonization targets in industrial sectors. Circularity entails closing material and energy flow loops in the provision of goods and services by implementing policies and procedures for more efficient energy, materials, and usage while generating the least possible amount of waste to the environment (IPCC 2022). This may be done through, for instance, the production of durable items that can easily be fixed and whose parts can be reused, refurbished, and recycled, as opposed to a linear production mode (Wiebe et al. 2019). Given that CE encourages reduction, reusing, and recycling, a considerable proportion of energy- and GHG-intensive raw material demand and associated processing may be eliminated, resulting in considerable carbon emissions reductions. The extent to which circularity practices will result in lower energy demand (and associated emissions) has yet to be determined. In the case of recycling scrap metal, the resulting material is often of lower quality, with properties that differ from the raw metal, because the scrap metal is often made up of a variety of materials that are hard to separate. This is referred to as downcycling. Conversely, recycling and upcycling may be achieved, but at the cost of high energy use (IEA 2020).
Circularity can be implemented at three levels: micro (inside a single firm), meso (involving three or more enterprises), and macro (cross-sectoral collaboration). Each level necessitates its own set of instruments and strategies, such as incentives and tax policies (macro level) and eco-design laws (micro-level) (IPCC 2022). At the micro level, more organizations, particularly multinational corporations, are implementing CE practices as a result of their advantages (D’Amato et al. 2019). Industrial parks, from a meso-level perspective, minimize infrastructure costs by clustering industrial operations in specified regions and are often established around big corporations. At this level, typical CE techniques and strategies include sustainable supply chains and industrial symbiosis, a collaboration among different industrial actors to optimize the use of resources and reduce waste generation (IPCC 2022). The primary advantage of industrial symbiosis is the reduction of both virgin materials and final waste, as well as avoided delivery costs from exchanges among firms, which could boost the competitiveness of small and medium-size enterprises. The macro-level approach aims to exploit the potential CE synergies that exist outside the confines of a single industrial park, expanding symbiosis to entire urban settings through the utilization of waste from municipalities as alternative energy sources (Sun et al. 2017).
4. Demand Reduction and Energy Efficiency Potentials of Energy-Intensive Sectors
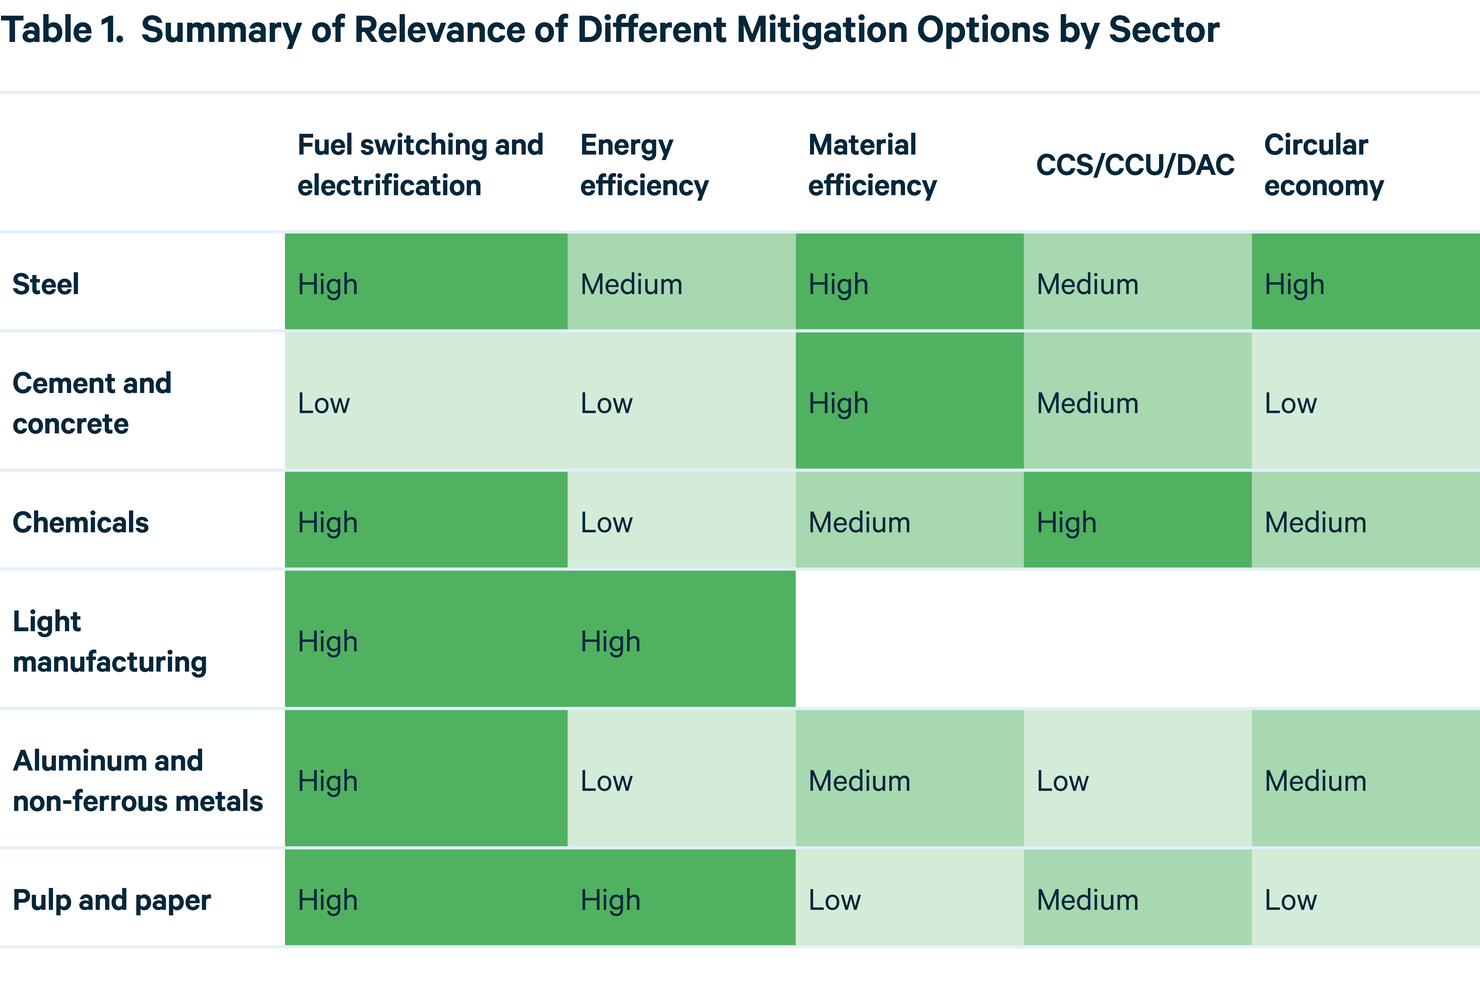
This section discusses specific options for decarbonization in each of the six energy-intensive sectors, providing details on which specific technologies and practices could be adopted to achieve emissions reductions by promoting fuel switching and electrification, increasing energy and material efficiency, deploying CCS and CCU, or implementing circular economy approaches. Table 1 provides a visual summary of this section, highlighting the relative importance of each strategy in each of the sectors. As clarified earlier, this section takes a global perspective and largely abstracts from national specificities and heterogeneity within sectors.
4.1. Steel
Steel production may be classified into two categories: primary production from iron ore and secondary production from steel scrap. The blast furnace to basic oxygen furnace (BF-BOF) route is the most used primary production route worldwide, while the electric arc furnace (EAF) is the preferable procedure for secondary production through melting and alloying recycled steel waste, as it requires less energy and generates fewer emissions (IPCC 2022). An alternative but less common way to produce steel is using direct reduced iron (DRI) to reduce iron ore—thus replacing BFs—which is generally followed by an EAF (IPCC 2022). In 2019, approximately 73 percent of worldwide crude steel output was produced using BF-BOF technologies, while 26 percent was produced using the EAF method. Of the latter, about 5.6 percent is derived from DRI (World Steel Association 2021). Importantly, production processes vary geographically; for instance, the majority of US steel production is done through EAFs.
There are several approaches to significantly reduce GHG emissions in the steel sector (IPCC 2022). First, potential energy efficiency improvements of primary steel production—that is, BF-BOF approaches—are estimated at 15 percent (IPCC 2022). Second, circular practices, promoting secondary rather than primary production, are another effective way to reduce emissions. This option, however, strongly depends on the accessibility of domestic and foreign scrap supplies and necessitates meticulous sorting and scrap management, particularly to get rid of copper contamination (Daehn et al. 2017). One important technology in circular practices is the electrowinning process, a low-temperature electrolysis method for extracting solid-state elemental iron from iron ore. The iron is then put into an EAF to produce liquid crude steel, which may also be mixed with scrap steel (Junjie 2018).
Third, fuel switching and electrification, using carbon-free energy and feedstock sources as input, or carbon capture and storage technologies (IPCC 2022) could potentially reduce an estimated 80 percent of current emissions from primary steel production with today’s dominant technology, BF-BOF. The extent to which BF-BOFs can be retrofitted for capture is currently a matter of debate in the literature. Fan and Friedmann (2021) , who consider near-term options to rapidly reduce GHG emissions in steel production by examining technical options in terms of cost, viability, readiness, and ability to scale, argue that it would be challenging to retrofit BF-BOFs beyond 50 percent capture; conversely, Hughes and Zoelle (2021), who perform a sensitivity analysis on the cost of capital for iron and steel retrofit, assume that retrofitting can achieve up to 99 percent capture. Note that BF-BOFs must have their furnaces relined every 15 to 25 years (IPCC 2022); this costs from 80 to 100 percent more than building a new facility. For this reason, it is more economically viable to construct a new facility that is built for 90+ percent capture than to retrofit.
DRI with CCS using syngas based on methane can also be used to reduce emissions in the steel industry. Currently, the majority of DRI plants employ syngas of H2 and CO based on methane as a fuel and a reductant. Furthermore, hydrogen-based DRI (H-DRI) is being developed on the widely used DRI technique but using only hydrogen. Iron ore reduction is frequently followed by an EAF for smelting. This steel manufacturing method may be practically CO2 neutral if hydrogen is created using carbon-free sources (Vogl et al. 2018). Molten oxide electrolysis (MOE) is another method for extracting metal from its oxide source. The benefits of liquid metal production are the ease with which the manufactured metal may be collected and the capability to operate continuously. The use of electricity for metal extraction includes using renewable energy and the decoupling of metal production from CO2 emissions. As a result, if suitable for industrial scales of production, this technology will be of significant interest to the steel industry (Wiencke et al. 2019).
Fourth, emissions in the steel sector can be dramatically reduced by increasing material efficiency (i.e., less steel usage per vehicle) as well as through circularity practices and demand-side options that would lower the demand for steel manufacturing or increase the intensity of product use (i.e., car sharing). In particular, the IEA estimates that stringent measures targeting material efficiency could realistically lower the demand for steel by 40 percent by 2060 (IEA 2019).
4.2. Cement and Concrete
Available analyses suggest that the cement industry has limited mitigation options, yet some exist. One strategy is based on material efficiency; making stronger concrete via improved mixing, aggregate size, and dispersion is one of the easiest and most efficient methods to minimize cement and concrete emissions. Because cement is low cost, corrosion- and water-resistant, and easy to work with, architects, engineers, and contractors frequently overbuild with it. Buildings and infrastructure can be intentionally planned to limit the use of cement to its necessary applications and substitute other materials for nonessential uses. This might cut the use of cement by 20–30 percent (IPCC 2022). Indeed, while fuel switching and electrification do not appear to be viable options to minimize or reduce the CO2 emissions specifically associated with the typical Portland A cement manufacturing process (IPCC 2022), available assessments indicate that some countries have high clinker-to-cement ratios, with the United States having the highest. Decreasing these ratios would reduce emissions (Pascale et al. 2021; IEA 2022b; CTCN 2016).
Second, fuel switching and electrification have the potential to lower emissions in specific phases of the production process. For instance, the use of bioenergy solids, liquids, or gases (IEA 2018), hydrogen, or electricity for producing the high-temperature heat needed at the calciner can also minimize the energy-related emissions of cement manufacture. Because of their different qualities of quick and slow combustion, co-burning hydrogen and bioenergy may be beneficial in this respect.
Third, given limited other mitigation options, carbon capture and storage technology is frequently cited as a potentially significant component of an ambitious mitigation approach in the cement industry. CCS technology can capture only the process emissions or both the energy and process CO2 emissions. Several CCS techniques may be used, including post-combustion technologies like membrane-assisted CO2 liquefaction and amine scrubbing, oxy-combustion in an atmosphere with little to zero nitrogen to generate a concentrated CO2 stream for capture and disposal, and calcium looping (Dean et al. 2011).
Fourth, switching to different materials and production processes may be required to achieve deep decarbonization in this sector in the long run if material efficiency, improved mixing and aggregate sizing, and CCS with extra bioenergy are not viable in some places or at all to reach near-zero emissions. Among the successful strategies to reduce CO2 emissions in the global cement industry is the use of supplementary cementitious materials (SCMs) (Ayati et al. 2022), including from industrial and agricultural wastes, to replace part of the clinker in cement (Singh 2022). However, implementing this option at a large scale will be challenging due to the limited supplies of conventional SCMs, unless new types of SCMs become available (Scrivener et al. 2018). Limestone calcined clay cement (LC3), which is made by blending clinker, calcined clay, limestone, and gypsum, has been gaining considerable attention and investments as an important alternative to Portland cement because it reduces CO2 by up to 40 percent, uses low-grade raw materials, and requires a lower calcination temperature for clay. It is cost-effective and does not require major modification in cement plants. In addition, alkali-activated materials and geopolymers, aluminate cements, magnesia-based cements, and gypsum-based materials represent promising alternative binders that can be produced with lower carbon footprints (Peng and Unluer 2023). Indeed, some of these alternative solutions to limestone-based ordinary Portland cement have been tested and used regionally and have given rise to partial savings (IPCC 2022), but they remain harder to implement as compared to accessing limestone resources (Material Economics 2019).
4.3. Chemicals
A key characteristic of the chemical sector is the heterogeneity of its products, each of which has its own production process, distinct set of technologies, and mitigation options, making it challenging to model decarbonization in this sector. This is particularly true for some of the chemical production processes for which no technological options currently exist that allow production of certain chemicals to be decoupled from the use of a carbon source (IPCC 2022). The processes that consume the most energy in this sector are those for the production of high-value chemicals (such as ethylene or propylene, typically precursors to plastics), fertilizers, methanol, and some halogens such as chlorine (Worrell et al. 2000).
Yet the literature suggests that the chemical sector offers several major mitigation options. There are several potential routes to lower emissions in the chemical sector. First, this sector has one of the highest potentials for electrification, suggesting the prospect of a rapid decrease in associated emissions (Madeddu et al. 2020). Indeed, despite the industry’s consistent improvements in energy efficiency over the last few decades, the demand for heat and steam in the manufacturing of basic chemicals is responsible for a large share of emissions (Bazzanella and Ausfelder 2017). Most of this energy is now provided by fossil fuels; these in theory can be replaced with bioenergy, hydrogen, or electricity with minimal or no carbon emissions (IPCC 2022).
Second, fuel switching can also significantly lower emissions; this is particularly the case for ammonia manufacturing, which accounts for around 30 percent of all CO2 emissions in the sector (IPCC 2022). Nitrogen and hydrogen are combined to make ammonia through a catalytic process, with hydrogen most frequently produced through natural gas reforming (Material Economics 2019) or, in some areas, coal gasification, which has significantly higher related CO2 emissions. Future low-carbon alternatives for ammonia production include methane pyrolysis, which converts methane into hydrogen and solid carbon (Material Economics 2019), hydrogen produced by electrolysis using low- or zero-carbon energy sources, and natural gas reforming with CCS. Compared with conventional processes, electrifying ammonia would result in a reduction in the overall amount of primary energy used, although innovative synthesis procedures still have a substantial opportunity for efficiency improvement (IPCC 2022). Switching to synthetic feedstock also plays a crucial role in those chemical production processes for which no carbon-free options exist. For instance, a possible strategy is synergistic combination of low-GHG hydrogen and carbon obtained by direct air capture or from point sources for further valorization (Kätelhön et al. 2019). To replace the steam cracker (IPCC 2022) or a Fischer-Tropsch process that may manufacture synthetic hydrocarbons, low-carbon methanol can be produced and used in make to order/make to assemble processes to convert methanol to olefins and aromatics (IPCC 2022). Another strategy involves employing biomass resources (Isikgor and Becer 2015) or existing residual streams to process carbon from renewable sources in defined biotechnological processes at the beginning of a product’s life cycle (IPCC 2022).
Third, the literature identifies a large number of new technologies relevant for mitigation in the chemical sector that have expected deployment dates ranging from now to 2025. However, their potential contribution to achieve deep decarbonization varies. Among those with the highest potential in this respect are various carbon capture methods and electrolytic hydrogen generation (IPCC 2022); conversely, methane pyrolysis, electrified steam cracking, and biomass-based ethanol-to-ethylene and lignin-to-BTX (benzene, toluene, and xylenes) pathways are considered medium in importance. While macro-level calculations demonstrate that large-scale usage of carbon circulation through CCU as a main approach is feasible in the chemicals industry, it would be highly energy-intensive, and the climatic effect would be heavily dependent on the source of CO2 and procedure for absorbing it (Kätelhön et al. 2019). CCS plays a particularly important role in those production processes for organic compounds that will continue to require a carbon source as an input (IPCC 2022). Yet the large-scale deployment of carbon dioxide removal technologies would require a complete reshaping of the chemical sector, with some industries dedicated to the production of sorbents, necessary to operate the technology. Sorbent production is currently only a by-product of processes in the chemical sector. Upscaling it would imply an increase in energy demand from the chemical sector, as these processes are very energy intensive (Realmonte et al. 2019).
Fourth, circularity practices are also relevant in the chemical sector. For instance, the pyrolysis of used plastics can produce both gas and naphtha pyrolysis oil, a portion of which might replace conventional naphtha as an energy source in the steam cracker (Honus et al. 2018). Catalytic cracking, hydrocracking, and polymer selective chemolysis are additional methods for chemical recycling (Ragaert et al. 2017). Achieving near-zero emissions may require combining chemical recycling with CCS to reduce carbon losses and process emissions. Finally, achieving deep emissions reductions requires demand-side strategies such as efficient end use, material efficiency, and reducing demand growth, in addition to recycling whenever possible to minimize the requirement for primary production (IPCC 2022).
4.4. Light Manufacturing
As previously discussed, light manufacturing comprises a diversified set of industries, each of which has specific production processes and technologies and, consequently, mitigation options. Process heat for applications such as drying consumes the most energy in the light manufacturing industry, and approximately 90 percent of the fossil fuels employed by the sector are used to generate process heat, whereas electricity is predominantly used to power motor-driven systems (IEA 2022d). As a result, fuel switching and electrification represent an important mitigation option, with high relevance for the achievement of deep decarbonization. For instance, current fossil-based approaches for heating and drying may be replaced by low- or zero-GHG electricity via direct resistance, high-temperature heat pumps, mechanical vapor recompression, induction, infrared, or other electrothermal processes. Direct solar heating is feasible for low-temperature requirements (100°C), while concentrated solar heating is a viable option for greater temperatures. Heat pumps on the market can provide 100°C–150°C, although temperatures of up to 280°C are possible. Where high temperatures (>1000°C) are necessary, plasma torches powered by electricity can be employed, as well as hydrogen or biogenic or synthetic combustible hydrocarbons. Energy efficiency also plays an important role, particularly aimed at using waste heat, which can be transferred from plant to plant at progressively lower temperatures or distributed as low-grade steam or hot water, then increased as needed via heat pumps and direct heating (IPCC 2022). These geographic clusters also could allow for reduced infrastructure costs for hydrogen generation and storage, as well as CO2 collection, transportation, and disposal (IEA 2022d). Material efficiency, CCS, and circular economy practices are not discussed for this sector due to its heterogeneity.
4.5. Aluminum and Nonferrous Metals
Primary aluminum is often produced in two stages, generally performed in the same location. In the first stage, the Bayer hydrometallurgical method is employed to separate aluminum oxide from bauxite ore; this requires temperatures of up to 200°C when sodium hydroxide is used to extract the aluminum oxide and up to 1000°C for kilning (IPCC 2022). In the second stage, the aluminum oxide is then electrolytically separated into oxygen and elemental aluminum using the Hall-Héroult method. This is by far the most energy-intensive phase of the aluminum production process. In both stages, electrification has the potential to significantly lower emissions if the electricity is from low- or zero-carbon sources. Electrification also has high emissions mitigation potential in the production process of other nonferrous metals, such as nickel, zinc, copper, magnesium, and titanium, which generate lower total emissions (IPCC 2022). This is the case, for instance, for ore extraction technologies using low-carbon electricity rather than pyrometallurgy, which requires heat to melt and extract ore once it has been smashed. Other important mitigation options for nonferrous metals include higher material efficiency and circularity practices aimed at the recycling of existing stock. In the case of nonferrous metals, many of these decarbonization options are available and have been used on occasion in the past, but they have not been widely used because they are costlier than traditional techniques and, with low fossil fuel prices, are not economically attractive (IPCC 2022).
4.6. Pulp and Paper
Pulp mills, integrated pulp and paper mills, and paper mills that use virgin pulpwood and other fiber sources, wastes and coproducts from wood product manufacture, and recycled paper as feedstock are all part of the pulp and paper industry (IPCC 2022). In chemical pulping operations, pulp mills often have access to bioenergy, which can supply most or all of their heat and electricity requirements. Mechanical pulping is mainly powered by electricity; hence decarbonization is dependent on grid emissions variables. Excluding the lime kiln in kraft pulp mills, temperature requirements are normally less than or equal to 150°C–200°C, mostly for heating and drying via steam. This indicates that this industry may be easily decarbonized by improvements in energy efficiency as well as fuel switching and electrification, including the use of high-temperature heat pumps. Electrification of pulp mills might, in the long run, make bioresidues now used for energy accessible as a carbon source for chemicals. The pulp and paper sector has the capability, resources, and knowledge to undertake these changes. Inertia in deploying low- or zero-carbon production options and technologies is primarily induced by equipment turnover rates and relative fuel and electricity prices. Pulp mills have been highlighted as prospective candidates for postcombustion carbon capture and storage, which may enable some net negative emissions (IPCC 2022).
5. Data on Industrial Energy Demand and Emissions
The availability, granularity. and comparability of industry-level data on energy demand and emissions across different countries constrain the ability to set up and calibrate models to explore possible pathways of industrial energy emissions reductions. That is to say, there currently is no detailed and comprehensive data source from which modelers can obtain information on energy demand and associated emissions by fuel type or by technology in the different industrial sectors in different countries over time. Several main challenges are present in this respect, and they often compound one another. These challenges are discussed in this section and can be observed in the detailed description of available databases, including data on industrial energy demand, presented in Appendix A. Note that these data-related challenges are additional to any difficulty linked with the modeling of diverse mitigation options across different sectors and different countries with the sufficient level of detail necessary to generate industry-level decarbonization pathways (discussed in the next section).
5.1. Lack of A Common Detailed Statistics Classification
There is currently no common detailed statistical classification of industrial sectors that is used worldwide to collect energy and emissions statistics. As a result, it is extremely challenging to collect data from different national statistical offices and compare them. The three most widely used approaches to classify industrial activities are the International Standard Industrial Classification of All Economic Activities (ISIC), the North American Industry Classification System (NAICS), and the Statistical Classification of Economic Activities in the European Community (NACE) (see Appendix B for details). These classifications are used by different countries and international institutions to gather specific data on industrial energy demand. While NAICS is used by the United States and Canada, NACE is the official classification of the EU, and ISIC is often used by international organizations such as the IEA.
5.2. Lack of Comprehensive Data on Energy Demand of Different Energy Carriers
Information on energy demand at the sectoral level exists for the major world economies but is rarely accompanied by details regarding different energy carriers. This constrains the ability to explore the role of fuel switching in reducing energy emissions at the sectoral level. For instance, the World Input-Output Database (WIOD; Timmer et al. 2015) November 2016 release consists of a series of databases covering 28 EU countries and 15 other major countries in the world for 2000–2014. The database provides energy and environmental accounts at the sectoral level but does not include details on the types of fuels used (e.g., different types of coal versus gas).
5.3. Lack of Detailed Sectorial Information on Energy Demand at the Level of Different Products
When detailed information is available at the energy carrier level, information on sectoral use or allocation is often lacking or dated. In the rare cases where this information is available, it cannot be broken down across the different products produced in a given sector. This constrains the ability to model sectoral specificities and thus to produce sectoral scenarios to deep decarbonization. For instance, the World Energy Balances database (IEA 2022f) contains detailed country-level statistics on all energy carriers but no sectoral breakdown.
5.4. Limited Geographic and Time Coverage of Detailed Databases
Databases exist that provide detailed information regarding energy demand by energy carriers at the sectoral level, but their coverage is not comprehensive in time or space. This limits the ability to model different sectors across different countries—or to simply account for sectoral dynamics in foreign countries through calibration. This is particularly problematic in several energy-intensive sectors that are not concentrated geographically and whose dynamics are not necessarily driven by specific countries.
5.5. Difficulty in Linking Data on Emissions and Fuel Inputs
Detailed databases providing information on GHG emissions exist, some of which include sectoral detail, but emissions data cannot easily be linked to data on fuel inputs. This means that overall emissions reduction pathways at the sectoral level may be modeled, but the drivers of emissions reductions at the sectoral level cannot be easily calibrated and studied. For instance, one would have to make assumptions as to whether emissions reductions come from fuel switching or from broader technological change dynamics. The IEA Air Emission Accounts provide data on 16 pollutants for up to 88 industrial sectors or subsectors for 40 countries (no data for the United States are available), but they do not include information on the energy carriers associated with the levels of emissions. A few privately owned databases on emissions by sector and country exist, but their reliability is often not clear, as they do not provide information on the specific energy inputs or details on how they are compiled.
5.6. Difficulty in Predicting Costs and Performance of Radically Novel Technologies
It is challenging to predict the cost and performance of radically novel technologies, as well as the speed of their diffusion once they have reached the market. This makes it hard to inform models regarding the prospects of technologies such as CCU, CCS, and other radically novel technologies, including promising technology options such as molten oxide electrolysis, new cement chemistries, or electric kilns. In this respect, several contributions have used expert elicitation methods to generate probabilistic forecasts of energy technology costs starting from the 1970s, focusing on nuclear and, more recently, on a set of low-carbon technologies including CCS (Verdolini et al. 2018). Yet recent contributions in the literature have shown that expert estimates of future technology costs tend to be pessimistic, with realized cost decreases surpassing expectations for all those technologies for which we have both observed and expert elicitation data (Meng et al. 2021; Wiser et al. 2021). Nevertheless, the generality of these results for radically novel technologies such as CCU and CCS cannot be taken for granted. Furthermore, projections of future energy technology costs generated based on learning curves often fail to capture the true trajectory of subsequently realized technology costs for radically novel energy technologies (Meng et al. 2021).
5.7. Lack of Comprehensive Data on Material and Energy Flows
A lack of detailed data on material and energy flows limits the ability to model circularity strategies and associated emissions reduction potentials. Researchers studying industrial metabolism have been developing methodological approaches to the modeling of circular practices relevant in the context of the provision of goods and services, but much work remains to properly integrate material efficiency measures into conventional climate change models. Efforts are being made to endogenize material efficiency methods within climate change modeling, assess the synergy effects and trade-offs between energy efficiency and material efficiency initiatives, and collect data for calculating the emissions saved from actual material efficiency actions. This necessitates analysts working in multidisciplinary teams and engaging with stakeholders throughout the whole material supply chain. A fruitful avenue of future research being pursued by several large-scale projects is the linking of models focused on material flows with models for the integrated assessment of energy, the economy, and carbon emissions, with a sufficient level of detail for industrial sectors (Haberl et al. 2019).
All known databases on industrial energy use and demand or emissions are plagued by at least one of these limitations (see Appendix A). Taken together, these limitations also imply that it is not possible to describe precisely and comprehensively all mitigation options available in the different sectors. For instance, scarcity of data on material greatly limits the ability to model some mitigation options, such as circularity.
Overall, the inability to precisely track over time and space how different energy technologies use different fuels with different carbon contents illustrates the trade-offs in modeling industrial energy demand. Modelers can focus on a single sector in a single country and, depending on the country of interest, potentially rely on detailed fuel and emissions data, or they can focus on modeling several sectors in one or more countries, without access to details on technological options or types of fuel.
6. Approaches for Industrial Energy Demand Modeling
The literature includes several approaches to modeling climate mitigation, based on the specific purposes for which they were conceived. Although the criteria for classifying the modeling approaches may vary, three key dimensions emerge as particularly useful in this respect (Lopion et al. 2018): the analytical approach underlying each model, the methodology used to generate decarbonization pathways, and the granularity with which different economic sectors, including industry, can be represented. In each of these dimensions, modelers can choose among different approaches, each of which has pros and cons. Importantly, within large-scale, complex models, such as integrated assessment models of the economy, energy, and climate feedbacks, different approaches may be adopted in different modules or parts of the model. Therefore, the three dimensions discussed here should be understood as broad guiding principles by which to classify models and understand their founding principles and not a strict classification method.
6.1. Analytical Approach: Bottom-up and Top-down Models
Models adopt either a bottom-up or a top-down analytical approach. Accordingly, the energy system would be described from either an engineering or an economic angle. Bottom-up models integrate a high level of technical information within the energy system modeling, as they give highly precise images of energy demand and supply technologies, quantifying the demand of energy and mass of each technology component (Herbst et al. 2012). Their key strength is the characterization of the interlinks between technology components based on the mutual dependencies of energy and mass flows. This feature enables them to provide in-depth analyses of sectoral strategies; however, it also determines their partial equilibrium nature, as bottom-up models ignore relationships between sectors. Disadvantages of bottom-up modeling are related to data requirements and the exclusion of intersectoral feedbacks. Modelers are largely reliant on data availability and trustworthiness to model technology diffusion, investments, and operational costs. The main criticism of bottom-up modeling concerns the failure to account for program costs, the feedback of energy policy, and the lack of macro-effects of the assumed technology shift on general economic activity, structural changes, employment, and pricing (Herbst et al. 2012).
Top-down models describe technologies as a set of techniques by which inputs such as capital, labor, and energy can be transferred into useful outputs; therefore, they give an aggregated description of the energy system but lack detailed technological variability (IPCC 2022). They have a high level of endogenous modeling of social and economic behavioral relationships, such as those among welfare, economic growth, and employment. This type of modeling enables a full understanding of energy policy effects on the economy of a region or country (Herbst et al. 2012). A drawback is that because of their inadequate technological detail, they may be unable to provide an accurate picture of technical advances, nonmonetary hurdles to energy efficiency, or regulations for certain technologies. Top-down models are not suitable to portray credible technology prospects, especially as discontinuity would apply in the long run, when intrasectoral structural change would occur as a result of technological development and saturation (Herbst et al. 2012). Moreover, because top-down modeling approaches are based on the theory of efficiently allocating markets, they tend to underestimate the complex nature of barriers and their nonmonetary forms, such as a lack of knowledge, insufficient decision routines, or group-specific preferences of technology producers or wholesalers. Four key top-down approaches are input-output models, computable general equilibrium (CGE) models, econometric models, and system dynamics models.
Because of their inherent differences, these two approaches are useful in answering radically different questions. Bottom-up models are often used when there is a specific interest in producing decarbonization pathways for specific sectors, for which assumptions are made (and imposed on the model) regarding all other, more aggregate drivers of emissions. Top-down models are necessary if the focus of the analysis is modeling feedback loops between climate policies and welfare, employment, and economic growth. Finally, because of the complementarity between bottom-up and top-down models, hybrid approaches have been used where the macroeconomy interacts with an energy system module.
6.2. Methodology: Simulation and Optimization Approaches
Models can adopt either a simulation or an optimization approach to generate decarbonization pathways; often, both approaches can be used in different parts of the same model. Simulation allows for reproducing a system via interpreting the principles of its operations. These models represent the key behaviors and characteristics of a given process (in our case, industrial energy demand), while the simulation allows the model to represent how the process evolves under different conditions over time. Simulation can be static, if it describes the current system as a snapshot, or dynamic, if the current output is affected by evolution from previous periods. Simulation models can shed light on the endogenous relationships between variables to reproduce real-world systems, and although this may happen in a simplified fashion, they can also be rather complex. Typical applications of simulation models are exploratory analyses, where the modeler starts with realistic values for inputs and modifies them within reasonable ranges to determine what happens with the outputs. By tweaking the initial conditions, the behavior of the simulated system changes and can be observed. A class of simulation models explores multiagent approaches, interpreting the decisionmaking processes of key energy system players, which are suited to interpret market imperfections and consumer and firm heterogeneity (Hansen et al. 2019).
Optimization is used to determine optimal system design or optimal choices. Unlike simulation models, optimization models provide the best solution for a given answer. They consist of three elements: the objective function, decision variables, and the constraints. Successful optimization depends on properly identifying the constraints placed on various parameters—for example, the maximum level of energy from a given energy source or emissions from a given source.
Depending on the description of the energy system in a given model, optimization and simulation models can be demanding in terms of computing power and time and can implement sensitivity analyses to explore robustness of results at different levels of complexity. The distinction between optimization and simulation seems particularly relevant for the modeling of mitigation options that are novel and disruptive and affect the timing of when new technologies may enter the market. Optimization models apply typically intertemporal approaches, which means that availability and costs of all the technologies in the future are known from the start of the modeling. Simulation models are typically coupled with limited foresight, which means that information on technologies is limited at a certain time in the simulation. This is critical for modeling radically novel technologies, such as radical deep decarbonization strategies, where simulation models display more inertia toward novel technology diffusion than optimization models, which show an earlier market uptake. The introduction of novel technologies is, however, linked to the level of technological detail of an energy system, as well as to a complex set of parameters governing the technology capacity and growth in the market.
6.3. Granularity of Sectoral Modeling
Finally, models differ with respect to the detail and granularity with which they depict the energy sector, its energy and emissions. Models can depict a single industrial sector, aggregating all production activities (typical of top-down models) or specifying a few key sectors of interest while lumping all other economic activities in the “other” category, or they can be very detailed and include a large number of sectors and subsectors (typical of bottom-up models). Several trade-offs are associated with the choice of aggregate versus detailed representation. The more sectorally detailed a model, the better it can depict differences among the various mitigation options within and across sectors. This can be achieved only if very detailed data are available to feed the mode and usually leads to long computing times to achieve a solution.
The variation of models along these three dimensions has important implications for modeling industrial energy demand and emissions. Bottom-up, sectorally-detailed models are more likely to allow the study of the choices among the different sector-specific mitigation options described in Section 4. Yet they often abstract from general equilibrium effects and are based on strong assumptions regarding the development of macro-level variables and indicators. This limits the ability to model circularity practices that go beyond a specific sector or geography and understanding of the global implications of choosing different mitigation options in different sectors or countries. The opposite is true for top-down aggregated models.
Given these trade-offs, over time a larger number of models have adopted a hybrid approach, including features of both top-down and bottom-up models. Sometimes models also combine optimization and simulation in different modules or portray certain aspects of the economy at an aggregated level while they detail specific sectors of interest. Integrated assessment models (IAMs), for instance, often use a hybrid approach for energy demand and emissions.
An IAM is a specific type of model that combines data gathered from two or even more disciplines into a single framework i.e., the economy, the energy system, and the environment. Researchers in physical, biological, earth, economic, and social sciences have typically produced elements of these models autonomously. The need to study interdisciplinary interactions among these components, as in the case of climate change, has led to the development of cohesive and consistent frameworks that include several components to assess the status and implications of environmental change more accurately, as well as possible solutions (Bosetti 2021). Some energy-intensive industries, such as iron and steel or cement, are included individually in most top-down IAMs, but few sector-specific technologies are expressly included. Instead, advances in energy efficiency in the industry sector and its subsectors are frequently dictated by exogenous assumptions or are a function of energy costs. Similarly, fuel switching is mostly caused by changes in relative fuel prices, which are affected by CO2 price trends (Pauliuk et al. 2017). Fuel switching can be regulated in IAMs that include specific technologies based on the features of those technologies, but in IAMs that lack technological detail, more generic limits of fuel switching in the industry sector are integrated.
Most IAMs employ aggregated, top-down industrial sector models that are calibrated from long-term historical data, such as the introduction of new technologies or fuels. As a result, these models can implicitly reflect real-world constraints in the entire sector that bottom-up approaches may not completely explore. These constraints may result from factors such as infrastructure building delays or market participants’ insufficient understanding of new technology. Furthermore, because IAMs model the climate system, these models can mainly account for the effects of climate change on the growth and structure of economies (Pauliuk et al. 2017). However, top-down models are often limited in their portrayal of specific technologies and processes in the industry sector, especially of technology-driven structural change. This lack of technological information restricts the models’ utility in analyzing technology- and sector-specific mitigation methods and policies. Top-down models also feature a highly aggregated depiction of industrial energy demand, making it difficult to evaluate demand-side mitigation techniques such as recycling, product-service efficiency, and demand reduction choices (Pauliuk et al. 2017).
7. The Modeling of Innovation and Technological Change and Relevant Policies
This section provides a brief overview of the different approaches to portray technological change in low-carbon emissions technologies, including radically novel technologies, relevant for industrial sectors. As noted in the previous section, the different methodologies to model innovation may coexist in a given model. Another related key point regards the ability of models to mimic how specific policies and policy instruments affect the different phases of the innovation process.
Innovation comprises stages ranging from basic R&D to prototyping, demonstration, and larger-scale market diffusion. How a model does or does not account for all these different stages affects the speed and depth of emissions reductions (Blanco et al. 2022).
In most models, a novel technology enters the market when its costs decrease and become equal to, or lower than, the costs of the dominant technology (van Sluisveld et al. 2020). Technology cost decrease can be calibrated using historical data or relying on expert estimates. The former relies on the learning curve approach: it assumes that costs decrease either as a function of R&D investment (learning-by-researching) or as a function of cumulative production or time (Nagy et al. 2013). Learning curve model parameters are derived from historical data and then used to project future cost decreases. The latter approach, which relies on expert estimates regarding the trajectory of future costs, has been used for radically novel technologies, for which historical data are not available (Verdolini et al. 2018). This was the case for the cost of nuclear power in the 1970s and the cost of CCS and other radically novel technologies more recently. Recent evidence has shown that both learning curve and expert-based approaches underestimate the cost reductions in several low-carbon technologies, with expert-based methods emerging as particularly pessimistic. Yet these results may not necessarily extend to more radical technologies. Moreover, no alternative approach exists in terms of informing the modeling of innovation (Meng et al. 2021).
Another important distinction between models is whether innovation is modeled exogenously or endogenously. In the former, technology costs are assumed to vary over time at some fixed rate, which can be derived from either historical data or expert estimates or by relying on marginal abatement cost curves derived elsewhere. In the latter, technology cost decreases are calibrated to historical values, but costs are a choice variable in the model, and agents can decide how much to invest in it (Krey et al. 2019; Mercure et al. 2016). For example, technology cost reductions can be assumed to follow a predefined (historically observed) pattern or can be modeled as a function of R&D investment, which can be chosen (as opposed to being imposed) in the model. Modeling innovation exogenously rather than endogenously generally underestimates future cost reductions; for instance, it ignores policy-induced carbon-saving technological change or spillovers. In any case, assumptions regarding the speed of innovation and technological change can be tested through sensitivity analysis (Blanco et al. 2022).
Finally, most models rely on the assumption that when the cost of a new technology becomes competitive, the technology will naturally diffuse through the economy following a certain pattern, such as an S-shaped diffusion pattern (Hall 2006). This often results in an overestimation of the diffusion potential of many novel technologies, because diffusion is driven solely by cost in the models, and no consideration is given to other key barriers that may slow down deployment. These include noncost, nontechnological barriers or enablers regarding behaviors, society and institutions (e.g., path dependence or the coevolution of technology clusters over time), the risk aversion of users and capital markets, personal preferences and perceptions in a world of heterogeneous agents, network or infrastructure externalities, and a lack of supportive institutional frameworks (Iyer et al. 2015; Baker et al. 2015; Marangoni and Tavoni 2014; van Sluisveld et al. 2020; Napp et al. 2017; Biresselioglu et al. 2020). Ignoring these barriers generally leads to an overestimation of technology diffusion in such models. To address these issues, models can impose ad hoc restrictions on certain technologies, such as a ceiling to penetration. In addition, these barriers can be accounted for through scenario narratives, such as those in the Shared Socioeconomic Pathways (Riahi et al. 2017), in which assumptions about technology adoption span a plausible range of values. The literature also indicates that models tend to underestimate cost reduction potentials but to overestimate penetration rates. Careful calibration and sensitivity analysis are necessary to test the robustness of model results regarding technology innovation and diffusion (Blanco et al. 2022).
Given the key role that policies play in the innovation process, it is paramount to understand how they can be modeled and accounted for. A large number of contributions have explored how different policy instruments influence the availability of novel technologies, cost decreases over time, and technology diffusion in the market. Policy instruments are traditionally categorized as supply-side policies, which target technology innovation directly in the form of R&D investments or subsidies for research, and demand-side policies, which include both command-and-control policies such as emissions limits and market-based policies such as taxes or permits (IPCC 2022). A general result emerging from this literature is that low-emissions innovation and technology diffusion can be effectively supported through policy packages tailored to national contexts and technological characteristics. Yet low-emissions innovation can jointly achieve environmental, social, and economic benefits only if environmental policies are part of a broader, comprehensive and tailored policy package that addresses potential negative impacts and strengthens governance of the innovation system (Penasco et al. 2021; IPCC 2022).
No available models are able to account for such complex policy instruments. First and foremost, models portraying innovation and technology diffusion exogenously can account for the impact of different policy instruments on cost and diffusion dynamics only through sensitivity analysis. Second, even models that represent innovation as an endogenous process include only a limited set of policy instruments: taxes or markets for permits, emissions limits, and emissions standards. The potential role of instruments such as public procurement, public-private partnership, voluntary industry standards, or the nuances of policy design that affect the effectiveness of the policy instrument cannot be studied in depth, and these instruments are thus overlooked or implicitly assumed. Finally, a number of nonenvironmental policies, such as those targeting inflation or the ease of accessing capital, can influence innovation. These often are not appropriately accounted for in models of industrial energy demand.
8. Specific Models for Industry Energy Demand and Emissions
This section gives an overview of the most widely known models used to forecast industrial energy demand. Details are provided in Appendix C, where we classify each model based on the three criteria discussed in the previous section (top-down or bottom-up, simulation or optimization, and level of granularity of the industry module), describe the mechanisms through which the specific model represents industry energy demand and the main assumptions made, and note an application in the literature. Given the nature of this paper, we exclude models in which the entire industrial sector is portrayed as a single sector. The models analyzed for this paper and presented in Appendix C are as follows:
- World Energy Model, International Energy Agency
- National Energy Modeling System, US Energy Information Administration
- Global Change Assessment Model, Pacific Northwest National Laboratory
- Regional Model of Investment and Development, Potsdam Institute for Climate Impact Research
- Modular Energy System Simulation Environment, Imperial College London
- The Integrated MARKAL-EFOM System, Imperial College London, Grantham Institute
- IMAGE, PBL Netherlands Environmental Assessment Agency
- Material Economics Modelling Framework, Material Economics
- Energy-Environment-Economy Global Macro-Economic, Cambridge Econometrics
- Industrial Sector Energy Efficiency Model for Iron and Steel, Lawrence Berkeley National Laboratory
- Universal Industrial Sectors Integrated Solutions, US Environmental Protection Agency
- Hybrid Technological Economic Platform, CENSE and College of William and Mary
- FORECAST, Fraunhofer Institute for Systems and Innovation Research
A main result of this analysis relates to the granularity with which radical technologies are modeled. Many of the energy system models and the integrated assessment model described in Appendix C are not detailed enough to model separately some of the specific key mitigation options described in Section 4—such as the electrowinning process or molten oxide electrolysis—in different energy-intensive sectors. Many provide only high-level details on the process of innovation and its direction. This is also true in the case of detailed sectoral models, which generally are not technology- or subtechnology-specific. Moreover, these models do not describe circularity practices, such as the difference between conventional and new types of SCMs, mostly because they do not model material flows but rather model the cost of a given technology or its energy demand and efficiency. Importantly, efforts are currently underway to integrate the modeling of GHG emissions with the modeling of material flows, yet this process has proven to be challenging, and no model is currently available that incorporates simultaneously attention to GHG emissions and the material side of the economy.
9. Conclusions
The aim of this paper is to improve the understanding of challenges linked with the modeling of emissions and energy demand in key energy-intensive industrial sectors, with a particular focus on the role that new low-carbon technologies can play in achieving deep mitigation targets. With the aim of highlighting the sectoral peculiarities of various emissions reduction strategies, we first discuss the relevance of different emissions reduction approaches—fuel switching and electrification, carbon efficiency, material efficiency, carbon capture and storage, and circular economy practices—for six high-energy-demand sectors: steel, cement, chemicals, light manufacturing, aluminum, and pulp and paper. To highlight the limitations of modeling industrial energy demand and associated emissions, we then detail the data limitations that constrain model calibration and describe the methodologies that characterize the most well-known integrated assessment models of industrial energy demand.
Three key insights emerge from this analysis. First and foremost, models need to be further developed to appropriately capture industrial decarbonization options and the effects of policies. None of the widely used industrial energy and emissions models have the capacity to portray the adoption and diffusion of granular technological options for emissions reduction in energy-intensive sectors. No model can portray heterogeneous innovation and technology adoption dynamics due to firm characteristics (e.g., size or access to capital). Most available models, including those with relatively high sectoral detail, are not technology- or sub-technology-specific and rely on only a high-level representation of the innovation process. Moreover, available IAMs do not track material flows and consequently cannot describe circularity practices and their relevance for mitigation. While efforts in this respect are underway, much work remains ahead for the research community. In this respect, the soft or hard linking of available models with other technology-specific more detailed models, including agent-based models emerges as an important research avenue for the future.
Data availability also represents a key barrier for model development. Data collection efforts are inadequate and need to be scaled up. However, marked firm heterogeneity both within and across sectors is a main barrier in this respect. Given the lack of a coordinated, state-driven effort to gather statistics on industrial energy demand and use, researchers have difficulty obtaining the necessary data. When entrepreneurs are willing to share, data are often limited and lack panel dimension or cannot be compared across countries and sectors because of a lack of precise collection standards. This situation could be partly resolved if policymakers create a framework aimed at facilitating the sharing of data regarding the environmental performance of small and medium-size enterprises or entrust national statistical offices with this task. This would allow researchers to rely on data whose consistency has been certified by numerous studies, and data harmonization would require less time than when performing the same operations multiple times on the same dataset.
Last but not least, while a portfolio of different options is available in all industrial sectors to reduce energy demand, existing technologies are not sufficient to achieve deep decarbonization goals across industrial sectors. Nor is it possible to achieve these goals by relying on only one technological option. Thus R&D on relevant decarbonization technologies needs to be sped up to ensure the further development of additional low-carbon industrial technologies in all energy-intensive sectors and make available other decarbonization solutions that are not in use yet.
Authors

Elena Verdolini
European Institute on Economics and the Environment

Lorenzo Torreggiani
European Institute on Economics and the Environment

Sarah Giarola
Polytechnic University of Milan

Massimo Tavoni
European Institute on Economics and the Environment