Save It or Spend It? How New Mexico, Pennsylvania, and Texas Manage Oil and Gas Revenues for the Future
This report analyzes how the state governments of three major fossil fuel–producing states—Texas, New Mexico, and Pennsylvania—collect and use oil and gas revenues.
Abstract
Energy development often provides substantial economic benefits as well as changes to environmental and health conditions for host communities. In this analysis, we seek to understand one aspect of energy development with important short- and long-term implications: how state governments collect and use oil and gas revenues. We focus on the top US oil- and gas-producing states: New Mexico, Pennsylvania, and Texas, which offer three distinct models for collecting and using revenue to manage current and future fiscal health. We find that New Mexico collects the largest share of revenues among the three states (roughly 20 percent of production value in 2023) and invests roughly half in long-term savings funds that will support education and other government services in perpetuity. Texas collects roughly 10 percent of production value and invests roughly one-fifth in long-term savings earmarked for statewide education, along with some investments in short-term savings. Pennsylvania collects just 3 percent and saves little to none for the future. Although New Mexico’s approach robustly supports statewide fiscal health, none of these states have policies to protect the finances of the local governments in host communities (specifically, counties, municipalities, and special districts), which may face significant fiscal risk from short-term booms and busts and longer-term risks from an energy transition.

1. Introduction and Background
1.1. Environmental, Social, and Economic Effects of Oil and Gas Development
The oil and gas industry provides a mix of short-term benefits and risks to host communities. These risks include air and water pollution from a variety of sources (Patterson et al. 2017; Abualfaraj et al. 2018; Fann et al. 2018), which in turn can harm residents’ health (Rasmussen et al. 2016; Currie et al. 2017; Bartik et al. 2019; Hill and Ma 2022) and reduce property values for certain homeowners (Boxall et al. 2005; Muehlenbachs et al. 2015). Community-level effects can include increased risk of traffic accidents (Graham et al. 2015; Xu and Xu 2020), changes in community character (Jacquet 2014; Klasic et al. 2022), and higher crime rates during boom periods (James and Smith 2017; Andrews and Deza 2018; Gourley and Madonia 2018).
The short-term local economic benefits of the industry include high-paying employment opportunities (Weber 2012; Feyrer et al. 2017), lease revenue for landowners (Brown et al. 2016, 2019; Feyrer et al. 2017), and revenue that supports essential public services (Haggerty 2015; Weber et al. 2016; Newell and Raimi 2018). However, these economic benefits are volatile and change rapidly with swings in oil and gas prices (Raimi et al. 2019; Klasic et al. 2022), which are almost entirely outside the control of local or state policymakers.
Over the longer term, the economic effects of the oil and gas industry on host communities are mixed. A substantial literature has examined whether, and to what extent, US oil and gas communities suffer from a “resource curse,” with evidence suggesting that outcomes vary across geographies and over time (James and James 2011; Ouedraogo 2012; Haggerty et al. 2014; Allcott and Keniston 2018). Looking toward the future, global demand for oil and natural gas is projected to stagnate or decline under most scenarios and fall rapidly under ambitious climate policies (Raimi et al. 2024). In a future with declining hydrocarbon demand, producing communities in the United States (and around the world) will face profound questions about their economic futures (Raimi and Kaufman 2024).
In this report, we examine one of the biggest economic issues facing oil- and gas-producing regions of the United States: public revenues. Specifically, we examine whether existing oil and gas revenue policies support long-term fiscal stability in New Mexico, Texas, and Pennsylvania. As Figures 1 and 2 illustrate, Texas is the country’s largest producer of both oil and natural gas, New Mexico is the second-largest producer of oil, and Pennsylvania, the second-largest producer of gas.
Figure 1. Crude Oil Production for Select States, 1981–2024
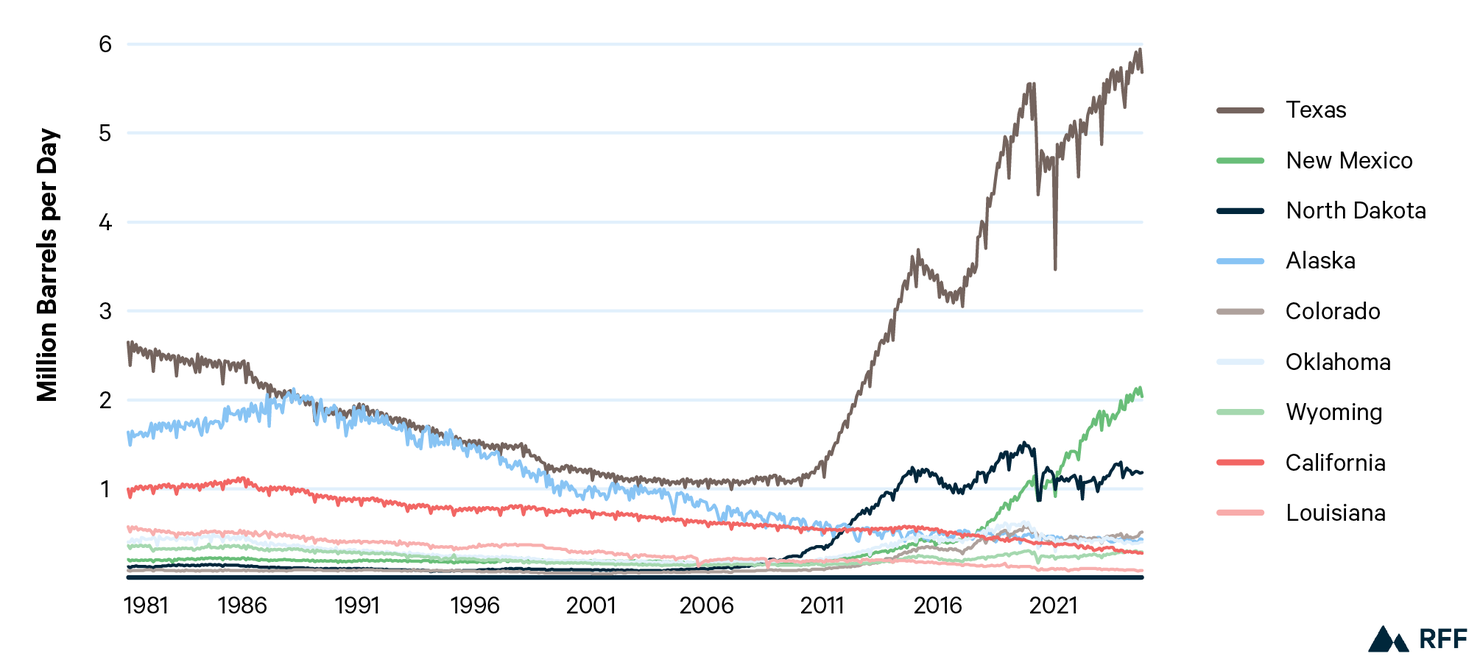
Source: US EIA. Data through November 2024.
Figure 2. Natural Gas Production for Select States, 2000–2024
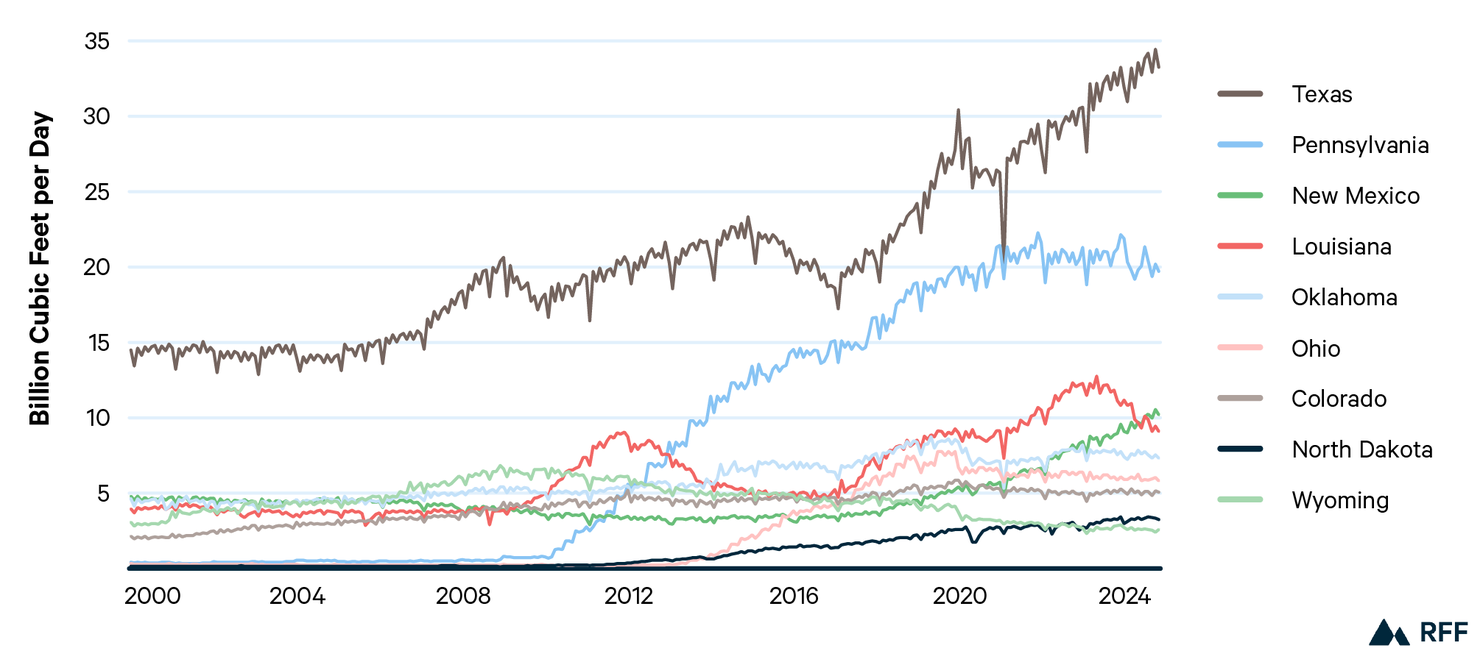
Note: billion cubic feet per day of marketed production.
Source: US EIA. State-level data not available before 2000. Data through November 2024.
This analysis does not seek to assess the considerable fiscal risks associated with the decommissioning of oil and gas infrastructure in the United States. For example, the costs of remediating orphaned oil and gas wells, which may number in the millions, pose large financial burdens on US states and the federal government (Raimi et al. 2021; Agerton et al. 2023; Kang et al. 2023). Additional public costs may also come from decommissioning other oil and gas infrastructure, such as refineries, storage facilities, and pipelines (Kaiser 2021). Future work to estimate these liabilities would be valuable when considering the full range of fiscal benefits and costs of industry activity.
1.2. Oil and Gas Revenue Policies
State governments determine how to raise revenue from oil and gas production and how to use it. In theory, taxing oil and gas extraction can be justified on efficiency grounds because taxation can capture a portion of economic rents generated by resource production without distorting investment decisions, and those revenues can be directed to the public good (Hotelling 1931). Resource taxes can also, depending on the use of the revenues, compensate future generations for the extraction of nonrenewable resources, such as oil and gas (Hartwick 1977).
In practice, US states collect severance taxes (paid by firms for the privilege of severing a mineral from Earth), leasing revenue (e.g., royalties) from production on publicly owned lands, income taxes, sales taxes, local property taxes, and several smaller revenue streams. With the exception of local property taxes, these revenues are typically collected by state governments, which then decide how much to allocate to various purposes—short-term spending, long-term saving, allocations to local governments, and other priorities. Local property taxes are typically collected and used by counties, school districts, and municipalities.
Previous work has shown that increased revenue from natural resource development, such as oil and gas production, encourages governments to reduce dependence on other revenue sources, raise spending, and increase savings (James 2015). Savings give governments a fiscal cushion that can smooth the effects of short-term booms and busts, as well as longer-term declines driven by geological, technological, or policy factors.
But using higher oil and gas revenues to reduce other taxes (e.g., personal income taxes) can introduce considerable fiscal risks because political and in some cases legal factors make it difficult or impossible for governments to increase tax rates when resource revenues decline. For example, Alaska eliminated income taxes in 1981, shortly after oil production from its North Slope began flowing to market (Wertz 2011), and has not reinstated them despite steadily declining production volumes. Similar dynamics exist for local governments in Texas and other states where local property tax rates in oil- and gas-producing counties decline by default during boom periods but require voter approval to reset during busts (Newell and Raimi 2018), and in Wyoming, where fossil resource revenues play a dominant role in state and local budgets (Freudenthal 2022).
One approach that governments can take to reduce fiscal risk is to invest oil and gas revenues in long-term savings funds that generate revenue for public services in perpetuity. These “permanent funds” are capitalized by revenues from oil and gas production, and the investment earnings that those funds generate are used to fund services. Crucially, these funds are protected from the annual (or biannual) budget process and cannot be “raided” by state legislators facing near-term budget gaps.
The best-known examples of this approach are the sovereign wealth funds for major oil-exporting nations: Norway’s Sovereign Wealth Fund stood at roughly $1.9 trillion as of July 2025, and Saudi Arabia’s Public Investment Fund held $1.2 trillion in assets as of 2024. Norges Bank Investment Management (2025) reported on July 8, 2025, that the fund value was 19,543 billion kroner, roughly equivalent to $1,933 billion USD at current exchange rates. The most recent audited financial report for the Public Investment Fund (KPMG 2025) values its assets at 4,321 billion riyal, roughly equivalent to $1,167 billion USD at current exchange rates. But several US states, including New Mexico, Texas, Wyoming, North Dakota, and Alaska, also make use of permanent funds (Newell and Raimi 2018).
In addition to funding current state expenditures and investing in future spending, revenues from US oil and gas production support local school districts and institutions of higher education. Increased oil and gas production has substantially boosted these revenue flows. However, multiple studies have found that increased funding from energy sources, including oil, gas, and wind, have small or even negative effects on educational outcomes in affected school districts (Marchand and Weber 2020; Brunner et al. 2022; Schiller and Slechten 2025).
In principle, investing oil and gas revenues in education should build human capital and improve the prospects for future economic growth (assuming a sufficient proportion of locally educated students remain in-state). However, revenues from oil and gas production that are earmarked for education (or other purposes) could crowd out funding from other revenue sources or lead policymakers to reduce other tax rates, potentially resulting in no net increase in spending on education. Although our analysis does not attempt to answer these and other questions related to revenue policies and long-term economic development, they remain important determinants of social and economic well-being for communities and states across the nation.
1.3. New Mexico, Pennsylvania, and Texas
New Mexico, Pennsylvania, and Texas have rich and varied histories of oil and gas development. In Pennsylvania, where the oil industry began in 1859 (Yergin 1990), extraction occurred at scale for decades before meaningful regulation emerged to govern the industry, resulting in—among other things—hundreds of thousands of orphaned wells (Kang et al. 2023). Oil extraction continues today in Pennsylvania in very low quantities, mostly in the historical oil region centered in Venango County in the state’s northwest. In the first decade of the 2000s, operators began to unlock natural gas at scale from “unconventional” (i.e., shale) rocks, such as the Marcellus, with wells scattered across a crescent stretching from Greene County in the state’s southwest to Susquehanna County in the northeast.
Despite that long history of production, Pennsylvania has never imposed a severance tax, nor does it allow local governments to apply their ad valorem property taxes to oil or natural gas production property. Instead, legislators passed a law in 2012 known as Act 13, which established annual fees for each unconventional (i.e., shale) well and directed a substantial portion of the revenues to communities where drilling occurred. Although the state is now the second-largest natural gas producer, its large and diverse economy and major cities like Philadelphia and Pittsburgh mean that the oil and gas industry accounted for 1.3 percent of state economic output in calendar year (CY) 2023, just slightly higher than the national average of 1.2 percent. GDP data in this section come from the U.S. Bureau of Economic Analysis “Regional data” interactive online data system. The contribution of the upstream oil and gas industry to state GDP is calculated by summing the sectors “Oil and gas extraction” and “Support activities for mining” divided by the “All industry total” category.
In Texas, oil was produced in modest quantities until 1901, when a well drilled into the Spindletop field in southeastern Texas gushed an estimated 100,000 barrels per day, ushering in a new scale of mass production for the soon-to-be-global industry (Yergin 1990). In the decades that followed, Texas became the world’s largest oil producer, with discoveries made across the state.
From the 1970s through the 2000s, production plateaued and declined in Texas (and nationally), but extraction experienced a renaissance with the application of horizontal drilling and hydraulic fracturing technologies applied at scale in the 2000s. Today, Texas is producing more oil and gas than ever before, dominated by the Permian Basin in West Texas (which stretches into eastern New Mexico), plus contributions from the Eagle Ford Shale (South Texas), Haynesville Shale (East Texas), and elsewhere. Corporate headquarters and regional offices can be found in several major cities, including greater Houston, Fort Worth, and Midland. Statewide, the industry accounted for 7.6 percent of economic output in CY2023.
New Mexico’s oil industry began in 1922 with wells drilled on the Navajo Nation’s reservation in the San Juan Basin, in the northwestern corner of the state, followed by production from the Permian Basin in the southeast in the late 1920s. By the turn of the century, production in the San Juan Basin was dominated by natural gas, which peaked around 2000 and has steadily declined since. In the Permian Basin, oil and gas production have spiked to record levels in recent years due to the application of horizontal drilling and hydraulic fracturing, growing at an even more rapid rate than on the Texas side of the border (Raimi and Whitlock 2023).
Although few oil and gas companies are headquartered in New Mexico, oil and gas extraction accounted for 9.6 percent of the state’s economic output in CY2023 and an even greater share of its government revenue, as we discuss in detail in Sections 3 and 4.
As the oil and gas industry has evolved in each state, regulatory structures have grown and adapted to track production levels, maximize production from available resources, and manage environmental hazards. In the following section, we describe the policies governing the collection and allocation of revenue that comes directly from oil and gas extraction.
2. Data and Methods
We gathered data and analyzed existing public policies from our three states of interest to estimate how oil and gas production generates revenues for state current expenditures, state permanent funds, local governments, and educational systems. We began by identifying all major mechanisms through which states and local governments collect revenue directly from oil and gas extraction and related activities. We then searched for data quantifying revenue collections for each mechanism in fiscal years (FY) 2023 and 2024. When data were not publicly available, we emailed relevant state agencies or submitted public records requests. In the rare cases where data were not made available, we used various procedures to estimate the contribution of oil and gas production to revenue flows based on available data and statutes.
We summarized each revenue mechanism by documenting how the revenue is collected (e.g., tax rate, tax base, or royalty rate), which government entity collects the revenue, and other pertinent details of the policy. Details on each revenue source, including data sources, collection processes, allocation processes, and—where necessary—our methods to estimate revenue flows, are described in detail in Appendix B. As described in Appendix B, we relied in part on generative artificial intelligence tools to identify and summarize relevant sections of state code, which we then manually verified to ensure accuracy and edited to improve clarity.
Because state revenue mechanisms vary in their structures, naming conventions, and implementation, we needed to create a standardized classification system to compare policies across states. As in previous work (Newell and Raimi 2018), we grouped revenue sources into the following categories:
- Federal lands. Revenues distributed to states by the federal government from oil and gas leases on federally owned lands in the state. This category typically includes royalties, rents, and bonus payments made when leases are signed.
- State lands. Revenues from oil and gas leases on state-owned lands. This source typically includes royalties, rents, and bonus payments made when leases are signed.
- Severance tax (or similar). A tax or fee applied by the state for the privilege of severing a nonrenewable mineral from the subsurface. These taxes are typically applied to the value of oil and gas produced from each well, although Pennsylvania’s Impact Fee instead imposes an annual fee on each well drilled into a shale formation.
- Property tax. Ad valorem taxes applied to the value of oil and gas property in the state. Methods for determining the value of property vary by state, and Pennsylvania exempts oil and gas production property from these taxes.
- Sales tax. Taxes applied to the sale of goods and services in a state. We include the Texas and Pennsylvania sales and use taxes in this category.
- Income tax. Taxes applied to the net or gross income of a business or individual doing business in a state. For ease of comparison, we include New Mexico’s gross receipts tax, its oil and gas proceeds withholding tax, Texas’ oil well service tax, and Texas’ franchise tax in this category, alongside Pennsylvania’s personal and corporate income taxes.
- Other. Other revenue mechanisms (e.g., regulatory fees that support the provision of government services; financial penalties that companies pay because of noncompliance with regulations).
Next, we searched for data documenting how these revenues were distributed after collection. In some cases, this information is clearly provided on state or local websites or in monthly and annual reports. When revenue distribution was not clearly quantified in public reports (which is often the case), we sought information from relevant state offices through email or public records requests. In cases where agencies did not provide information on revenue allocations, we relied on state statutes along with public data on production volumes and prices to estimate how revenues flowed to different levels and types of government. To produce these estimates, we carefully documented provisions of state statutes and applied the appropriate formulas to estimate revenue flows (see Appendix B).
Because revenues are allocated to a wide variety of purposes across state and local public entities, we created a classification system to distinguish revenue uses, similar to the approach taken in Newell and Raimi (2018). We classified revenue allocations into the following groups:
- State current expenditures. Revenues that states spend in the current fiscal year or that states can expect to spend in the near future (i.e., the next budget cycle). We include states’ “rainy day” savings funds that are designed to balance short-term shortfalls.
- State permanent funds. Revenues that are invested in a long-term savings fund, the principal of which is protected from use for near-term spending. These funds are designed to generate revenue for public purposes in perpetuity.
- State education current expenditures. Revenues that are specifically earmarked for higher or primary education. We do not include appropriations in the regular budget process because we cannot distinguish between oil- and gas-generated revenues and other revenues used in that process.
- State education permanent funds. Revenues that are invested in a long-term savings fund, the principal of which is protected from use for near-term spending. These funds are designed to generate revenue specifically for higher or primary education in perpetuity.
- School districts. Revenues that are collected by or allocated directly to school districts.
- Local governments. For simplicity, we group the following three types of local government entities into a single category:
- Counties: revenues that are collected by or allocated directly to county governments.
- Municipalities: revenues that are collected by or allocated directly to cities, towns, townships, villages, or similar subcounty government units.
- Other local governments: revenues that are collected by or allocated directly to “special districts,” such as library districts, hospital districts, and fire districts. These taxing entities may be subcounty or cross-county jurisdictions.
We do not include revenues flowing to Tribal nations because of data limitations. When oil and gas production occurs on reservation lands (as it does in large quantities in New Mexico), the U.S. federal government collects royalties and other revenues on behalf of Tribal nations and Tribal citizens, then distributes those revenues back to the relevant Tribal nation or citizen. In addition, Tribal nations often collect severance taxes from production occurring on reservation lands. However, none of these revenue data are made public, preventing us from including them in this analysis.
The following section reports our results.
3. Results
3.1. Revenue Collection
Our results reveal that New Mexico, Pennsylvania, and Texas take very different approaches to oil and gas fiscal policy. In FY2023 (the most recent year for which complete data are available), government collections were $909 million, or 3.4 percent of the value of all oil and gas produced in Pennsylvania; $19.4 billion, or 10.1 percent in Texas; and $12.3 billion, or 19.7 percent in New Mexico. The largest revenue mechanisms were severance taxes (35 percent of all collections on average across the three states), state land leases (32 percent), income taxes (12 percent), property taxes (9 percent), and federal land leases (8 percent). These figures vary widely among the states, with Pennsylvania and New Mexico deriving a large share of revenues from public land leases, whereas Texas generates more revenue from severance and property taxes (Figure 3).
The passage of the One Big Beautiful Bill Act (OBBBA) in July 2025, which reduces federal royalty rates from 16.67 percent to 12.5 percent, will have a considerable effect on New Mexico’s future oil and gas revenue collections from federal lands. Recent analysis estimates that this will reduce the state’s share of federal leasing revenues by $1.7 billion from 2026 to 2035 (Prest 2025). However, New Mexico adopted a law in 2025 that will allow the state to increase royalties on certain state lands from 20 to 25 percent for new wells, potentially increasing revenues from state leases (Munoz et al. 2025).
Figure 3. State and Local Revenue as Share of Oil and Gas Production Value, FY2023
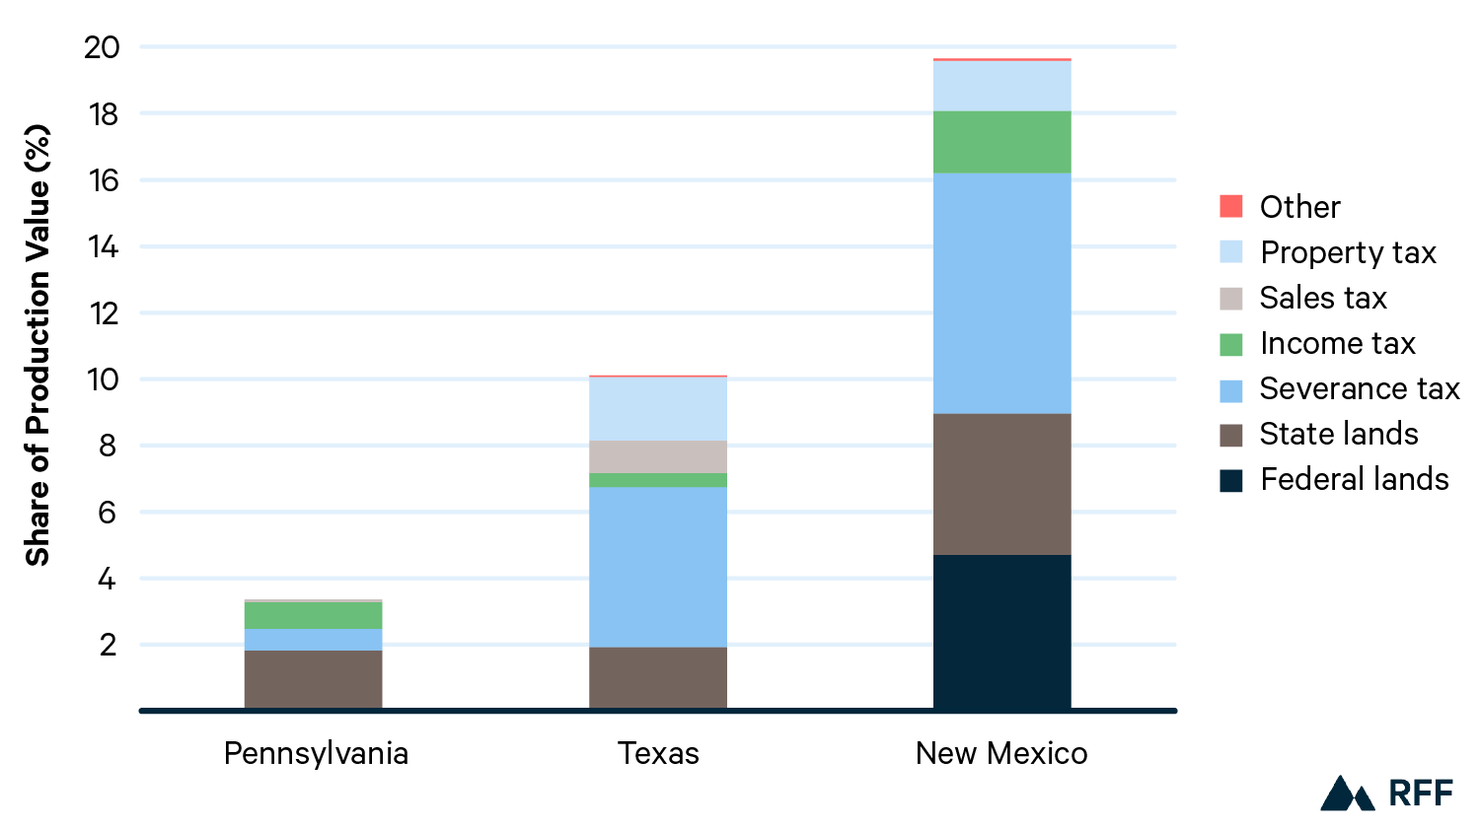
Note: See Appendix A for underlying data and additional figures illustrating results.
3.2. Revenue Use
States also use oil and gas revenues in very different ways. In Pennsylvania, most revenue supports state current expenditures, with a small proportion benefiting producing communities, and no revenue dedicated to education. As of June 2025, the state was also considering new legislation that would restrict funds from flowing to local governments that enacted certain restrictions on the location of newly drilled horizontal wells (Bartolotta 2025).
In Texas, the plurality of funds support ongoing state programs, with smaller portions flowing to statewide education, local school districts, and local governments. Texas also saves revenues in two ways. First, revenue from state land leases supports a permanent education fund for primary and higher education. Second, the state saves a portion of severance tax collections in its rainy day fund (formally, the Economic Stabilization Fund), which held a balance of $21 billion at the close of FY2024 (Texas Comptroller of Public Accounts 2025a). We do not classify this as a permanent fund because it is designed to support short-term fluctuations in public revenues rather than provide a perpetual source of revenue.
New Mexico differs substantially, investing roughly half of its oil and gas revenues in permanent funds that largely benefit statewide education programs. Most of these investments come from royalties flowing from federal and state lands, although the state also invests a portion of its severance tax revenues in a permanent fund. Our results show revenues and policies in place in FY2023. Effective FY2025, New Mexico allocates additional severance tax revenues into a permanent fund (New Mexico Legislative Finance Committee 2023). Roughly 40 percent of the state’s oil and gas revenues supports state current expenditures (including statewide education), and roughly 10 percent flows to the local level for counties, school districts, and other local governments.
How significant are these revenues in terms of overall state and local government revenue? Again we see substantial variation. In Pennsylvania, oil and gas revenues account for 0.6 percent of all state and local revenues (including fees for services and transfers from the federal government) in FY2023. When looking only at own-source tax revenue (i.e., excluding fees for services and transfers from the federal government), oil and gas accounted for 1.7 percent of state and local revenues. In Texas, oil and gas revenues accounted for 5.7 percent of all state and local revenue and 10.2 percent of state and local own-source tax revenue. In New Mexico, oil and gas play a dominant role in public revenues, accounting for 26.9 percent of all state and local revenue in FY2023 and 56.1 percent of state and local own-source tax revenue in that year. State and local revenue data for FY2023 are not yet available from the annual Census of State and Local Governments. We therefore use data for state revenues from each state’s comprehensive annual financial report from FY 2023, and we gather data for local property tax and sales tax revenues from various sources for each state.
Figure 4. Oil and Gas Revenue Use as Share of Oil and Gas Production Value, FY2023
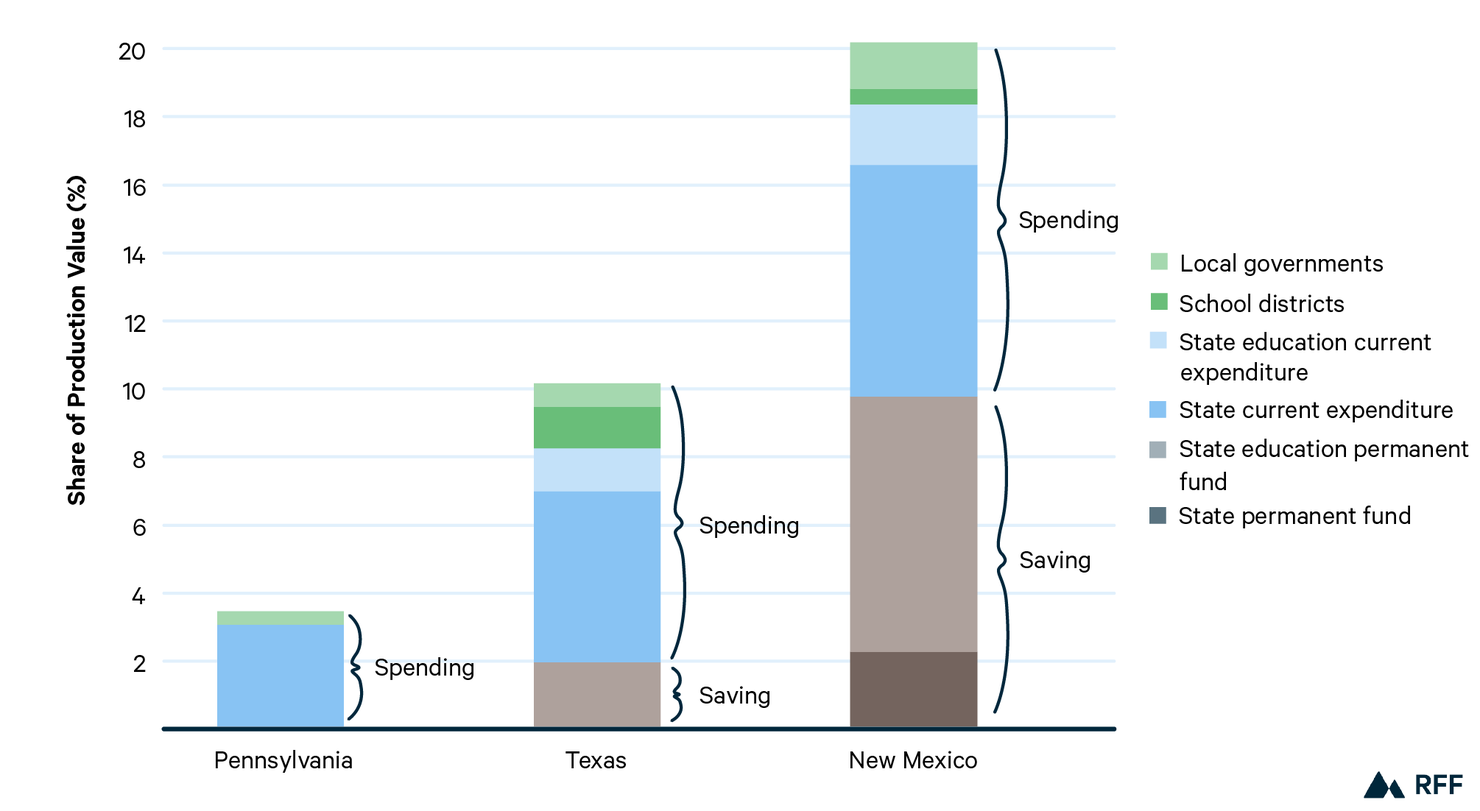
Note: See Appendix A for underlying data. New Mexico’s revenue allocation totals in FY2023 differ by 0.4 percent of production value (roughly $273 million) from its collection totals in that same year primarily because of differences in revenue collections and allocations from federal leases. This discrepancy is likely due to the two- to three-month lag between oil and gas production from federal leases and distribution of the associated revenue by the federal government to states and tribes (Office of Natural Resources Revenue 2024) and lags between the state’s receipt of revenue and the allocation of that revenue to various state funds.
Figure 5. Economic and Fiscal Contributions of Oil and Gas Industry, by State, 2023
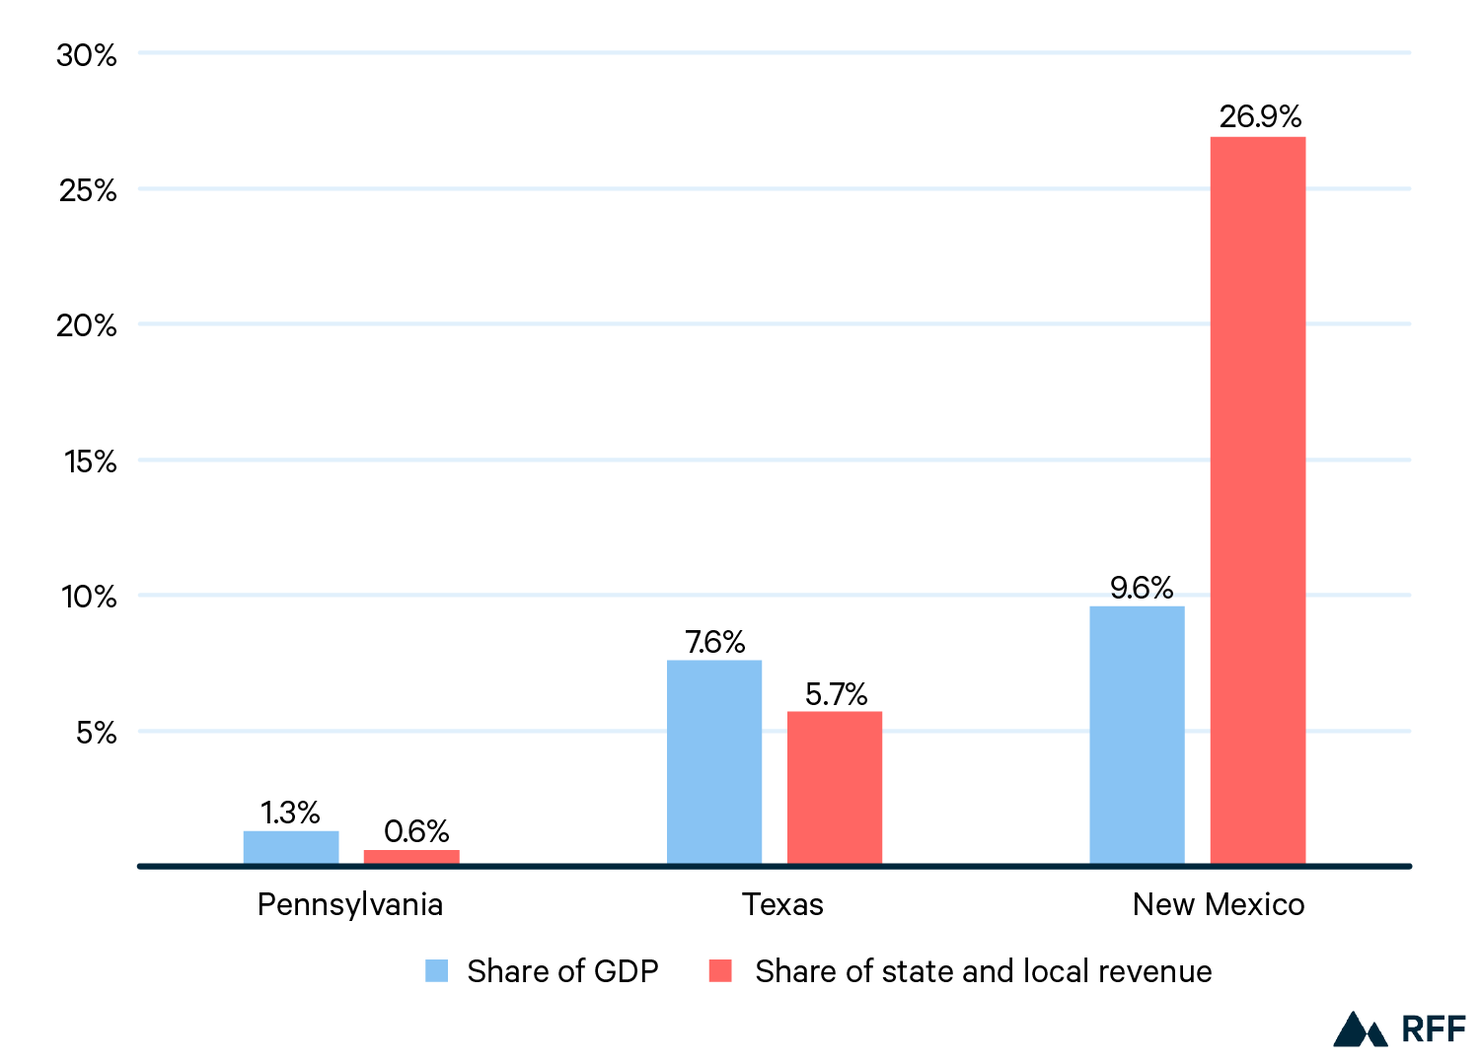
Note: See Section 1.3 for GDP data sources and notes. Share of state and local revenues includes state and local taxes, fees, and federal transfers.
4. Discussion and Policy Implications
4.1. Discussion and Policy Implications
The states examined here range from relatively high levels of revenue collection and long-term savings in New Mexico to low levels of revenue collection and effectively no savings in Pennsylvania, with Texas falling roughly in between the two poles.
In part because a large share of its production occurs on state and federal land, New Mexico collects a larger share of oil and gas revenues than Pennsylvania or Texas. Another difference is that it dedicates a substantial amount of revenue to permanent funds that will support state fiscal stability for decades to come. This approach will provide fiscal benefits for residents regardless of the pace and scale of a national or global energy transition. Policymakers have enhanced the contributions to permanent funds in recent legislative sessions, and investment income from permanent funds was projected to overtake income taxes as the second-largest revenue source for the state general fund by FY2025 (New Mexico Legislative Finance Committee 2023), then growing further in the future. In short, New Mexico is heavily dependent on oil and gas revenues but has taken proactive steps to manage its fiscal risks for the future.
One potential challenge for oil- and gas-producing communities in New Mexico is that local governments cannot create and operate their own permanent funds. Instead, counties, municipalities, and other local governments are subject to the volatility that comes from fluctuating oil and gas prices. This lack of predictability and stability increases the fiscal risk for the communities that produce most of the state’s oil and gas.
In Pennsylvania, state policies result in relatively little revenue collection from oil and gas extraction and no long-term savings. Because the oil and gas industry plays a relatively small role in the state economy, however, this presents little fiscal risk for the state as a whole.
But existing policies do create fiscal risks for the mostly rural jurisdictions where Pennsylvania’s natural gas production is concentrated, such as in Bradford, Greene, Lycoming, Susquehanna, and Washington counties. In FY2024, 16 townships in these five top-producing counties received more than $500,000 in revenue from the state Impact Fee, and more than 70 received more than $200,000 (PA Public Utility Commission 2025). Budget data are rarely available online for rural townships, but population data help contextualize the significance of these funding levels. For example, in 2024, Auburn Township, a division of Susquehanna County and the top recipient of Impact Fee revenues, collected more than $500 per resident. This level of funding provides meaningful support for communities hosting energy development but could also pose fiscal risks if local governments become reliant on these revenues to fund recurring expenses.
Texas, as the nation’s leading oil and gas producer, collects more revenue from extraction than any other US state. It saves some of that revenue in permanent funds to support statewide education and some in a short-term rainy day fund that can address near-term revenue volatility for the state government. However, it does not save any revenue to support local government services, nor does it invest in permanent funds to support state services. This introduces long-term fiscal risk for the state as a whole, along with short- and long-term risk for the communities where extraction is concentrated.
Another fiscal challenge for communities that host oil and gas development in Texas is driven by state property tax requirements. As noted in Section 1.2, Texas state law limits the increase in property tax revenue that counties and other local governments can collect from year to year. When oil and gas property values increase substantially (as they typically do when prices rise), property tax rates decline by default to limit the growth in tax revenue. This policy provides a clear near-term financial benefit for property owners.
However, when oil and gas property values decline (as they generally do when prices fall), raising property tax rates to their previous levels typically requires voter approval, and securing such approval is politically challenging. As a result, this one-way ratchet creates an ongoing risk that local governments will struggle to raise adequate revenue during downturns in the industry. Data from recent years support this structural downward pressure on local property tax rates: from 2020 through 2024, 70 percent of changes in county property tax rates reduced those rates, while just 30 percent of changes raised rates. Authors’ analysis of changes in annual Texas county property tax rates. Data from Texas Comptroller of Public Accounts (2025ab).
5. Conclusion and Future Research
The United States is producing more oil and gas than any country in history. At the same time, a transition away from fossil fuels, including oil and gas, is needed to avoid the worst consequences of climate change. Although the pace and scale of that transition is far from certain, many US oil- and gas-producing communities have already experienced significant declines in output due to aging fields. At the same time, volatile and uncertain commodity markets create challenges for communities that rely on the industry for employment, community identity, and public revenues.
In this analysis, we show how Pennsylvania, New Mexico, and Texas vary in their approaches to collecting and allocating oil and gas revenues to support public services over the short- and long-term. We find that Pennsylvania collects relatively little revenue from the industry but faces low fiscal risk because of its large and diverse statewide economy. New Mexico, on the other hand, is heavily dependent on oil and gas production to fund public services but has taken steps to reduce its fiscal risk, primarily by investing substantial sums in permanent funds that can support state services and education in perpetuity. Recent federal policy changes, however, are projected to reduce New Mexico’s oil and gas revenues from federal lands. Between these two poles is Texas: it relies on oil and gas for a meaningful share of public revenues, and it has taken some modest steps to reduce its fiscal reliance on the industry. We find that none of these states have enacted policies to protect the fiscal health of the often rural local governments where extraction takes place, raising concern about the effects of revenue volatility in these locations.
Looking forward, additional analysis can help refine state, and perhaps federal, policy regarding the management of fossil fuel revenues. For example, how do states invest their permanent funds, and might existing investment strategies be reconsidered? How do states other than Pennsylvania, New Mexico, and Texas manage their oil and gas revenues, and what lessons can those policies offer? How do the fiscal benefits of oil and gas development compare with the fiscal risks from orphaned wells and other industry infrastructure? And what options are available to best support the communities where extraction occurs and that bear its environmental and health risks?
The future of oil and gas in the United States and globally is highly uncertain. But regardless of the future development in energy technologies, policies, and geopolitics, sound fiscal policy can reduce risks for oil- and gas-producing communities, no matter the speed and shape of the energy transition.