The View from the Top: Economic Perspectives on Environmental Pressures in a Shrinking World
On the date that scholars in 1960 predicted exponential population growth would end the world, this report examines why this prediction didn’t come to pass, as well as current population trends, what is driving them, and how they impact the environment.
1. Introduction
From Malthus to Ehrlich, scholars have long worried about the ability of our environment and natural resources to sustain unhindered growth of the human population. von Foerster et al. (1960) famously dubbed November 13, 2026, “Doomsday”—the date when “human population will approach infinity,” at least if past were prologue. Looking back from Doomsday, a markedly different historical trend has instead played out over the past 60-plus years: a persistent and global decline in population growth rates, largely driven by broadly declining fertility. In 2022, for the first time the United Nations’ official population projections featured as their central case what was previously inconceivable: a global population that peaks in the 2080s and then begins to shrink, naturally and absent any prospective population-constraining public policies. The 2024 update to these projections only reinforced this prediction, moving the projected peak slightly sooner and lower.
This paper thus raises the question: In a world with population deceleration and even decline, how do we interpret the past literature that warned of the environmental impacts of population growth? Can we simply reverse the signs of the past literature’s findings, or are there countervailing dynamics and asymmetries that mean environmental and social impacts “on the way up” in the late twentieth century may fundamentally differ from those “on the way down” in the late twenty-first? Through which mechanisms do population and the environment shape each other, and which of these are likely to dominate in a future of slowing and declining population?
In addressing these questions, we are interested in evidence on a broad set of causes and consequences of population change as they relate to environmental outcomes. Our paper will therefore address not only the key role of changes in fertility, but also other dimensions of population change such as migration and urbanization—all of which can improve our understanding of how population relates to environment. Moreover, while discussions surrounding the impacts of population decline often take place in the context of the global population, we are also interested in evidence tied to regional changes in population, given that for many natural resources and environmental amenities it is localized depletion or degradation that directly impacts human welfare.
While the literature on the environmental impacts of population growth is multidisciplinary, we emphasize economic perspectives on the problem. Indeed, the fact that some natural resources have withstood population pressure while others have not owes in large part to economic phenomena. Property rights, technological innovation, the availability of substitutes for natural resources, and human behavior in response to incentives are all economic factors that mediate or reinforce the impact of population growth, and they are all key in explaining why erstwhile predicted widespread calamities did not come to pass (think agricultural yields and predicted global famine, for example). Environmental resources that have struggled, by contrast, often suffer from open access problems as suggested by economic theory (think fisheries, atmospheric carbon concentrations, and species extinction).
To address these questions, we survey the relevant literatures and draw lessons for the implications of global population declines. Section 1 sets the stage, with an overview of the line of thinking beginning with Malthus and running through the twentieth century and a discussion of recent developments in forward-looking population projections. Section 2 identifies key conceptual frameworks by which scholars have linked population growth with environmental and economic outcomes. Section 3 discusses in detail several strands of quantitative literature studying these issues, some using conceptual/theoretical simulation and modeling approaches and some using statistical and econometric approaches. Section 4 discusses other distinct but related dimensions of population and environmental outcomes. Section 5 then draws out the lessons from what this past literature, which largely studies population growth, may have to say about future population decline. Section 6 is the conclusion.
1.1. Historical Perspectives on Population Change
Over the past four centuries, research, projections, and perspectives on global population change have altered dramatically. In 1798, British economist Thomas Malthus published An Essay on the Principle of Population. In this pre-industrialization piece, Malthus argued that the global human population, if unconstrained, could grow exponentially, while food supply could grow only linearly. He concluded that famine and crises were permanent states of humanity. Furthermore, Malthus believed that as countries became wealthier their populations would also increase; he proposed abstinence as his primary solution to this issue and advocated against economic relief for the impoverished so they would not be incentivized to have children (Malthus 1798). Despite numerous catastrophes across the next two centuries, the human population continued to grow, fueled by technological and agricultural innovation unforeseen by Malthus.
Despite his controversial predictions and proposed solutions, Malthus set the stage for much of the research on overpopulation. In 1877, Samuel van Houten coined the term Neo-Malthusianism to describe a new generation of intellectuals concerned about overpopulation. This group supported Malthus’ economic ideals but differed from him in their support for artificial birth control to decrease fertility. They faced critique from Anti-Malthusians, who promoted fertility, and Socialists, who believed the inherent issue was unequitable distribution of resources (Islatince 2023).
The postwar period of the twentieth century ushered in new perspectives on population change, many of which were still influenced by Malthusian notions. In 1948, Fairfield Osborn published Our Plundered Planet and William Vogt released Road to Survival. Both works discussed the environmental effects of an expanding population, highlighting land degredation, soil erosion, and deforestation. These works contributed to the development of a new postwar environmental movement that expanded on conservation efforts of the early 1900s; this framework contrasted with the promotion of consumption-driven growth in the US during the 1920s (Robertson 2012). Twenty years later, Paul and Anne Ehrlich published The Population Bomb, in which the authors similarly emphasized the environmental impacts of population growth and overconsumption, but in a significantly more alarming tone. The authors responded to the postwar population boom by claiming a large portion of the population would die during a global famine in the 1970s (Ehrlich and Ehrlich 1968). Although this prediction did not come to pass, largely because of the interrelated economic factors of market responses, innovation, and globalization (Lam 2011), it fostered conversations within different disciplines about the potential effects of population change in the future. Many of these potential effects are in turn related to environmental outcomes.
1.2. Recent Understandings and Projections
Not only did the projected population bomb not come to pass, but more recent discourse has also emphasized the persistent decline in fertility rates below replacement rates as a new potential cause for concern (Fauser et al. 2024). Indeed, recent updates to the United Nations’ official probabilistic population projections show as their central case (i.e., the median) a plateau and then decline in global population levels starting in the 2080s. This contrasts with the United Nations’ prior projections, which as recently as 2019 indicated continued population growth through 2100. The most recent iteration of the UN projections signals a peak population of 10.3 billion in 2084 followed by a decline, in contrast to its 2017 projections of 11.2 billion and rising in 2100. While the official UN projections end in 2100, Raftery and Ševčíková (2023) extend them probabilistically to 2300 as part of an effort to inform estimates of the social cost of carbon. The social cost of carbon is the monetized damages of an incremental ton of a CO2 emissions (see Rennert, Errickson, et al. 2022, Rennert, Prest, et al. 2022). The central case of these projections shows a continually declining global population in the twenty-second and twenty-third centuries, returning to 7.5 billion in 2300. While that central case is notably smaller than today’s population levels, it comes with large uncertainty bands (90% interval: 3 to 21 billion) reflecting deep uncertainty about the distant future and emphasizing the importance of the best practice of generating probabilistic projections.
This newly projected and potentially permanent population deceleration is estimated to occur globally but the effects are expected to be felt earlier and be more pronounced in more developed regions—indeed, according to the projections, Europe’s population may have already peaked, while Africa is expected to account for nearly all net global population growth in the second half of this century. These trends have clear implications for prior projections of growing demand pressures on natural resources, which may be smaller than once predicted.
This population deceleration and projected decline is due to in large part declining total fertility rates (TFRs) around the world. In 2024, the global average fertility rate was 2.2 births per woman, a sharp decrease from 3.3 in 1990 (United Nations 2025a). Despite the overall downward trend, TFR still varies greatly by country. The fertility rates of high- and upper-middle-income nations, such as Japan (1.2), Germany (1.58), Saudi Arabia (1.87), and Chile (1.25) are well below replacement level, while low-income countries including Niger (6.64), Angola (5.7) and Mali (5.35) still have elevated TFRs (Aitken and Norman, 2026). Research has shown that decreases in fertility are associated with increased output per capita, which, in part, contributes to this cross-country contrast in TFR (Ashraf et al. 2013). By 2100, the TFR is projected to fall to 1.8 births per woman; at this rate the total number of births worldwide will decline to 111 million, 35 million fewer than the peak in 2012 (United Nations 2025a).
Declining fertility rates also imply aging populations around the world, with both economic and environmental implications. Decreasing fertility rates imply fewer young people over time, increasing the overall average age within the population (Marini et al. 2024). Simultaneously, advancements in medicine and healthcare following the mid-twentieth century have increased life expectancy, particularly in high-income countries (Jarzebski et al. 2021; Acemoglu and Johnson 2007). By 2050, the global population of individuals aged 65 and older will increase to 1.6 billion, more than double the 761 million in 2021 (United Nations 2023). Changes in TFR are occurring at varying rates around the world, but population aging is a consistent theme in countries of all economic status (Ahmad et al. 2025).
Although it does not influence global population decline as directly as fertility rates do, migration can have meaningful localized effects and is a key aspect of demographic change in an increasingly globalized world. International migration has become an integral component of economic growth in aging societies where native populations are working less and having fewer children (Morgan Stanley 2025). There are already over 300 million international migrants today, and if growth rates continue as they have historically there will be approximately 390 million by 2050 (IOM UN Migration 2026b). The future economic outlook is dependent on these demographic changes. The UN Intergovernmental Panel on Climate Change (IPCC) developed its Shared Socioeconomic Pathways (SSPs) in 2021 to forecast different scenarios for economic growth and climate change (IPCC 2021). In the base scenario (SSP2), global GDP per capita grows steadily over time, increasing from $13,300 in 2020 to just under $60,000 in 2100 (2005 US$) (Riahi et al. 2017). Despite changes in population size and dynamics, the global economy is still projected to experience per capita growth throughout this century.
As population dynamics and economic output have changed over time, so have the environmental effects. Following a period of cooling that ended in the mid-1900s, the Earth has warmed at a rapid pace. According to the World Meteorological Organization, the global average temperature in 2025 was around 1.43°C above the 1850 average, the global mean sea level was about 90mm higher than in 2000, and the ocean heat content reached its highest level since observations began, in 1960 (WMO 2025). Rising temperatures have also increased the frequency and intensity of natural disasters, such as floods, droughts, and wildfires (IPCC 2021). It is expected that temperatures will continue rising into the future, with the estimates projecting the Earth will cross the 2°C threshold before 2050 (Riahi et al. 2017). Centuries of anthropogenic industrialization have altered the Earth’s climate in dramatic ways, demonstrating the influence humans have over their natural environment.
2. Conceptual Frameworks Linking Population and Environment
2.1. Defining Environmental Outcomes
Humanity’s relationship with its natural environment can be characterized in many ways. In relation to population change, this impact is often characterized in terms of resource extraction and the planet’s ability to support humanity’s needs. Policymakers and academics of different fields use a variety of terminology to describe this relationship. In 1995, mathematician Joel Cohen released two articles assessing the Earth’s “carrying capacity.” Based on a variety of literature, he defines this as “the number of people who can be supported for some period in some mode of life considered plausible or desirable” (Cohen 1995a, 19). Cohen assesses that the Earth’s carrying capacity for humans is based on both natural constraints and human decisions, making it dynamic and uncertain (Cohen 1995b, 341). Although consumption is inherently limited by resource availability, accompanying technological growth, particularly of resource-saving technology, could help offset those limitations. Increasing population size and living standards without advancing technology reduces carrying capacity, but when technology improves simultaneously the relationship becomes unclear.
Another factor that influences carrying capacity is the ability of the Earth to regenerate its own resources. In Wackernagel et al. (2021), the authors define “biocapacity” as “the capacity of ecosystems to renew biomass.” This definition has been expanded upon to describe the “productivity of ecological assets,” such as cropland and forest land (Bradshaw et al. 2026). Many economies, particularly those where the agricultural sector encompasses most of total output, depend on their biocapacity. As populations and consumption patterns continue to rise, more regions are said to fall into “biocapacity deficit,” which occurs when ecological footprint exceeds biocapacity in a region (Global Footprint Network 2026). First referred to as “Impact” in Ehrlich and Holdren (1971), “ecological footprint” can be defined as “the demand humanity makes on Nature’s goods and services in a period” (Dasgupta et al. 2021). Wackernagel et al. (2021) state that in 2017, 72 percent of the global population—a proportion that was growing—lived in lower-income countries that ran a biological deficit, emphasizing the relationship between resource availability and economic stature.
One way in which researchers have quantified humanity’s ecological footprint is in terms of the number of Earths needed to sustain humanity’s current demand on nature’s productive biocapacity. This involves calculating 1) the ecological footprint of humanity (meaning the effective amount of productive land, in hectares, needed to meet humanity’s annual consumption of natural resources) and 2) Earth’s biocapacity (meaning the amount of productive land, also in hectares, actually available to regenerate such resources each year). The difference in these two values is termed the ecological deficit (in hectares), and their ratio is the number of Earths’ worth of biocapacity that humanity is demanding. Lin et al. (2018) put this ratio at 1.7 Earths (where it remains as of 2025), which had risen steadily from a value of 0.7 Earths in 1961. These values can be disaggregated into their components, which are, in descending order of importance to the global total as of 2023, the amount of land needed for carbon uptake (1.03 Earths), cropland (0.30 Earths), forest products (0.17), grazing land (0.09), built-up land (0.07), and fishing grounds (0.06). Yet 73 percent of the rise in this footprint from 0.7 Earths in 1961 to 1.7 Earths today is driven solely by the carbon uptake component, which rose from 0.29 Earths in 1961 to 1.03 Earths in 2023. Another 17 percent is driven by increased footprint of croplands, which rose from 0.13 to 0.30 Earths in that time period. This component is calculated as the amount of land that would be needed to absorb all anthropogenic carbon dioxide (CO2) emissions. Humanity’s ecological footprint would be 0.98 Earths if the carbon component had remained at its 1961 levels, and 0.68 Earths if anthropogenic carbon emissions were brought to zero. Thus, the sustainability problem identified here seems to be primarily one of carbon emissions, a point previously emphasized by Blomqvist et al. (2013).
Defining humanity’s footprint in this way—predominantly as the land needed to absorb all anthropogenic CO2 emissions—raises three additional issues. First, the planet is not in fact absorbing all anthropogenic CO2, meaning we are not in fact utilizing 1.03 Earths as carbon sinks (nor would that be possible). Rather, this number should be interpreted as a deficit that future society is assumed to eventually repay in the form of carbon drawdowns, which are implicitly assumed to be in the form of natural carbon sinks. Yet such a repayment is not guaranteed to happen in practice. Second, while some studies such as Wackernagel et al. (2021) focus on country-level ecological deficits, it is unclear whether such metrics at country-specific scales are meaningful given that CO2 emissions represent a global externality whose burden do not primarily fall on the emitting countries (see van den Bergh and Verbruggen [1999] for related critiques of the value of regional claims of sustainability based on the ecological footprint metric). Relatedly, Fiala (2008) shows that countries with higher ecological footprints tend to have higher human development indices, higher crop yields, and modestly lower moderate-to-severe land degradation, illustrating that the country-level footprint estimates do not seem to correspond with local social or environmental stress. Third, the land-based measure of ecological footprint carries no connection to the impacts of CO2 emissions on social welfare, which is key to understanding environmental consequences in human terms. Indeed, this measure would be unchanged whether climate change is considered a modest problem for humanity or a catastrophic one.
Given the limitations of the footprint concept, particularly in relation to human welfare and behavior, we move on to survey other conceptual frameworks linking population and environmental outcomes, with an emphasis on those that include economic perspectives.
2.2. Framework Components and Linkages
2.2.1. Frameworks That Include Both Population and the Environment
Many studies have tried to formalize the relationship between population and environmental outcomes by developing conceptual frameworks that identify relevant components of the economy and the environment, and the mechanisms through which they influence each other. In terms of mechanisms, at the highest level, we find that these frameworks can be classified into two categories.
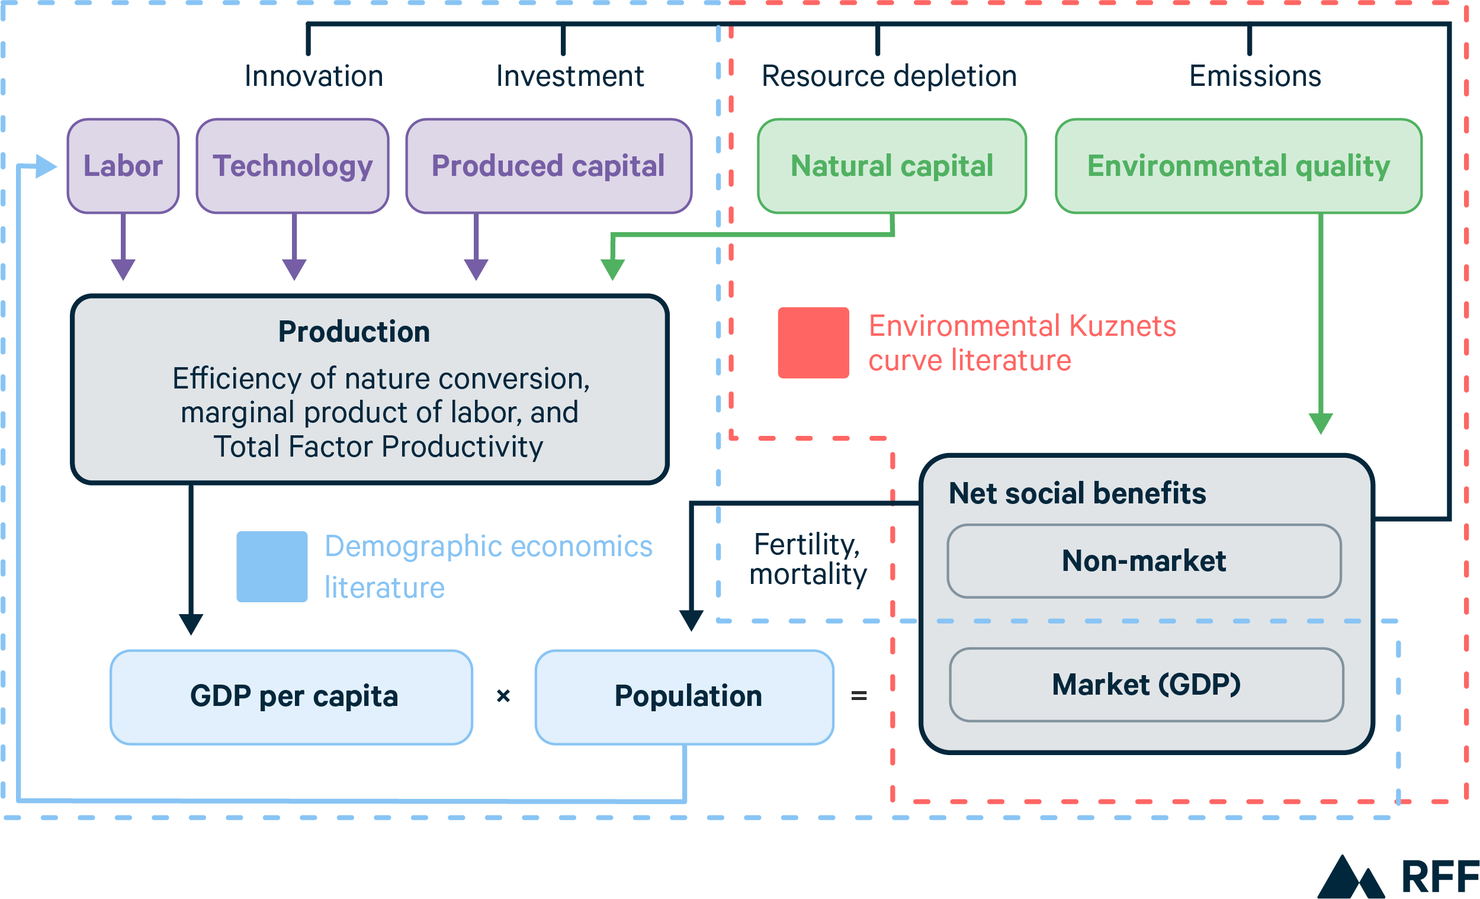
The first category includes relationships between population and environment that relate to the use and depletion of natural resources that are used to produce goods and services consumed by people. As Malthus famously wrote in An Essay on the Principle of Population, “the power of population is indefinitely greater than the power in the earth to produce subsistence for man.” People and the societal benefits they experience deplete natural resources, which affects society’s natural capital, which in turn affects production. Figure 1 illustrates this mechanism. The level of net social benefits (shown in the lower right corner of the figure) influences the size of natural capital stock (shown towards the top of the figure) through resource depletion, and the natural capital stock is one of four types of inputs in the production function (shown in the left side of the figure). If natural capital is sufficiently depleted, economic output may decrease, which in turn may negatively affect GDP per capita. The amount of natural capital available for production will also influence the marginal product of other inputs to production.
The second category of frameworks consists of mechanisms that operate through impacts on environmental quality. This category recognizes that environment is not just a factor that limits production as population expands but is also a good that exhibits quality dimensions that influence important social outcomes such as human health, recreation, aesthetic benefits, and spiritual needs. In addition, the generation of social benefits often creates pollution and degrades environmental quality, which feeds back into the benefits that society experiences, often in the form of non-market benefits. This mechanism is shown in the right side of Figure 1.
Figure 1 illustrates some other components and mechanisms that the literature discusses as relevant for understanding the relationship between population and the environment. For example, population size and density determines the labor force available for production. The amount of labor used in production, in turn, influences the marginal product of other inputs such as produced and natural capital. Technology can influence the marginal product of production inputs, and one key question in the literature is whether technological innovation can increase the marginal product of natural capital to the point where natural resources are no longer degraded in the pursuit of further economic growth. Finally, population size and density themselves can be endogenous; key population drivers such as fertility and mortality may be dependent on income, which in Figure 1 is represented within net social benefits (bottom right).
Figure 1. Relationships Between Economic and Environmental Phenomena Characterized in the Literature
Some early frameworks in the literature do not necessarily distinguish between these two mechanisms in that they characterize a generic “environmental impact” that could refer to impacts on natural resources used for production or on environmental quality that is not necessarily used for production but nonetheless influences human well-being. One example of such a framework, which serves as a useful analytical starting point, is the IPAT identity proposed in various forms, initially by Ehrlich and Holdren (1971) and Commoner (1972), in which an environmental impact (I) is a function of population (P), affluence (A), and technology (T):

The IPAT identity is widely used as an accounting tool to define the factors that influence environmental impacts and their relative importance. However, as an identity, the IPAT framework does not require that the variables that determine environmental impacts—P, A, and T—be exogenous or independent of each other. As such, the IPAT identity should not be interpreted as describing causal relationships between its variables.
Indeed, studies have demonstrated empirically that every variable in the IPAT identity is associated in some way with another variable in the identity. First, technological improvements associated with resource use efficiency (T) can induce price reductions and additional consumption (A) that offset reductions in environmental impact—often referred to as a rebound effect or Jevons paradox—and may even lead to a net increase in those impacts (e.g., Jevons 1865; Alcott 2010; Shao et al. 2014). Second, it is well documented that population density can induce technological change in areas such as agricultural production—including land intensification—either directly through the economic pressures generated by population density (Boserup 1975; Pingali and Binswanger 1984; Muyanga and Jayne 2014) or indirectly through relative factor prices such that population density affects labor abundance and wages, which then influence technology choice (Hornbeck and Naidu 2014; Ebenstein et al. 2011). Third, high population—not just population density—is associated with technological change due to the non-rivalry of technology and the ability to scale R&D (Kremer 1993; Klasen and Nestmann 2005; Backus et al. 1992).
In addition, other studies have found that P, A, and T are not exogenous in that environmental degradation (I) feeds back into population (P), primarily through migration, suggesting a reverse causality from what is contained in the identity. Studies have identified relationships between the abundance of natural resources such as forests (Chopra and Gulati 1998), land degradation indicators such as soil salinity and erosion (Chen and Mueller 2018; Freihardt 2025), and climate-induced disasters such as flooding (Freihardt 2025) and drought (Neumann et al. 2015) and migration.
The IPAT identity is useful not only as an accounting identity but also in that it has served as the basis for other models that can better explain and predict the relationship between population and the environment. Ehrlich and Holdren (1971) themselves note that environmental impacts can increase faster than linearly with population and may include threshold effects. In another variation, Dasgupta et al. (2021) simply replace the technology variable (T) with a variable representing the efficiency with which nature’s goods and services are converted by humanity into gross domestic product (GDP), α, as follows:

This may be a more intuitive way to represent the role of technology in the identity, since now increases in efficiency represented by α are associated with decreases in impact; in the IPAT identity the relationship is reversed. Waggoner and Ausubel (2002) decompose the technology term in the IPAT identity into two factors, one driven by consumption behavior and one by production technology. The role of consumers is quantified as the units of natural resources used to consume a unit of GDP, and production is the ratio of environmental impact to goods demanded by people and produced as a result.
Derivations of the IPAT identity also exist for specific environmental impacts. Perhaps the best known of these is the Kaya identity (Kaya and Yokobiri 1997 ), which breaks down the drivers of energy-related CO2 emissions into four components:

where energy intensity is defined as the amount of primary energy required per unit of GDP and carbon intensity is the emissions per unit of primary energy.
Like the IPAT identity, the Kaya identity can be a useful organizing and accounting device. It is often used to characterize the roles of population, income, energy intensity, and carbon intensity in emissions trajectories tied to different scenarios in integrated assessment modeling. For example, IPCC Assessment Reports use the Kaya identity to present decomposition analyses of the main drivers of greenhouse gas emission trends (Blanco et al. 2013). Burgess et al. (2020) used the Kaya identity to understand why International Energy Agency (IEA) projections of global CO2 emissions diverge from IPCC baseline scenario projections and find that the two projections apply similar population growth rates. The authors thus conclude that the divergence in emissions projections can instead be attributed to differences in carbon intensity growth and per-capita GDP growth assumptions.
2.2.2. Combining Multiple Frameworks to Link Population and the Environment
While the studies summarized above address both population and the environment within a single framework, insights regarding the relationship between population and the environment can also be drawn from by combining findings from (a) the literature that quantifies linkages between population and production or income (GDP) and (b) the literature that quantifies linkages between production or income and the environment. The former is part of the demographic economics literature, and the components and linkages it addresses are encompassed by the blue dashed line in Figure 1. The latter is often referred to as the environmental Kuznets curve literature, and the components and linkages it addresses are encompassed by the red dashed line in Figure 1.
An example of a study from the demographic economics literature that contributes to broader understanding of the relationship between population and the environment is Acemoglu and Johnson (2007), which combines country-level data from the twentieth century to quantify the population and economic effects of increased life expectancy. In Figure 1, these effects are represented by the arrow connecting net social benefits to population, as well as the arrow connecting population to the labor force. Average life expectancy changed drastically in the 1940s following international health interventions and the release of new chemicals and drugs. Life expectancies are represented using a predicted mortality variable, which is based on the interaction of baseline cross-country disease data with global intervention dates for specific diseases. A Solow growth model in which land is fixed, capital can be fixed or variable, and total factor productivity (TFP) and human capital are accounted for is applied to demonstrate the relationship between life expectancy and economic growth. Over 40- to 60-year periods, they find that life expectancy led to significant increases in population size, a small impact on total GDP, and hence a negative impact on GDP per person. Bloom et al. (2014), however, argue that these findings (particularly the negative relationship between life expectancy and income per capita) are too reliant on the exclusion of lagged health improvements as a dependent variable. When replicating the original regressions with both contemporaneous and lagged health improvements, they find a positive relationship with per capita income.
Another example that is more empirically oriented is Basso et al. (2026). The authors analyze cross-country data to observe the impact of immigration on economic indicators in OECD countries from 1990 to 2024. During that period, OECD countries experienced decreasing native population growth and increasing immigration, particularly high-skilled immigration from non-OECD countries. The authors first investigate the determining factors of immigration, finding there was little effect of policy and of push factors, and most shocks and surges in immigration remain unexplained. They estimate local-projection regressions to measure the impact on economic indicators such as income per capita, labor productivity, TFP, and capital per worker. Results show that immigration contributed positively toward economic indicators, with high-skilled immigration driving the positive coefficients while low-skilled immigration remained neutral.
Examples of foundational studies in the environmental Kuznets curve literature include Grossman and Krueger (1995); the authors examined the reduced-form relationship between per capita income and measures of air and water pollution across two dozen countries and find the classic Kuznets-style inverted U-shaped relationship, where the turning point for most pollutants occurs before a country reaches a per capita income of $8,000. Arrow et al. (1995) provide caveats to the interpretation of the inverted U-shaped curve, noting that the curve does not imply that economic growth is sufficient to induce environmental improvement nor that Earth’s resource base can support indefinite economic growth. They also caution that, while the U-shaped relationship has been estimated for pollutants with short-term impacts, it has not been demonstrated for accumulative pollutants, resource stocks, or pollutants with system-wide impacts. The authors advocate for using measures of ecosystem resilience rather than ambient pollution, which would better capture the capacity of ecological systems to sustain welfare.
Since these early studies, the environmental Kuznets curve literature has exploded into thousands of papers. Key contributions include those that answered the call by Arrow et al. (1995) and broadened the definition of the dependent variable to measures such as ecological footprint, for which the same inverted U-shaped relationship has been identified (Destek and Sarkodie 2019), and the load capacity factor—the ratio of ecological footprint to biocapacity—which exhibits a U-shaped (not inverted) relationship with income (Dogan and Pata 2022). It is worth noting that many of these studies employ econometric specifications that include population size or density as control variables; thus, while population is not the key independent variable in these studies, it is sometimes incorporated into these analyses.
Thus, as Figure 1 illustrates, it may be possible to combine findings from the demographic economics and environmental Kuznets curve literatures to glean insights on relationships between population and environment. For example, one might argue, based on evidence from these combined literatures, that an exogenous reduction in fertility in a country will lead to increases in per capita income (as identified by some studies in the demographic economics literature), and the impact of that increase in per capita income on pollutant emissions will depend on whether that country sits on the upward sloping or downward sloping portion of the environmental Kuznets curve.
2.3. Differential Impacts of Population Growth and Decline
Given these frameworks have historically been applied to an era of population growth, it is worth thinking about how (and if) they should be applied in the context of a coming population decline. Many studies assume static, linear functions of population, which taken at face value imply that the effects of population growth and decline are symmetric. If true, population decline would simply have the opposite effect of growth, and we need only reverse the signs of the findings of past research. But reality is dynamic and nonlinear, and the accumulation of the effects of population growth over time carry implications for “stock” (as opposed to “flow”) outcomes like the capital stock and the exhaustion of natural resources. A population that grows from 8 billion to 10 billion before declining to 9 billion will have very different stocks of technology (more), capital (more), and remaining natural resources (less), among other things, than one that grows smoothly from 8 billion to 9 billion.
Regarding dynamics, because some changes to stocks are durable (e.g., long-lived infrastructure, land development) or have delayed or irreversible effects (e.g., carbon dioxide emissions today contributing to climate impacts in the future), adjustments to these stocks as population starts to decline may not occur as quickly in the opposite direction as they did in response to population growth in the past (Clement and York 2017). In extreme cases, for example, in the case of species extinction, impacts on stocks may be irreversible, making it impossible to recover the environmental benefits generated by these stocks. On the other hand, technological innovation may eventually be able to reverse what was previously an irreversible depletion of a stock, or may be able to provide equivalent benefits through a new type of stock.
Further, the marginal effects of population growth may differ across contexts, including the background rate of population growth. For instance, in an empirical study of Europe over the 1990–2006 period, Weber and Sciubba (2018) found that higher population growth was associated with greater urban land expansion and more CO2 emissions in western Europe, where population was growing, but they found no analogous marginal relationship in eastern Europe, where population was stagnating. While this could be interpreted as a nonlinear effect of population growth, other factors varied across eastern and western Europe, such as stages of economic development and the relative emphasis on goods versus services. This result further highlights the path dependence of the impact of population growth and decline.
Acemoglu et al. (2026) is particularly notable in this context because the authors empirically study population decline from multiple perspectives, including assessing the impacts of widespread military and civilian deaths in World War II. In each application, they consistently find positive economic effects of population declines as the scarcity of younger workers drives endogenous labor-saving responses, which in turn spur innovation, increase TFP growth, and boost high-tech industry.
Asymmetry in the overall relationship between population and the environment may also be induced by asymmetry in some of the individual mechanisms illustrated in Figure 1. This is clearly an implication of the nonlinearity and, in some cases, the nonmonotonicity of the environmental Kuznets curves. At a broad scale, the asymmetric relationship between economic growth/decline and carbon emissions has been well documented; emissions tend to increase at a faster rate during periods of GDP growth, but do not decrease at the same rate during periods of decline (Burke et al. 2015; York 2012). Contrastingly, Huang and Jorgenson (2018) find that for countries with populations exceeding 10 million, the magnitude of effects of economic contraction on both production and consumption emissions outcomes are larger than those of economic expansion. More subtle channels could drive asymmetry in Figure 1, such as the well-documented asymmetry in pass-through of natural resource costs to market prices of consumer goods such as gasoline (Radchenko 2005). If price signals to consumers about the scarcity of natural resources are not symmetric, changes in consumption may not be consistent with fluctuations in natural resource stocks.
All of this is to say that predicting the environmental and economic impacts of a coming population deceleration and decline is not simply a matter of reversing the signs of the findings from previous literature—we must take dynamics and nonlinearities of human systems seriously. Directional asymmetry also has implications for empirical estimation and prediction of the effects of population on environment, in that linear regression models will not capture this asymmetry. Further, even if nonlinear models are used, if they are only estimated from data observed during population growth stages, extrapolation to lower populations is unlikely to accurately characterize the effects of population decline.
3. Quantitative Frameworks Linking Population and the Environment
3.1. Models of Economic Growth and Related Approaches
There is a long strand of methods from growth economics that considers questions around whether a larger or smaller population helps or hurts living standards (measured as income or GDP on a per capita basis) and environmental outcomes, in particular in economies dependent on exhaustible natural resources. These Solow-style growth models (dating back to Solow 1956) often specify macroeconomic production functions that represent economic output (Y) as a function of total factor productivity or “technology” (denoted A), capital (K), labor (L), and optionally natural resources (R) of the form

These models are, in effect, accounting frameworks that are like the IPAT identity in that they break down the components of income into its proximate determinants. In this framing, population can affect living standards in three main ways. First, and most crudely, a larger population can hurt living standards by spreading fixed resources (R) over more people—similar but not identical to Malthus’s driving concern. Second, technological growth (A) can offset that resource dilution, whether exogenously over time and/or as a function of population growth (which is closely related to labor L), since technological developments are themselves produced by people. Third, the substitutability of other factors of production (K, L) for fixed natural resources (R) determines the extent to which sustaining high incomes necessitates depleting those natural resources. More generally, the degree of resource substitutability can also be shaped by technology.
3.1.1. How Substitutable Are Natural Resources?
The classic growth models in this literature ask whether living standards can be sustained when economies depend on exhaustible natural resources (Solow 1974; Stiglitz 1974; Dasgupta and Heal 1974). This literature finds that given dependence on exhaustible natural resources, sustaining income growth requires doing more with less over time, with the depletion of natural resources acting as a drag on economic growth that needs to be made up by other factors of production. How much this matters depends on how important the exhaustible resource is in production and the degree to which other, non-exhaustible factors of production (technology, labor, renewable forms of capital, and so on) can substitute for the exhaustible kind. Many such models specify the classic Cobb-Douglas production functional form, such as F(K, L, R)=Kα Lβ Rγ. However, such a form implies an elasticity of substitution equal to 1, which to some degree predestines their results.
Weil and Wilde (2009), by contrast, put the question of the value of this elasticity at the center of their analysis. In their model, they consider the substitutability of a fixed factor of production (natural resources, effectively) for all other kinds (labor and physical capital, which accumulate together) and estimate the elasticity of substitution at around 2, with a range that is in any case substantially above the Cobb-Douglas elasticity of 1. Coupling this value with the finding that the factor share of fixed resources is relatively low, at 30 percent even among poor resource-dependent countries and even lower globally, this study finds a smaller role for Malthusian concerns than in less substitutable models.
Peretto and Valente (2015) further assess the interactions between income, resource scarcity, and population dynamics. Using a Schumpeterian model with fixed land resources, they find that the steady state population level remains constant and is determined by resource scarcity, while income grows exponentially over time through technological growth. The authors highlight that a central feature of their model is the “resource price effect,” where the response of fertility to increasing resource scarcity depends on the relationship between resource prices and wage rates. The substitutability of labor and resources determines the direction of the model’s results. If labor and resources are substitutes, income and fertility dynamics remain stable.
In contrast, if labor and resources are complements, income and fertility dynamics are unstable; population size diverges regardless of resource availability, leading to economic collapse. Thus, the degree of resource substitutability has major implications for the sustainability of both living standards.
3.1.2. How Fast Does Technology Grow?
In this literature, technological growth can be seen as a saving grace, although there remains disagreement among authors about how much it can be relied upon to support continued economic growth. Nevertheless, technological growth has been a meaningful contributor to overall economic growth: Bosworth and Collins (2003) find that productivity growth and education have accounted for about half of the 2.3 percent annual average growth rate in global output per worker from 1960 to 2000, with the remainder owing to capital accumulation. Even that estimate may understate the role of technological growth, as capital accumulation is itself driven by technology. Decompositions that seek to attribute part of capital accumulation to technology and related proximate drivers like technological development and ideas more generally—which themselves are driven by population growth, education, and research—find an even larger role for those factors (Caselli 2005; Jones 2002).
Technology also plays a key role in an assessment by Arrow et al. (2004) of the question “Are We Consuming Too Much?” In that study, the authors consider the concept of “genuine investment” which refers to the annual change in society’s “genuine wealth”—a measure that includes not only conventional measures of physical capital but also educational and natural capital. One key reason why genuine investment may be insufficient include underpricing of natural resources, for example due to poorly defined property rights; open access to depletable resources; or externalities like CO2 emissions. The authors assemble estimates of investments in physical capital, human capital, and natural capital, including degradation of the atmosphere from carbon dioxide emissions, finding that in many (albeit not all) countries considered genuine wealth did seem to be increasing over time—but for the most part that conclusion would have been reversed if not for TFP growth, that is, technology. (Dasgupta [2010] later revised Arrow et al.’s estimates, finding more pessimistic results for Asia).
Calculations that omit technology therefore often yield bleak predictions. For instance, in a back-of-the-envelope calculation, Dasgupta et al. (2021) use a simplified static version of the standard Cobb-Douglas production function omitting technology, Y=K0.5 L0.5 (where K represents natural and physical capital combined), to estimate what population levels could be sustainable at a given global average income level—and conversely what income level could be sustainable for a given population level. They define “sustainable” as reducing humanity’s capital resource by a factor of 1.5 (corresponding with the notion of humanity currently using 1.5 Earths, per the global footprint concept discussed above). Both calculations yield dismal results, suggesting that to achieve a future $20,000/year global average income—representing a 25 percent increase on a $16,000/year baseline—the global population must shrink to only 3.3 billion people (compared to 2021’s assumed 7.8 billion), or alternatively that maintaining the current population trajectory of 9 billion would instead require a lower global average income, under $12,000/year.
Yet these gloomy results are the inevitable consequence of the chosen Cobb-Douglas specification model, which in addition to assuming a low elasticity of substitution, also omits technology. With output given by Y=K0.5 L0.5, income per worker is Y⁄L=K0.5 L-0.5, which is increasing with capital (K) but decreasing with population (which is proportional to L). If one abstracts in this way from dynamic adjustments of capital investment in response to changes in population, decreasing capital employed or increasing population over time must inevitably decrease living standards. To wit: in their model, decreasing capital by a factor of 1.5 reduces incomes by a factor of (1/1.5)0.5=0.82. Achieving the desired 25 percent income growth therefore necessitates an offsetting population reduction from 7.8 billion to 3.3 billion, which on its own increases output per capita by a factor of (3.3/7.8)-0.5=1.54, yielding the desired combined 25 percent increase: (1/1.5)0.5 (3.3/7.8)-0.5=1.25. But as Lam (2025) points out, if productivity were to improve at the historical average that Dasgupta et al. (2021) estimate (3.5 percent per year), the dismal results noted above would evaporate. Further, while Dasgupta et al. (2021) treat the model as static, in dynamic growth models, physical capital adjusts to the size of the labor force, so a larger population need not permanently dilute total capital per worker. Only truly fixed factors such as land and mineral resources are diluted by population size in the long run.
3.1.3. What Drives Technological Growth?
Technology does not happen on its own—it is developed by people. A longstanding line of research has made this point (e.g., see Boserup 1981; Simon 1986; Lee 1988; Kremer 1993). The basic idea as stated in the modern literature is that a larger population can itself drive the development of ideas, which are themselves non-rival and produce positive spillovers that permeate firms and borders (Jones 2002).
Jones (2022) models what this means for a declining population. He finds a nonlinear “kinked” relationship between knowledge growth and steady-state population growth with two regimes: when population growth is positive, knowledge growth is an increasing linear function of population growth. More people, more ideas, more growth. But when population begins to shrink, knowledge growth goes to zero as new ideas stop flowing. In contrast to the Malthusian concern, this model suggests that living standards may in fact stagnate in a world with a shrinking population.
Several papers port this idea to contexts of exhaustible natural resources. Bretschger (2013) shows that accounting for population-induced innovation can yield sustainable economic growth even under the “seemingly unfavorable conditions” of population growth amid resource constraints. Indeed, the study finds that “in a knowledge-driven economy, positive population growth turns out not to be detrimental but, on the contrary, to be necessary in order to sustain economic growth, even when natural resources become increasingly scarce.” Sasaki (2019) advances the Bretschger (2013) analysis by explicitly considering the potential for sustainable growth when population is actually declining. Sasaki (2019) uses a Cobb-Douglas production function but additionally allows for endogenous technological growth via knowledge spillovers from the capital stock. The author finds that whether positive per-capita income growth can be sustained depends on the overall returns to scale of the production function: continued income growth is possible with either negative or positive population growth, depending on whether returns to scale in the production function are increasing or decreasing. Mino and Sasaki (2021) extend that model to include endogenous technological change via purposeful R&D activities by firms, finding that population decline is a greater threat to sustainable per-capita income growth than are exhaustible resources.
3.1.4. Environmental Implications of Growth Models
What are the implications of models of economic growth for the population-environment nexus? Bongaarts and O’Neill (2018) argue that population policy is a neglected lever for addressing climate change, reflecting the P component of the IPAT and Kaya identities. Casey and Galor (2017) empirically estimate the elasticity of carbon emissions with respect to both population and GDP per capita. They find that carbon emissions are seven times more elastic to population than to GDP per capita, implying that a lower population could significantly reduce emissions while still increasing GDP per capita.
Those estimates, however, implicitly hold technology fixed. Budolfson et al. (2025) consider population’s impact on climate change in a model embracing the concept of population-driven, non-rival innovation spillovers discussed in the previous section. This model is combined with the fact that climate change is driven by cumulative (not annual) emissions over long time periods. Accordingly, the slow-moving nature of gradual population decline that plays out over decades to generations, coupled with inertia in the climate system, together imply that even strongly diverging population pathways yield only small impacts on future global temperature rise. Further, a shrinking population slows productivity growth and technological innovation, an effect that in turn is necessary to address greenhouse gas emissions. Finally, if negative-emissions technologies become feasible in the future, they will likely be easier to deploy at the needed scale given a larger population stock, not a smaller one.
Acemoglu et al. (2023) explicitly consider policy questions around directed technological change towards clean energy. Among their findings is that given challenges to international coordination in enacting climate policies, there is a key game-theoretic distinction between national emissions-reducing policies, which are “strategic substitutes” across countries (if I do more, you might do less), and innovation-directed industrial policies, which are “strategic complements” (if I do more, so do you). To the extent that non-rival innovation is a public good, clean energy technology, once developed, can quickly spread across borders and around the world. Therefore, technology might be thought of as a world variable rather than a national one. This highlights a potential shift in the interpretation of national-level analogues of production functions and the Kaya identity: while the resource-use terms in those equations may correspond to national levels (population, capital, incomes, and so on), terms related to non-rival technological innovation may more realistically reflect the world frontier as it advances (most notably the carbon intensity term in the Kaya identity and the productivity terms in production functions and the IPAT identity). This conclusion suggests a channel by which industrial policy that induces “green” technological change may do more for global emissions than national-level emissions reductions. Connecting this to the idea-based model of technological innovation suggests a potential positive role for population in the development of clean energy technologies for global adoption.
Other studies explicitly consider the relative roles of climate change and population growth for living standards and environmental outcomes. Henderson et al. (2025) develop a spatially disaggregated version of the standard Cobb-Douglas growth model that accounts for both climate change and population pressures on spatially fixed natural resources (location “quality” and land area). Their model allows for an internally consistent representation of both climate change and population growth on living standards, and while they find relatively large adverse impacts of climate change on GDP per capita, they find even larger adverse impacts from population. A similar result is echoed in a simulation model of food insecurity by Molotoks et al. (2020), where population growth is a larger factor driving food insecurity than climate change, although that model ignores the potential for international trade to respond to regional food scarcity and thus may overstate its impacts.
3.2. Statistical/Econometric Approaches
Several studies in this literature adopt reduced-form approaches to modeling relationships between population and economic and environmental outcomes. These methodological approaches are different from the conceptual economic approaches discussed in the previous subsection in that they express the statistical relationship between outcome variables—usually a measure of environmental conditions—and independent variables, including population and population density, without directly reflecting their underlying theoretical relationships. In some cases, economic outcomes can appear on either the dependent or independent variable side of the equations. Within this category of approaches are models that use linear regression, more general models that allow for nonparametric functions of the predictors, and discrete-choice models like logistic and negative binomial regression.
3.2.1. Explaining Environment Impacts on the Aggregate
Some of these reduced-form approaches can be thought of as statistical extensions of the IPAT identity, where the effects of population (P), affluence (A), and technology (T) on an aggregate measure of environmental impact (I) are allowed to vary:

where a is a scalar and ϵi is an error term (Dietz and Rosa 1997). A regression analysis can then be performed in which readily available indicators for well-defined social units, such as countries, can be collected for I, P, A, and T. This regression approach is often referred to in the literature as STIRPAT (STochastic Impacts by Regression on Population, Affluence, and Technology), and early applications found population elasticities for CO2 near or above 1 (Dietz and Rosa 1997; Shi 2003). An implication of deriving a regression equation directly from the IPAT identity is that changes to the definition of technology will change the interpretation of all coefficients, and the coefficients on population and affluence differ from 1 only insofar as population or affluence influences—or is otherwise correlated with—the unmeasured components of technology.
In a more recent example, Bradshaw et al. (2026) take a reduced-form approach to estimating the Earth’s carrying capacity: they regress the global population growth rate, r, on its level, N. They find a positive “facilitation” relationship prior to 1949 followed by a transition to a negative one after 1961. The authors extrapolate out the latter relationship to the point where population growth ceases (r=0%), yielding a projected maximum population of about 12 billion in the 2070s. The authors use this estimated relationship to determine that the maximum population that Earth can maintain is 2.5 billion, effectively meaning the global population in 1949. However, as noted in a critique by Haubrock (2026), it is not clear how the global population level at that particular point in time—with no reference to measures of humanity’s past, current, or future rate of consumption of natural resources or waste generation—can speak to the question of sustainable population levels. More broadly, the literature that has taken statistical approaches to examining relationships between aggregate variables that measure population growth and economic outcomes has struggled to deal adequately with the issue of identification, including endogeneity of fertility and omitted variables (Ashraf et al. 2013).
3.2.2. Explaining Localized and Resource-Specific Impacts
Statistical approaches may thus be more suitable for examining relationships between population and specific environmental outcomes in specific places, rather than aggregated measures of impact. Various studies that focus on the drivers of deforestation use regression analysis and identify population as the most significant factor. Allen and Barnes (1985) perform a cross-country analysis to estimate the change in forest areas as a function of population growth, change in arable land, gross national product (GNP) growth, and change in wood production during the 1968 to 1978 period. They find that in the short term, deforestation is driven by population growth and agricultural expansion, but not by GNP growth. A similar regression-based study focused on tropical forests found that two measures of population growth—one including both rural and urban populations and one consisting of rural only—predicted deforestation (Rudel 1989).
In a similar analysis with more recent data, Cropper and Griffiths (1994) use pooled cross-section and time series data at the country level for the period 1961 to 1988 and estimate a linear regression model in which the independent variable is a country’s rate of deforestation and the dependent variables are the country’s percentage change in population, rural population density, per capita GDP, and percentage change in per capita GDP, and global timber prices, while country fixed effects are included as controls. They find that the rate of deforestation has little relationship with population growth writ large, but deforestation does increase with rural population density in particular. Deforestation was positively related to GDP per capita, although at a diminishing rate—an environmental Kuznets curve result.
In a more recent example, DeFries et al. (2010) used satellite-based estimates of forest loss for 2000 to 2005 and examined correlations with four demographic factors (urban, rural, and total annual population growth and percent of population that is urban), four factors related to agricultural production (net agricultural trade per capita, percentage of agricultural production that is exported, agricultural exports per unit production, and percentage of forest remaining in biome), and two economic factors (GDP per capita and annual GDP growth). The authors find that rural population growth is not associated with forest loss and instead highlight the importance of urban-based and international demands for agricultural products as drivers of deforestation.
A critique of these deforestation studies is that they often use few explanatory variables, such that omitted confounders may bias the estimated coefficient on population. In an analysis using panel data on satellite-based deforestation in the Brazilian Amazon, Pfaff (1999) finds that population density did not have a significant effect on deforestation when many potential determinants were included as controls, including land characteristics and factors affecting transport costs, such as distance to major markets and roads. Crespo Cuaresma et al. (2017) used a different approach to control for omitted variables, focusing on forest cover along national borders. After controlling for transborder geoclimatic differences, they find that income per capita is the only robust determinant of differences in cross-border forest cover, while population growth and rural population density are statistically insignificant.
Fisheries are another natural resource for which the relationship between population and degradation has been explored. Stewart et al. (2010) use regression models and find that fishing effort density (measured as boat-meters per square kilometer) in coastal zones significantly increased with a country’s population size but decreased with the length of its coastline. McClanahan et al. (2016) collected fish biomass estimates across all reefs of the western Indian Ocean and found that they were primarily driven by distance to markets and market population. In an application specific to the Solomon Islands, Brewer et al. (2013) find that population density is associated with greater use of modern fishing gear, which in turn is associated with lower biomass of coral reef fish vulnerable to extinction. Using a negative monomial regression model and a dependent variable indicating the number of threatened marine and freshwater fish species, Clausen and York (2008) find that that nations with large populations are likely to have more threatened fish species than nations with small populations; the coefficient on GDP per capita was also positive and statistically significant.
Regarding terrestrial biodiversity, McKinney et al. (2010) use data on species richness—defined as a nation’s number of threatened species divided by the world’s total of threatened species—and identify population size and measures of industrialization as anthropogenic predictors of species loss. However, in an earlier study that used panel data on countries instead of a cross section, Dietz and Adger (2003) estimated fixed and random effects models with time trends, finding that population change and density are not associated with species richness after controlling for GDP and civil liberty indices, but that percentage of protected area is positively correlated with both population change and density. In a more recent study, Rogers (2025) uses regression models to analyze factors predicting the status of threatened species using a different measure of biodiversity—the listing of a species on the International Union for Conservation of Nature Red List. The author finds that population density and GDP per capita are negatively correlated with Red List indications.
An interesting pattern in studies that employ reduced-form estimation approaches is that, while these studies generally find that population size and density are associated with greater environmental degradation, there are notable exceptions that find no statistically significant association, and these exceptions tend to be studies that use a larger number of explanatory variables and exploit panel data that allow for a rich set of fixed effects that can control for potential confounders. Going back to the IPAT identity and evidence showing that every variable in this identity is related to every other variable, it is not surprising that empirical approaches face challenges in identifying causal relationships between measures of population and environmental outcomes. This is true in the case of the Kuznets curve literature as well; the downward sloping part of the curve should not be taken to mean that higher income leads to less pollution, holding policy constant. Rather, we think that when countries get rich enough, they are willing to sacrifice some current output for a better environment through policymaking and investment in technology.
3.2.3 Quasi-Experimental Designs
Some researchers address this empirical challenge with quasi-experimental designs in settings with plausibly exogenous shocks to population. However, these quasi-experimental designs are enabled through observed localized shocks to population with environmental impacts that cannot be generalized to broader patterns of population change. Several papers examine the effects of cases of civil conflict-induced forced migration and internal displacement on land use in countries such as Sudan (Alix-Garcia et al. 2013) and Sierra Leone (Wilson 2014), finding negative impacts on forested lands. Focusing on refugee camps in 49 African countries between 2000 and 2016 and using data from satellite datasets on vegetation conditions, Maystadt et al. (2020) find that refugee populations are associated with small increases in vegetation condition and increased deforestation. However, using a differences-in-differences approach, Salemi (2021) finds that proximity to refugee camps in rainforest areas is associated with small reductions in extensive margin forest loss, such as that associated with land clearing. The author still finds that exposure to refugee camps reduces forest cover along the intensive margin, though estimated effects are small in magnitude.
One study finds that the environmental impacts of increased population due to migration can be mitigated by strong local governance. Aksoy and Tumen (2021) use the World Bank’s Local Governance Performance Index to show that the Syrian refugee influx in Turkey has increased per capita levels of solid waste and wastewater, and that provinces with poor quality governance almost entirely account for these increases. Other studies have shown that the impacts of migration on environmental outcomes are moderated by the strength of property rights (Elmqvist et al. 2007) and human capital development (Munir et al. 2026), but these studies rely on observational or cross-sectional approaches that do not match the causal inference properties of quasi-experimental studies.
Other quasi-experimental studies identify the effects of outmigration on environmental outcomes. Oldekop et al. (2018) use data from Nepal’s national census and of high-resolution forest cover change and find that international outmigration, driven by globalization forces, is associated with substantial increases in local forest cover. In a historical example, Gordon et al. (2026) used pollen records to find that floristic diversity in Europe fell dramatically during the Black Death era, followed by a recovery in diversity as human populations also recovered, highlighting the role of human density in influencing biodiversity.
As in other areas of empirical analysis, these quasi-experimental designs can be preferred for causal inference purposes because they exploit variation in population that is plausibly unrelated to the unobserved determinants of environmental degradation. But the features that give these designs internal validity limit what they can tell us about population-environment relationships more broadly. Exogenous migration shocks are typically localized, so the estimates may miss general equilibrium adjustments that appear only at regional or national levels. Moreover, migration is only one of several population-change mechanisms, alongside fertility, mortality, aging, and urbanization. Findings based on refugee and other migrant inflows therefore cannot be assumed to generalize to sustained fertility-driven growth or gradual urbanization.
3.2.4. Statistical Approaches for Prediction
In addition to the backward-looking empirical literature discussed above, some work from the demography literature uses statistical methods to project future demographic and environmental trends. For instance, Raftery et al. (2017) estimate a Bayesian hierarchical model of the two components of the Kaya identity at the country level: GDP per capita, and the carbon intensity of GDP. They then pair that model with the then-current version of the United Nations’ probabilistic population projections mentioned in Section 1 (which as of Raftery et al. [2017] predicted a decelerating but not shrinking population). The result is probabilistic projections of future greenhouse gas emissions—and thereby global temperature rise—through 2100. The model projected a mere 5 percent chance of limiting global temperature rise below 2°C. However, population was not found to be the primary driver of projected emissions growth or uncertainty around it, both of which were primarily driven by the competing forces of rising GDP per capita and declining carbon intensity of GDP.
Liu and Raftery (2021) updated the analysis of Raftery et al. (2017) accounting for additional years of data including increased national commitments to emissions reductions, finding that if countries achieved their nationally determined contributions to reducing greenhouse gas emissions, the chance of avoiding 2°C of warming could be meaningfully improved from the above-stated 5 percent to as high as 26 percent. Jiang et al. (2025) provided a further update incorporating realized emissions mitigation efforts in the ensuing years, finding that despite those efforts the chance of avoiding that 2°C warming level remained only 17 percent. Consistent with Raftery et al. (2017), neither of these two updates noted any particular outsized role of population in driving the projected emissions outcomes.
A key takeaway from these empirical, statistical literatures is that changes in projected anthropogenic climate change are more likely to be driven by economic, technological, and policy factors than by population itself. The reason for this distinction is that population trends are both slow moving (as also noted by Budolfson et al. 2025) and less uncertain than the other two drivers in the Kaya identity.
4. Other Dimensions of the Linkage between Population and the Environment
Beyond the projected decline in global population, population structures are changing in different ways and at different rates across the globe. Many factors shape why, where, and how populations are changing. Increases in migration and urbanization, decreases in fertility rates accompanied by an aging population, the spread of armed conflict, and climate feedback effects all contribute to and are affected by the population transformation. Each of these dimensions affects economic growth, natural resource consumption, and environmental quality differently. Moreover, the depletion and degradation of natural resources and environmental amenities are often localized so the mechanisms linking them to population often operate at local scales. Understanding these dimensions matters if we care not only about aggregate human welfare but also its distribution across regions and social groups.
In this section, we will also discuss how shifts in age structure are relevant because consumption, labor supply, and innovation vary throughout people’s lifetimes, so an aging population can affect the environment differently from a younger one of the same size. Religious and cultural traditions likewise shape fertility norms and environmental stewardship, and the cultural ecosystem services tied to these traditions may erode as communities shrink or disperse.
4.1. Changes in Fertility Rates and Age Structure
Changing age structures are a critical component of the transformation into an era defined by a slowing of population growth driven by lower fertility rates. The global population has aged since academics began fearing the effects of a population boom. From 1950 to 2018, the median age of the world population increased from 23.6 to 30 years. In 1950, 39 percent of the global population was between 5 and 24 years and only 5 percent was over the age of 65; in 2023, those same age ranges constituted 32 percent and 10 percent of the population, respectively. This transition has occurred in conjunction with decreasing fertility rates, decreasing child mortality, and increasing lifespans.
Childhood mortality is a significantly smaller threat than it used to be. Between 1990 and 2024, the number of deaths per 1000 births for children under the age of five decreased from 93.5 to 37.4. Over that same timeframe, the total number of neonatal deaths worldwide declined from 13 million to 4.9 million. Advancements in and access to medicine and technology have been major contributors to this decline. Reductions in childhood mortality rates are associated with decreasing fertility rates, as families tend to have fewer offspring knowing there is a higher likelihood they will survive beyond childhood (Aitken 2024). The effects of fertility on the environment are often observed in the context of the population as a whole. Sasson and Weinreb (2017) study the direct relationship between fertility and rural land cover and argue that in communities with low natural capital, higher fertility levels and preference further decrease the available stock of resources. There has been more examination into the effects in the other direction. Changing weather patterns, hotter temperatures, and the increased frequency of natural disasters have all been associated with decreased fertility rates and total births (Noel and Greulich 2026; Cho 2026). As examined above, reductions in fertility rates are a large contributor to the decreasing rate of population growth. Contrastingly, declining rates of childhood mortality can increase the lifespan of women above 15 years old, as it eliminates many maternal bereavement periods (Zipple 2024). Increased life expectancies also increase the total population size (Acemoglu and Johnson 2007). Reductions in neonatal and childhood mortality have contrasting effects on changing population dynamics, both contributing to lower fertility rates and increasing life expectancies.
There remains disagreement around the environmental impacts of changing age structures. Many studies observe aging populations without overall consumption decreases and argue this suggests reduced environmental pressures (Zagheni 2011; Götmark et al. 2018). Apart from consumption, some studies have found that aging populations tend to be more environmentally conscious in their concern for climate change; this is more pronounced for individuals who are grandparents (Bordone et al. 2026). In Jarzebski et al. (2021), the authors assess the impact an aging and shrinking population will have on achieving certain UN Sustainable Development Goals (SDGs). They argue that it will be easier to achieve SDGs 6 (Clean Water and Sanitation), 14 (Life under Water), and 15 (Life on Land) because lower consumption rates will put less pressure on natural resource extraction and conversion. They argue, however, that overall resilience and adaptability to climate change will be harder because elderly populations are more vulnerable to extreme weather events. Moreover, some analyses find that emissions increase with age. Zheng et al. (2022) determined that the share of contribution from adults above the age of 65 to total consumption-based emissions increased by 7.5 percentage points from 2005 to 2015 in developed nations. This is because consumption patterns remain energy intensive as individuals age, particularly in wealthier nations (Baum et al. 2025; Choi and Kim 2025). One of these patterns is the increased consumption of healthcare services; the increasing proportion of hospitalizations and health expenditures raises emissions associated with the healthcare sector (Ahmad et al. 2025; Yang et al. 2022). Populations around the world are aging at different rates, and the environmental impacts of these changes are widely debated.
4.2. Population Change in Rural vs. Urban Settings
Urbanization has been a key component of population and economic growth over the last century. In 2008 the share of the global population living in urban environments officially surpassed that of rural ones. This event marked a major shift: the global economy had expanded dramatically since 1950, when only one-third of the population lived in urban areas. Economic development and urbanization are complements, as rural-to-urban population change is considered the first stage of transitionary growth for advanced economies (Adams 2021). Urbanization can also foster innovation by facilitating the exchange of products and ideas (Glaeser 2011). Apart from supporting economic growth, urban development has reinforced population expansion (Lam 2011). This can be seen particularly in Asia. Between 1990 and 2015, the continent’s population increased from around 3 to 4.5 billion people, growing by 50 percent (ESCAP 2025). Simultaneously, the total amount of urban land area in Asia grew by 48 percent. In Mahtta et al. (2022), the authors develop a descriptive statistical model of urban growth by looking at the effect of population and economic output on urban land expansion (ULE). They find that for the periods before and after the year 2000, an increase in population growth rate had about double the impact on ULE relative to an increase in GDP per capita. Weber and Sciubba (2018) similarly found that population growth drove ULE in Western Europe, although they found it had no significant impact in Eastern Europe, where economic growth was a larger driver. Despite these discrepancies, these two factors have driven urbanization worldwide.
Existing urban areas are associated with the consumption of natural resources and the erosion of environmental quality. Energy consumption, industrial output, and automotive traffic are all major contributors to air pollution in urban environments. Almost half of cities worldwide have levels of air pollution that are at least seven times higher than the WHO recommendation. Waste, industrial discharge, and agricultural runoff in and around urban areas result in water and soil contamination (Denchak 2023; Bisht et al. 2024). In addition to encouraging water pollution from runoff, impervious surfaces prevent groundwater absorption, which can lead to floods (USGS 2018). Noise and light pollution are other externalities of cities and urban areas; they are especially harmful for nocturnal animals and insects (Eklöf 2020). Many of these attributes harm areas beyond the urban epicenter, but cities themselves experience their own direct effects. The urban heat island effect is a phenomenon in which urban environments experience higher temperatures than their rural counterparts, largely because of the heat-absorbing built density. This increase in both surface and air temperature leads to more energy consumption for cooling, and consequently more air pollution (US EPA OAR 2014; Badia et al. 2025).
Between now and 2050, the global urban population is expected to increase by about one billion residents (United Nations 2025b). Many existing cities will continue growing vertically, but new urban environments, particularly in developing countries, will have to encroach upon natural land. Land use change is the largest direct impact of urbanization. The expansion of built density requires the conversion of some type of existing landscape; modeling of the different IPCC SSPs reveals that by 2100, 51–63 percent of new global urban land will be converted from cropland and 30–44 percent will be converted from forests and grassland, with wetland losses occurring at a smaller scale in the United States and sub-Saharan Africa (Chen et al. 2020). The alteration of ecosystems is harmful for biodiversity, as it leads to habitat loss or fragmentation (Liu et al. 2016). Deforestation reduces the Earth’s capacity to absorb carbon and releases greenhouse gases back into the atmosphere; it can also exacerbate flooding and force oceans to absorb more carbon, leading to acidification (Mackenzie and Denchak 2025). As cities continue to expand to accommodate growing populations, their effects will be wide reaching.
Although the rural population share has decreased in recent years, the total rural population has increased steadily, from 3.03 billion in 1990 to 3.46 billion in 2025. Global rural settlement areas have increased at a much faster rate; between 2000 and 2020, rural land use increased by 36 percent, encroaching upon 2.3 times more natural and semi-natural land than urban areas (Liu et al. 2025). Nonetheless, people are still moving from rural environments to cities, a shift that has its own impact on existing rural landscapes. Liu (2022) uses China as a case study for an analysis of rural environmental quality (REQ), which is based on the eco-environmental quality index (EQI) framework. The author observed the periods 2000–2010 and 2010–2020, when rural populations declined from 800 to 500 million, and defined REQ as a function of natural conditions (terrain, precipitation, and temperature), economic development (changing activities in rural regions), demographic change, and eco-environmental protection policies. Liu found that REQ experienced net improvement during both periods at the national level, driven by transformations of grassland and woodland. Decreasing rural populations and land use offers opportunity for the revival of natural ecosystems.
4.3. Migration
The movement of individuals across borders has become increasingly common post-industrialization. In Section 3.2, we described how migration—and forced migration in particular—is often used to obtain causal empirical estimates of the impacts of increased population or population density on environmental outcomes. However, the role of migration in this relationship extends beyond its practical use in empirical studies. According to the UN 2026 World Migration Report, there are over 300 million international migrants, representing just under 4 percent of the world’s population. There are multiple ways to refer to individuals moving from one place to another. We use “migrant” as an all-encompassing term to refer to anyone involved in cross-border movement, whatever the reason. This includes refugees and asylum-seekers, as global data on international migration typically covers these groups (UNHCR 2018). There are countless reasons migrants move. “Push factors,” such as conflict, poverty, or environmental pressure, are the reasons migrants leave their country of origin, while “pull factors,” like economic opportunity, familial support, or education are the reasons for their destination (European Parliament 2024). These factors often work together to inform migration decisions.
As examined in Section 4.1, the share of population that is native born is decreasing in many high- and middle-income nations, particularly because of declining fertility rates. As populations age, the dependency ratios (the ratio of economically dependent individuals to economically productive ones) in many OECD nations are falling. For that reason, immigration of working-age adults has supported economic growth in advanced economies (Beadle 2025). A large portion of migrants leave their country of origin in search of economic opportunities or to escape poverty. In 2024, 51 percent of migrants settled in the United States and Europe, while millions sought out other high-income countries across the Middle East, Asia, and Oceania. This feature can also be witnessed by observing the money sent by migrants to friends or family in their homeland, known as remittances. Over $900 billion in remittances were transferred in 2024, with 76 percent going to people in low- and middle-income countries (Paez-Deggeller 2025). Apart from remittances, there are many ways that migrants contribute to productively both in their new and old homes; diaspora networks, trade, education, and entrepreneurship influence societal and economic growth (Brunow et al. 2015). Migrants also contribute substantially to the economies of countries they immigrate to. This particularly applies to high-skilled immigrants. Basso et al. (2026) found that high-skilled immigration from non-OECD countries to OECD countries contributed positively to economic indicators including income per capita, TFP, and labor productivity.
Many migrants move outside their home country’s borders due to environmental factors. The United Nations distinguishes between “environmental migrants” and “climate migrants,” with the former leaving their country of origin because of changes in their environment affecting their living condition, while the latter leave because of environmental changes directly related to climate change (IOM UN Migration 2026a). There are differences in how environmental migration materializes around the world. In Yang et al. (2025), the authors analyze the sensitivity of international migration to climate change across 160 countries and regions between 1960 and 2000. Their findings indicate a strong overall correlation between migration and climate change, with inflows in Europe and North and South America, and outflows in South and Southeast Asia. In low-income nations, there is a weaker relationship between temperature changes and migration, which is highly correlated to economic immobility. This demonstrates the relationship between environmental degradation and migration and highlights the disparity of experiences based on economic status. Migration can also contribute to both resource and environmental quality degradation. Migrants moving from low-income, high-fertility countries to high-income, low-fertility countries may increase their carbon footprint to the extent that the move raises their consumption levels, unless other factors like carbon intensity more than offset this. Even if migrants do not move to more advanced economies, they may still impact environmental quality, since most migrants settle in urban areas (Frey 2025; Lerch et al. 2025). As explored in section 4.2, urbanization harms the environment in multiple ways.
4.4. War and Conflict
Throughout history, military conflicts have had devastating impacts on humanity and the natural environment. World War II is considered the deadliest conflict in history, resulting in an estimated 70 million casualties. Since then, multiple other conflicts, including the Korean War, the Vietnam War, the Nigerian Civil War, the Soviet-Afghan War, and the Second Congo War have each resulted in over a million deaths. Although the scale of armed conflict has decreased since World War II, the total number of conflicts occurring has reached record levels. In 2025, there were 65 active state-based violent conflicts across 35 countries. Instances of state-based violence and the number of international conflicts rose from 2024, indicating an increasingly hostile world (Rustad 2026). The impact of armed conflict on population estimates is obvious: more war results in more death. Aside from deaths, veterans and survivors of conflict often face long-term health struggles. One such issue is exposure to heavy metals, which reduces fertility in both men and women (Rubaii et al. 2025; CDC 2026).
Military conflict is also a contributor to the deterioration of environmental quality and natural resources. A 2022 report estimated that the carbon footprint of the global military industry was 5.5 percent of global emissions, not counting emissions from conflicts themselves (Parkinson and Cottrell 2022). Conflicts themselves result in a host of environmental impacts, including deforestation, water pollution, waste, biodiversity loss, soil erosion, habitat fragmentation, and flooding (Meaza et al. 2024; Laakkonen 2017). Between the emissions released from military jets and vehicles, the toxic substance exposure and infrastructure destruction from exploding devices, and the lasting effects of chemical contamination, there are many adverse environmental effects of military conflict.
As populations have grown over time, armed conflicts have occurred more frequently. In Acemoglu et al. (2020), the authors apply a Malthusian model to data revealing an increase in violent conflicts following World War II. They define this period of greater access to medical resources and increasing lifespans as the “epidemiological transition.” They find that population surges that occur without corresponding technological growth result in scarcity, increasing the likelihood of conflict. Environmental factors are pivotal too, as natural resource scarcity and natural disaster occurrences also correspond with increased armed conflicts. Climate change itself plays a role in influencing conflict. Historically, periods of conflict worldwide have followed patterns of temperature change, especially during cooling periods; cooler temperatures can in certain contexts decrease agricultural yields and increase prices, with ensuing violent conflict and thus population decline (Zhang et al. 2007). Hotter temperatures, a result of increased greenhouse gas emissions, are also found to be correlated with increasing outbreaks of conflict, particularly internationalized intrastate wars (Hsiang and Burke 2014; Ko et al. 2024). The effects of climate change, including the intensification of natural disasters, encourage socioeconomic hardship, driving existing tensions and raising the likelihood of conflict (Sofuoğlu and Ay 2020). Climate change also drives environmental scarcity, particularly in developing regions, resulting in conflicts over the control of specific resources (San-Akca et al. 2020). It is unclear how future population decline will impact the probability of armed conflicts, but the pronounced effects of climate change are likely to continue raising global tensions.
4.5. Cultural Services and Religion
While less studied by economists, the broader literature identifies a potentially important channel through which population change—and rural depopulation in particular—may influence environmental outcomes through losses in the diversity of cultural services and the people–nature interactions that deliver those services. For example, Indigenous communities around the world possess a rich body of ecological knowledge about local environmental resources and biodiversity that is rapidly disappearing (e.g., Reyes-García et al. 2014) and will continue to do so through rural depopulation (Marini et al. 2024). In another example, MacDonald et al. (2000) posit that rural depopulation and agricultural land abandonment as a postwar trend in western Europe produces undesirable environmental outcomes, such as in biological and landscape diversity, in part due to the decline of traditional farming practices. Because local ecological knowledge can be incorporated into environmental policies and mitigate trends in environmental degradation (Tenza-Peral et al. 2022), more research is needed to identify communities with shrinking populations that are susceptible to knowledge loss.
The changing role of religion around the world also has implications for population change and the environment. Approximately 75 percent of the world’s population is religious. Although many factors have propelled population growth over the last few centuries, religion has been an influential component; Christianity, Buddhism, and Islam, three of the largest world religions, all encourage fertility and birth in their scripture and teachings (de la Croix and Delavallade 2018). Organized religions have added hundreds of millions of followers in the twenty-first century, but secular ideas have also grown. Between 2010 and 2020, the “religiously unaffiliated” population grew by 0.9 percentage points (Hackett et al. 2025). Unlike many major religions, social secularism has a negative relationship with country-level fertility rates and individual fertility behavior (Schnabel 2021). Forecasts of religious growth are uncertain but will undoubtedly influence future population change.
The teachings of most major religions encourage some form of stewardship or care of the planet, its biodiversity, and its resources (UNEP 2019). These teachings are not always applied, however. In the United States, survey data from 2025 illustrates that 44 percent of Christians and 38 percent of Muslims believe that the economic costs of strict environmental regulation are not worthwhile (Smith et al. 2025). In India, the annual Ganga River bathing ritual performed by Hindi pilgrims has further reduced the quality of an already polluted river (Agnihorti et al. 2025). Conversely, the Chinese government has a doctrine of state atheism and most of its population defines themselves as secular, yet it is the largest CO2 emitting country. As with its influence on population, the role religion will play on future environmental outcomes is ambiguous.
5. Discussion
We draw five key lessons from this literature.
First, our review shows that the relationship between population and environmental outcomes is not a single causal pathway but a system of interacting variables, often exhibiting feedbacks among them. The modeling components and linkages summarized in Figure 1 make this point. However, any given study in the existing literature focuses on a subset of these components and linkages. A contribution of our review is to represent all these interdependencies and feedbacks in an integrated framework.
Second, the complexity illustrated in Figure 1 is compounded by an asymmetry in existing empirical work and modeling, which primarily draws on observations of growing populations. There are theoretical and empirical reasons to expect that to expect that, owing to the dynamics and nonlinearities of human systems, the impacts of population decline are not simply the impacts of population growth run in reverse. Depopulation can relieve pressure on land and allow ecosystem recovery, but it can also erode the labor, institutions, and local ecological knowledge that sustain stewardship, and land abandonment has been associated with loss of biodiversity in some settings. Population growth and decline can also have asymmetric impacts on the stock and accumulation of technological innovation (Jones 2022), with potential adverse consequences for both living standards and environmental outcomes. Irreversibilities, changing age structures, and shrinking markets may also alter investment and resource management in ways not captured by simply reversing the signs of estimates from growth-era studies. Forecasting the environmental consequences of population decline will therefore require new evidence drawn from declining and aging populations, along with models that allow for asymmetric, state-dependent, and potentially threshold responses.
Third, the literature on the determinants of economic growth demonstrates that the treatment of technological growth and innovation plays a crucial role in supporting sustained income growth despite a growing population and the depletion of exhaustible resources. In practice, technological growth has helped support rising living standards despite those stresses. How does this lesson apply to the case of population decline? First, and perhaps most obviously, if one were to take the negative direct environmental effects of population growth from the literature as static conclusions, those environmental stresses may be unwound or at least weakened as the population trajectory decelerates and ultimately begins to shrink. A more nuanced perspective comes from observing the historical trend of technological growth saving the day from otherwise dire predictions; this tendency may suggest that humanity responds to incentives by adapting to shocks in general (see, e.g., Acemoglu et al. 2026)—whether those shocks are to population growth on the upside or the downside. On the other hand, this conclusion requires that technological development does not stagnate as population growth slows (Jones 2022). Different papers explore different conjectures of the primary drivers of technological growth. For instance, Bretschger (2013) assumes technological growth is fueled by innovation-focused labor, while Sasaki (2019) assumes it is driven by capital accumulation. These notions have diverging implications for the impacts of population decline, which has more direct adverse effects on innovation and hence sustainable economic growth if it is driven by labor than if it is driven by accumulated capital (the latter being larger per capita, all else being equal, when population is declining).
A second distinction for population decline is that some macro growth models may not be well suited to modeling nonmonotonic population trajectories, such as growth followed by decline. In particular, many such models assume that production functions have static functional forms, for instance having productivity determined by the instantaneous amount of capital, labor, or resources available (e.g., Sasaki 2019; Bretschger 2013). A reasonable alternative could be that available technology and hence productivity depend on some dynamic running maximum of those factors to reflect the nondepreciating nature of scientific knowledge. In the context of a nonmonotonic population trajectory, such static approaches (depending on the other features of the model) threaten to flatten the dynamic relationships between technology and population (among other factors) over time. In other words, while innovation and technological advances may be driven by population growth, it does not necessarily follow that accumulated technological knowledge and the productivity it enables will contract as population does, as some models implicitly assume.
Fourth, existing literature illustrates the importance of reliable and accessible data to accurately model the effects of declining populations on environmental outcomes. Data needs encompass multiple components, including emissions, land use change, and extraction and quality of natural resources. Different types of data, such as satellite, emissions monitoring, and census data, have been and will continue to be applied to observe this relationship. These forms of data must continue to be collected to remain timely as population estimates continue to change. Data on population change itself is accessible, with many countries and international entities reporting these values.
Fifth, and relatedly, future analytical methods would be improved by more widespread application of causal inference methods for identifying statistical relationships between population and environmental outcomes, appropriately accompanied by the development of more sophisticated structural models based on economic theory. Our review found many regression-based studies that sought to explain the relationship between the abundance of different types of natural resources and population without an adequate number of controls. Studies that did try to control for confounders more comprehensively often found that statistically significant relationships between population and natural resource degradation found in earlier studies disappeared. Further research is needed to disentangle the role of population size and density per se from the role of correlates such as distance to markets. One way to identify these causal relationships in a more robust manner is to rely on natural experiments, but the source of quasi-random variation in population used in these studies often relies on cases involving forced migration and conflict, which limits the external validity of the results. Because of these shortcomings associated with statistical approaches, efforts to better understand the relationship between population and the environment should also include the use of structural models grounded in economic theory. These models represent behavior through primitives such as preferences, technology, and institutional constraints, enabling them to capture the endogenous response of fertility and migration to changing economic and environmental conditions and the influence of resource scarcity on innovation and investment. The structure in these models also lets them evaluate counterfactuals and policies outside the range of historical experience, which matters for a future of population deceleration, aging, and decline that existing data do not capture.
In May 2026, scientists officially determined that humanity would avoid the initially projected worst case scenario effects of climate change (van Vuuren et al. 2026). Many of the highest emitting countries in the world have invested in efforts to decarbonize their economies since the adoption of the 2015 Paris Climate Agreement, resulting in this achievement. The legally binding (albeit difficult to enforce) agreement calls for member countries to limit “the increase in the global average temperature to well below 2°C above pre-industrial levels,” while pursuing a 1.5°C limit to warming (UNFCCC 2015). Yet in September 2026, UNEP released a report conceding that global action to reduce emissions has not been swift enough to prevent warming from crossing the 1.5°C threshold (UNEP 2026). A week after this acknowledgment from the United Nations, a study was published in which the authors quantified the effects of natural feedback loops such as permafrost thaw and wildfires; they estimated that these warming-induced emissions could amplify warming (from post-2020 levels) by 20–30 percent (Abernethy et al. 2026). Wildfires, droughts, rising temperatures, and floods, all of which are amplified by climate change, are already impacting millions of lives, and their effects are only projected to worsen (Romanello et al. 2025). As environmental degradation persists and its effects change over time, so will the response of the human population.
6. Conclusion
So what can we say about the environmental implications of a decelerating and perhaps even shrinking human population as we approach 2100? The answer seems to be little—with much confidence at least. The relationship between population growth and the environment is highly multifaceted; with many interacting variables and feedbacks and complex temporal dynamics, it is not always obvious that lessons from studies of population growth can be easily extrapolated to population decline. Economics holds important lessons for why certain past predicted disasters were avoided, with endogenous technological innovation, prices responses, and substitution all playing key roles. But those responses require supportive institutions to bear fruit, and resource degradation is a real threat where there are inadequate incentives for conservation. While it is clear that we are diverging from the Doomsday scenario, the varying and sometimes conflicting evidence on the magnitude of population’s environmental impacts—and the channels through which they occur—highlight the need for good quality data and further research to serve as a foundation for better, grounded understanding of our shared future.