What Is An “Energy Community”? Alternative Approaches for Geographically Targeted Energy Policy
We offer an alternative to the definition of an “energy community” outlined in the Inflation Reduction Act, one which would more narrowly target fossil fuel–dependent communities by targeting smaller geographic units (counties) and scaling financial incentives to reflect the level of fossil fuel activity in each county.
Abstract
The Inflation Reduction Act of 2022 seeks to dramatically increase clean energy innovation, manufacturing, and deployment in the United States. Unlike most previous federal energy policy, it ties many incentives to labor requirements, domestic manufacturing, and project location. We examine a provision of the law that offers additional financial incentives for projects to locate within “energy communities.” Our analysis indicates that the law’s definition of energy communities could vary widely depending on interpretation of key phrases. In addition, we find that the law, as written, is unlikely to steer investment specifically toward those communities that will be most heavily affected by a transition away from fossil energy. We illustrate these findings through three interpretations of the energy communities definition and show that it does not specifically target fossil energy–dependent local economies, but instead is likely to cover between 42 and 50 percent of US land area. We then offer our own definition of “energy communities,” which more narrowly targets locations that have been or are heavily dependent on fossil fuels as a driver of local economic activity, employment, and government revenue.
1. Executive Summary
Some of the most concentrated effects of a transition to a net-zero economy are likely to occur in regions that are or have been heavily dependent on the extraction, processing, and concentrated use (e.g., at power plants) of coal, oil, and natural gas. The Inflation Reduction Act of 2022 (IRA) includes a provision that directs additional financial incentives for clean energy projects developed in “energy communities,” which could provide geographically targeted economic benefits to regions that face challenges associated with a reduction or cessation of fossil fuel activities.
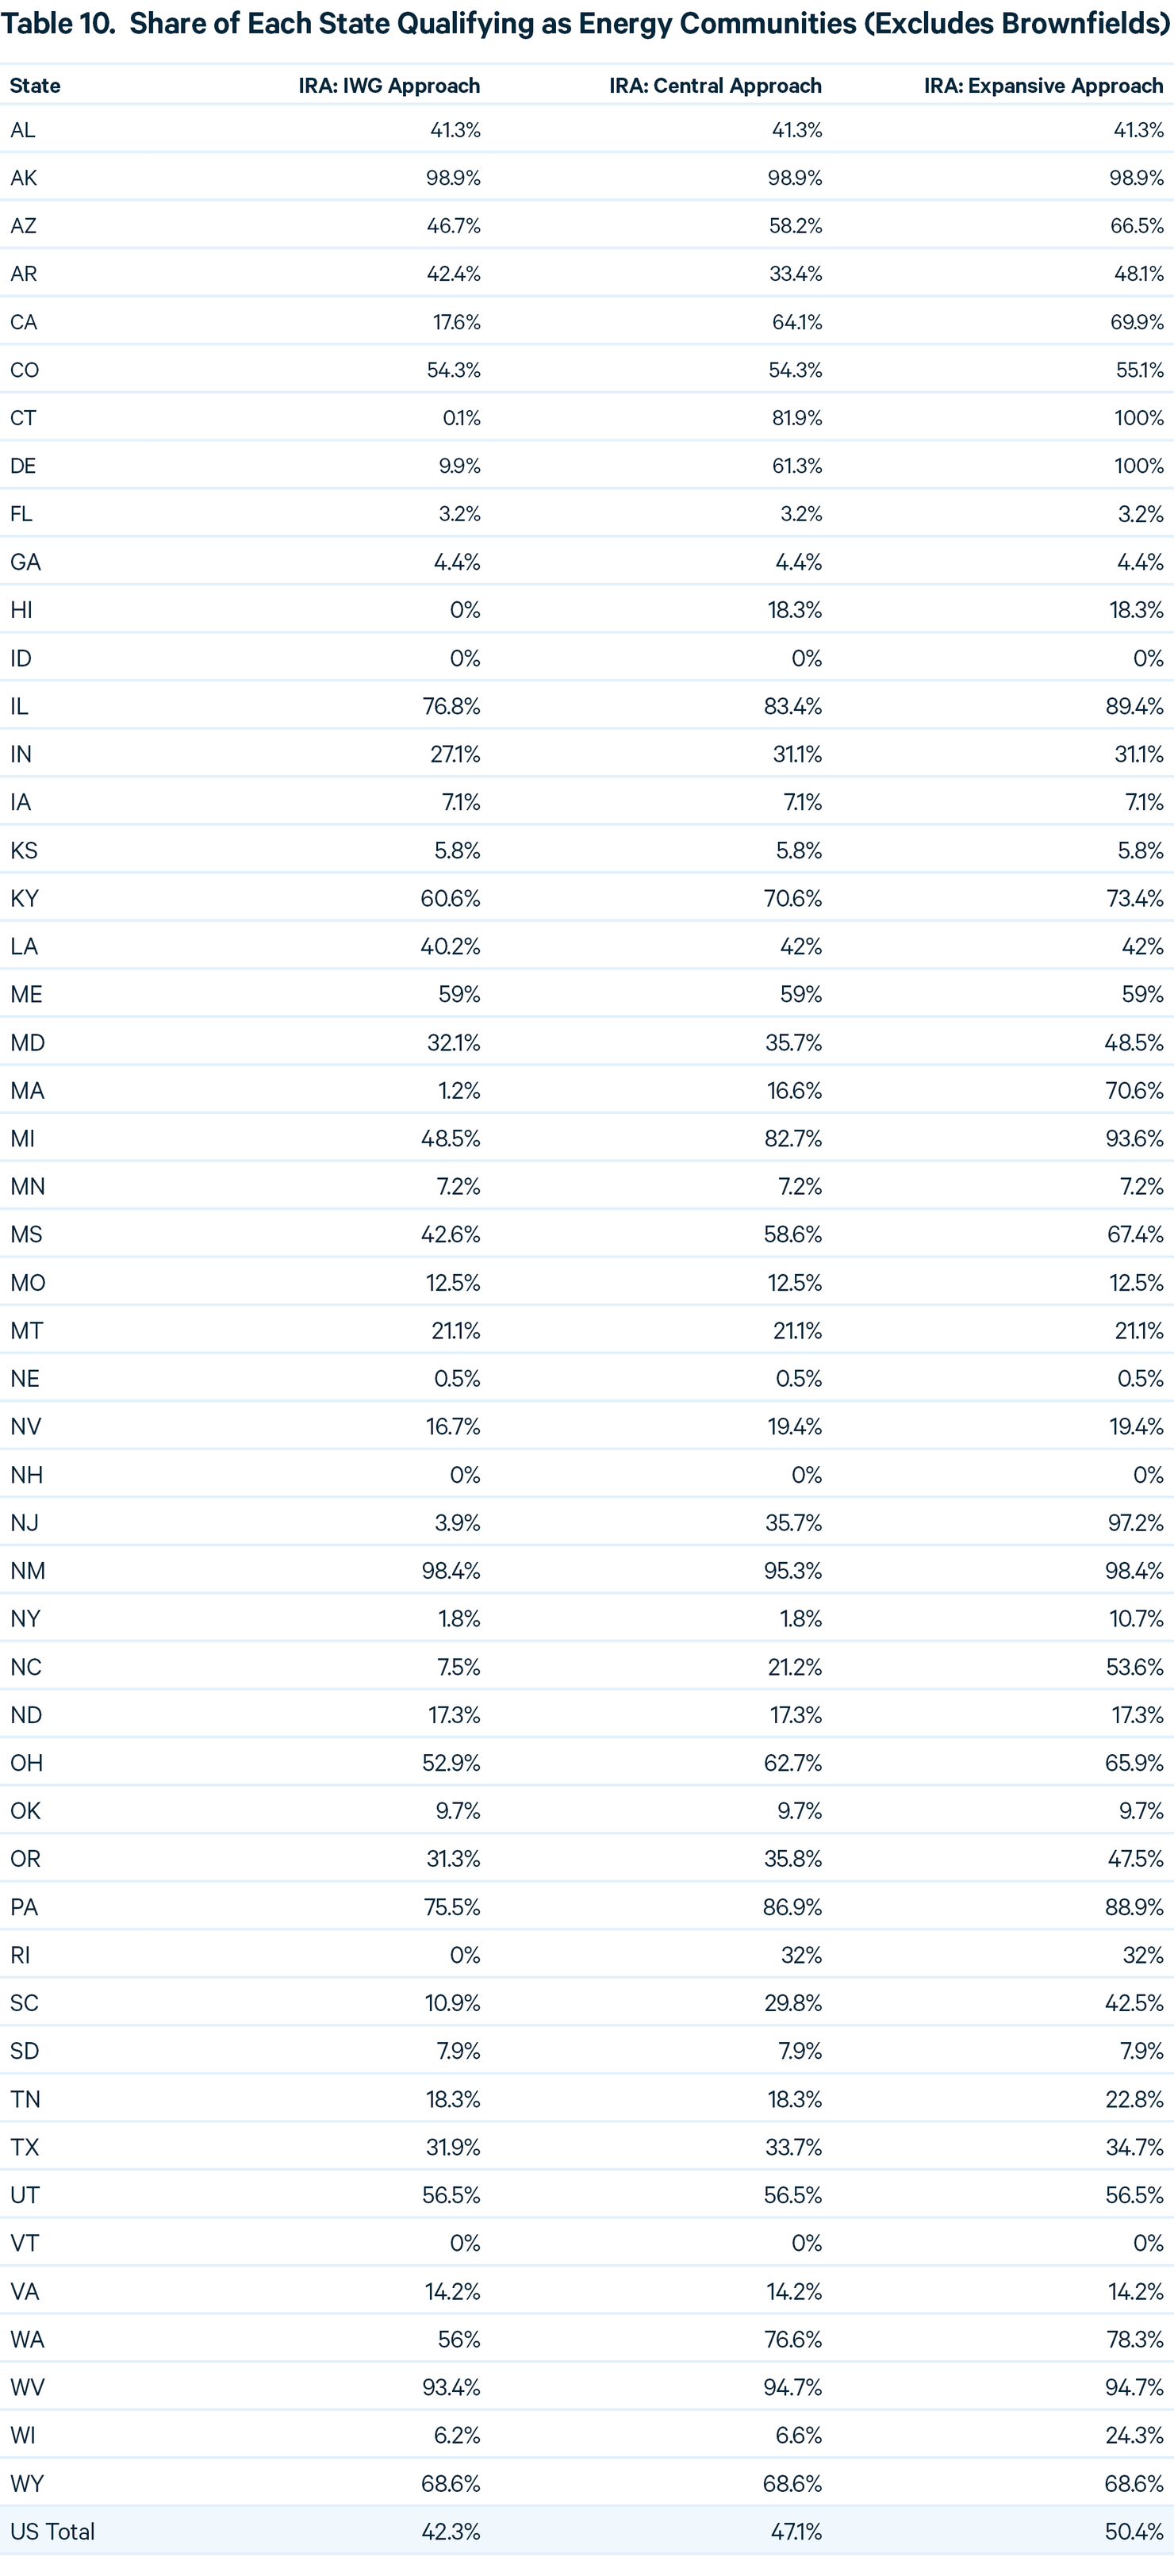
However, defining an energy community is not straightforward, and the IRA definition could be interpreted in multiple ways. In this analysis, we provide three alternative interpretations and estimate that the additional financial incentive would cover 42–50 percent of US land area. We also find that the policy is unlikely to specifically support the communities that are or will be most heavily affected by a decline or cessation of fossil fuel activities. Although the law is likely to channel additional resources to certain regions with high levels of dependence on fossil fuels for jobs and tax revenue, such as Alaska, Pennsylvania, West Virginia, Wyoming, and parts of Ohio and the Gulf Coast, it excludes other regions with high levels of dependence, such as North Dakota, Oklahoma, Utah, and west Texas. In addition, the IRA appears to include large swathes of states where fossil fuel extraction, processing, and use do not play a major role in the economy, such as California, Maine, Michigan, Oregon, and Washington State.
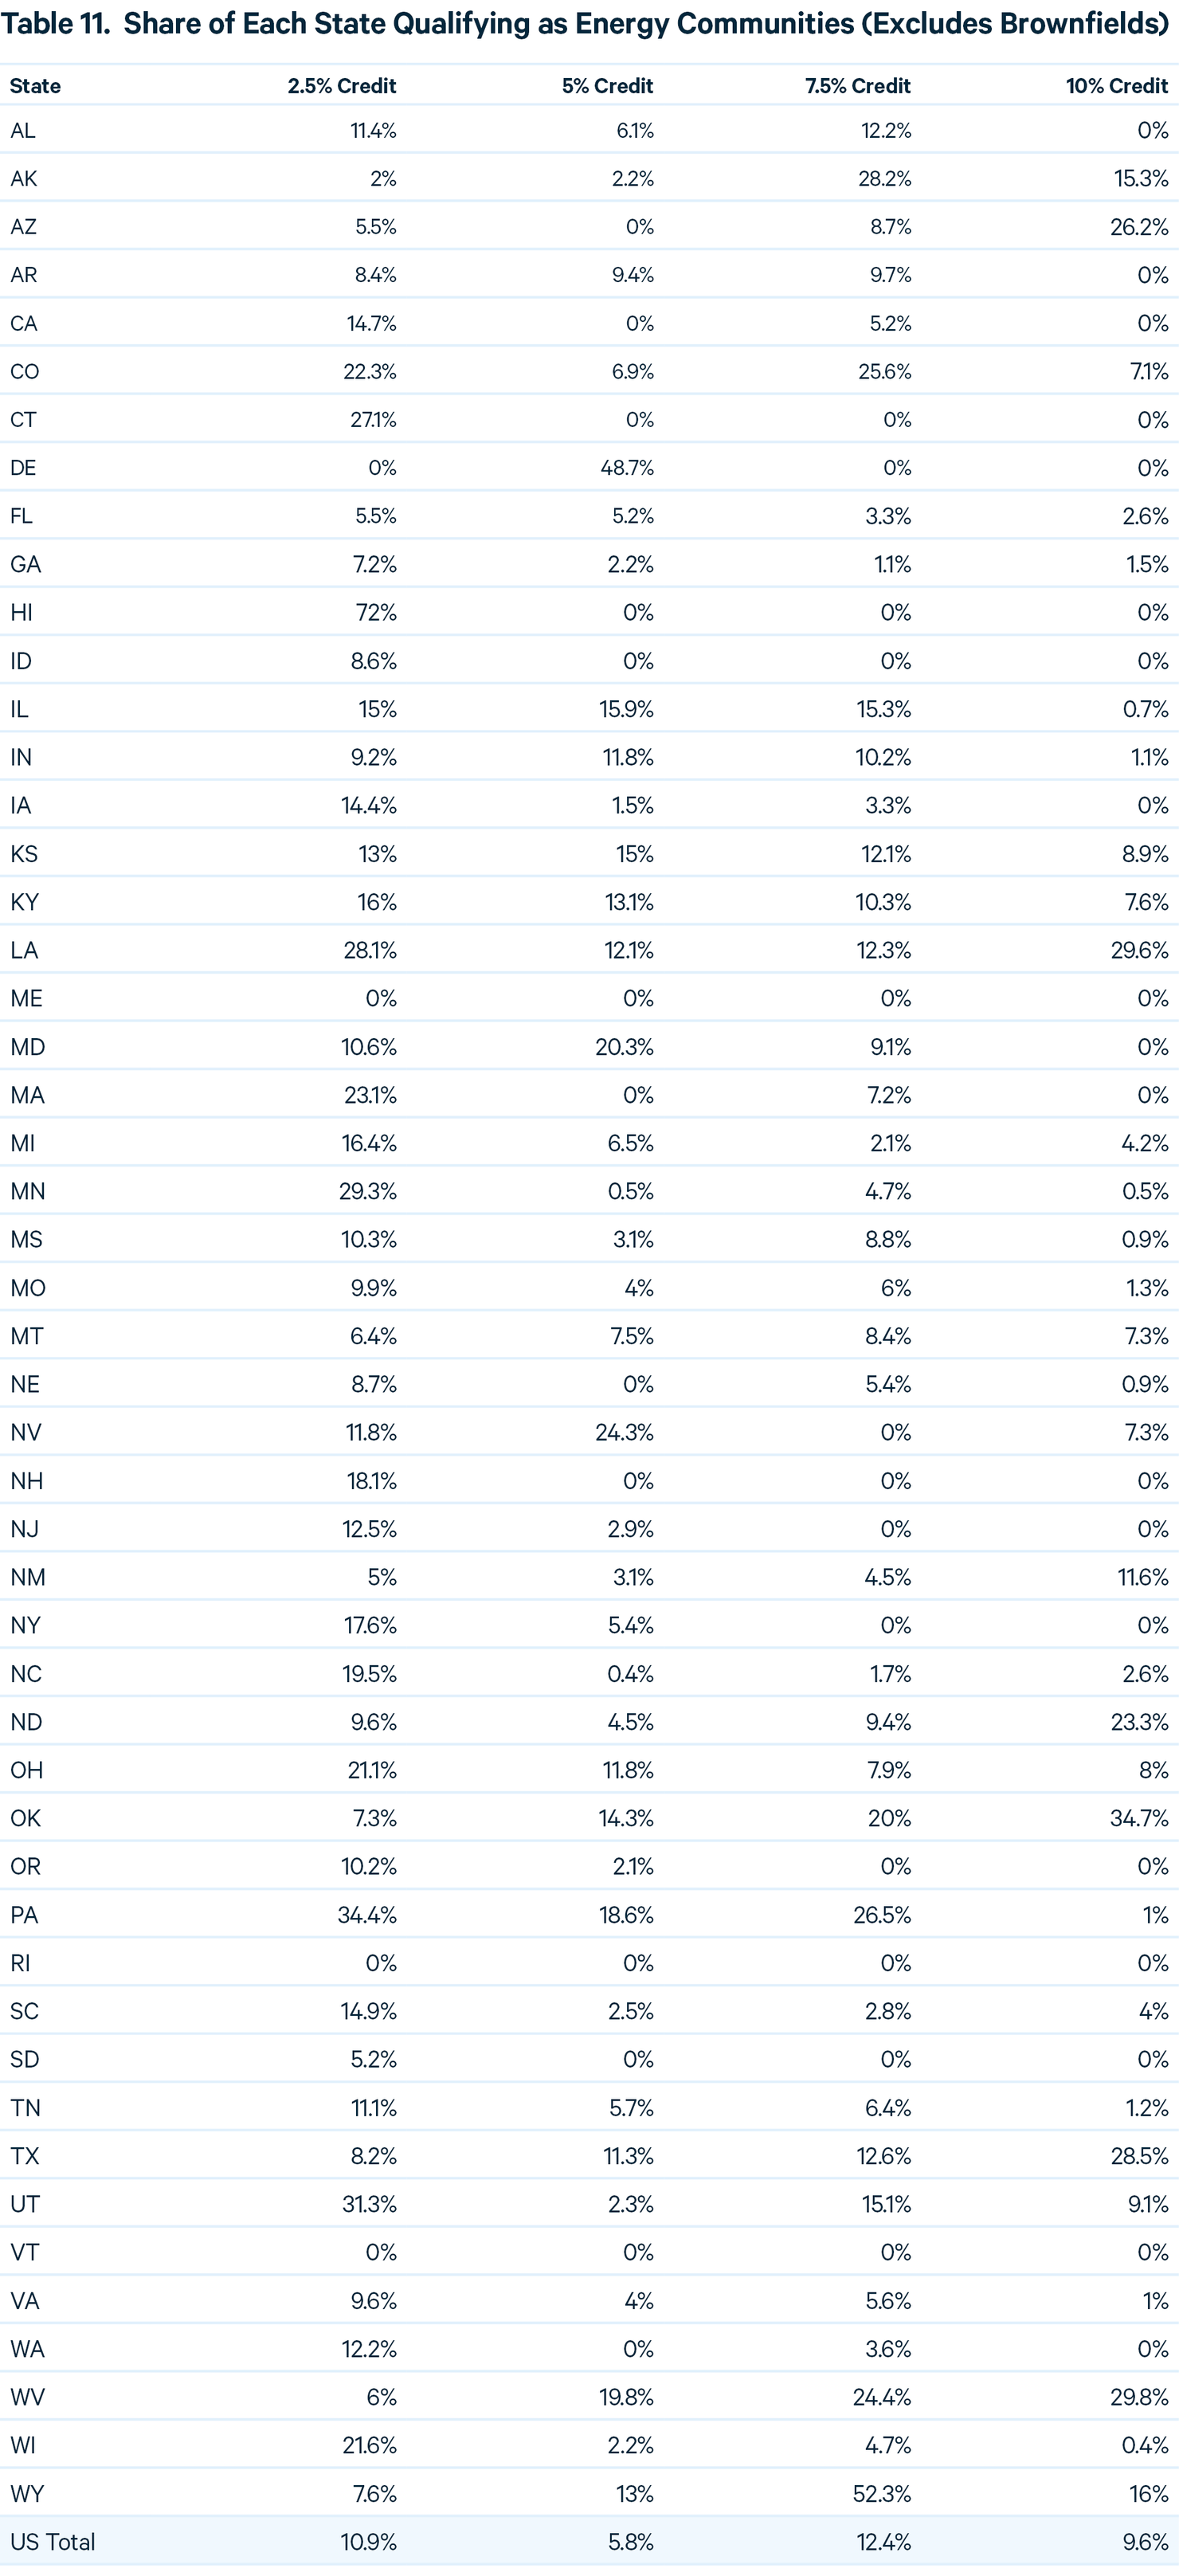
If the intent of the energy community provision is to direct funding toward the regions most impacted by a transition from fossil fuel activities, we believe alternative criteria could better target these areas. We offer an alternative definition of an energy community, which would more narrowly target fossil fuel–dependent communities by using smaller geographic units (counties) and scaling financial incentives to reflect the level of fossil fuel activity in each county. Our approach would provide the highest level of incentive to 10 percent of US land area, with an additional 29 percent eligible for lower levels of incentives. Policymakers could adopt this approach in future legislation, and easily adjust the geographic scope or the level of financial support to suit their policy priorities.
The key differences between the IRA and our definition of energy communities are summarized in Table 1 and visualized in Figures 1 and 2.
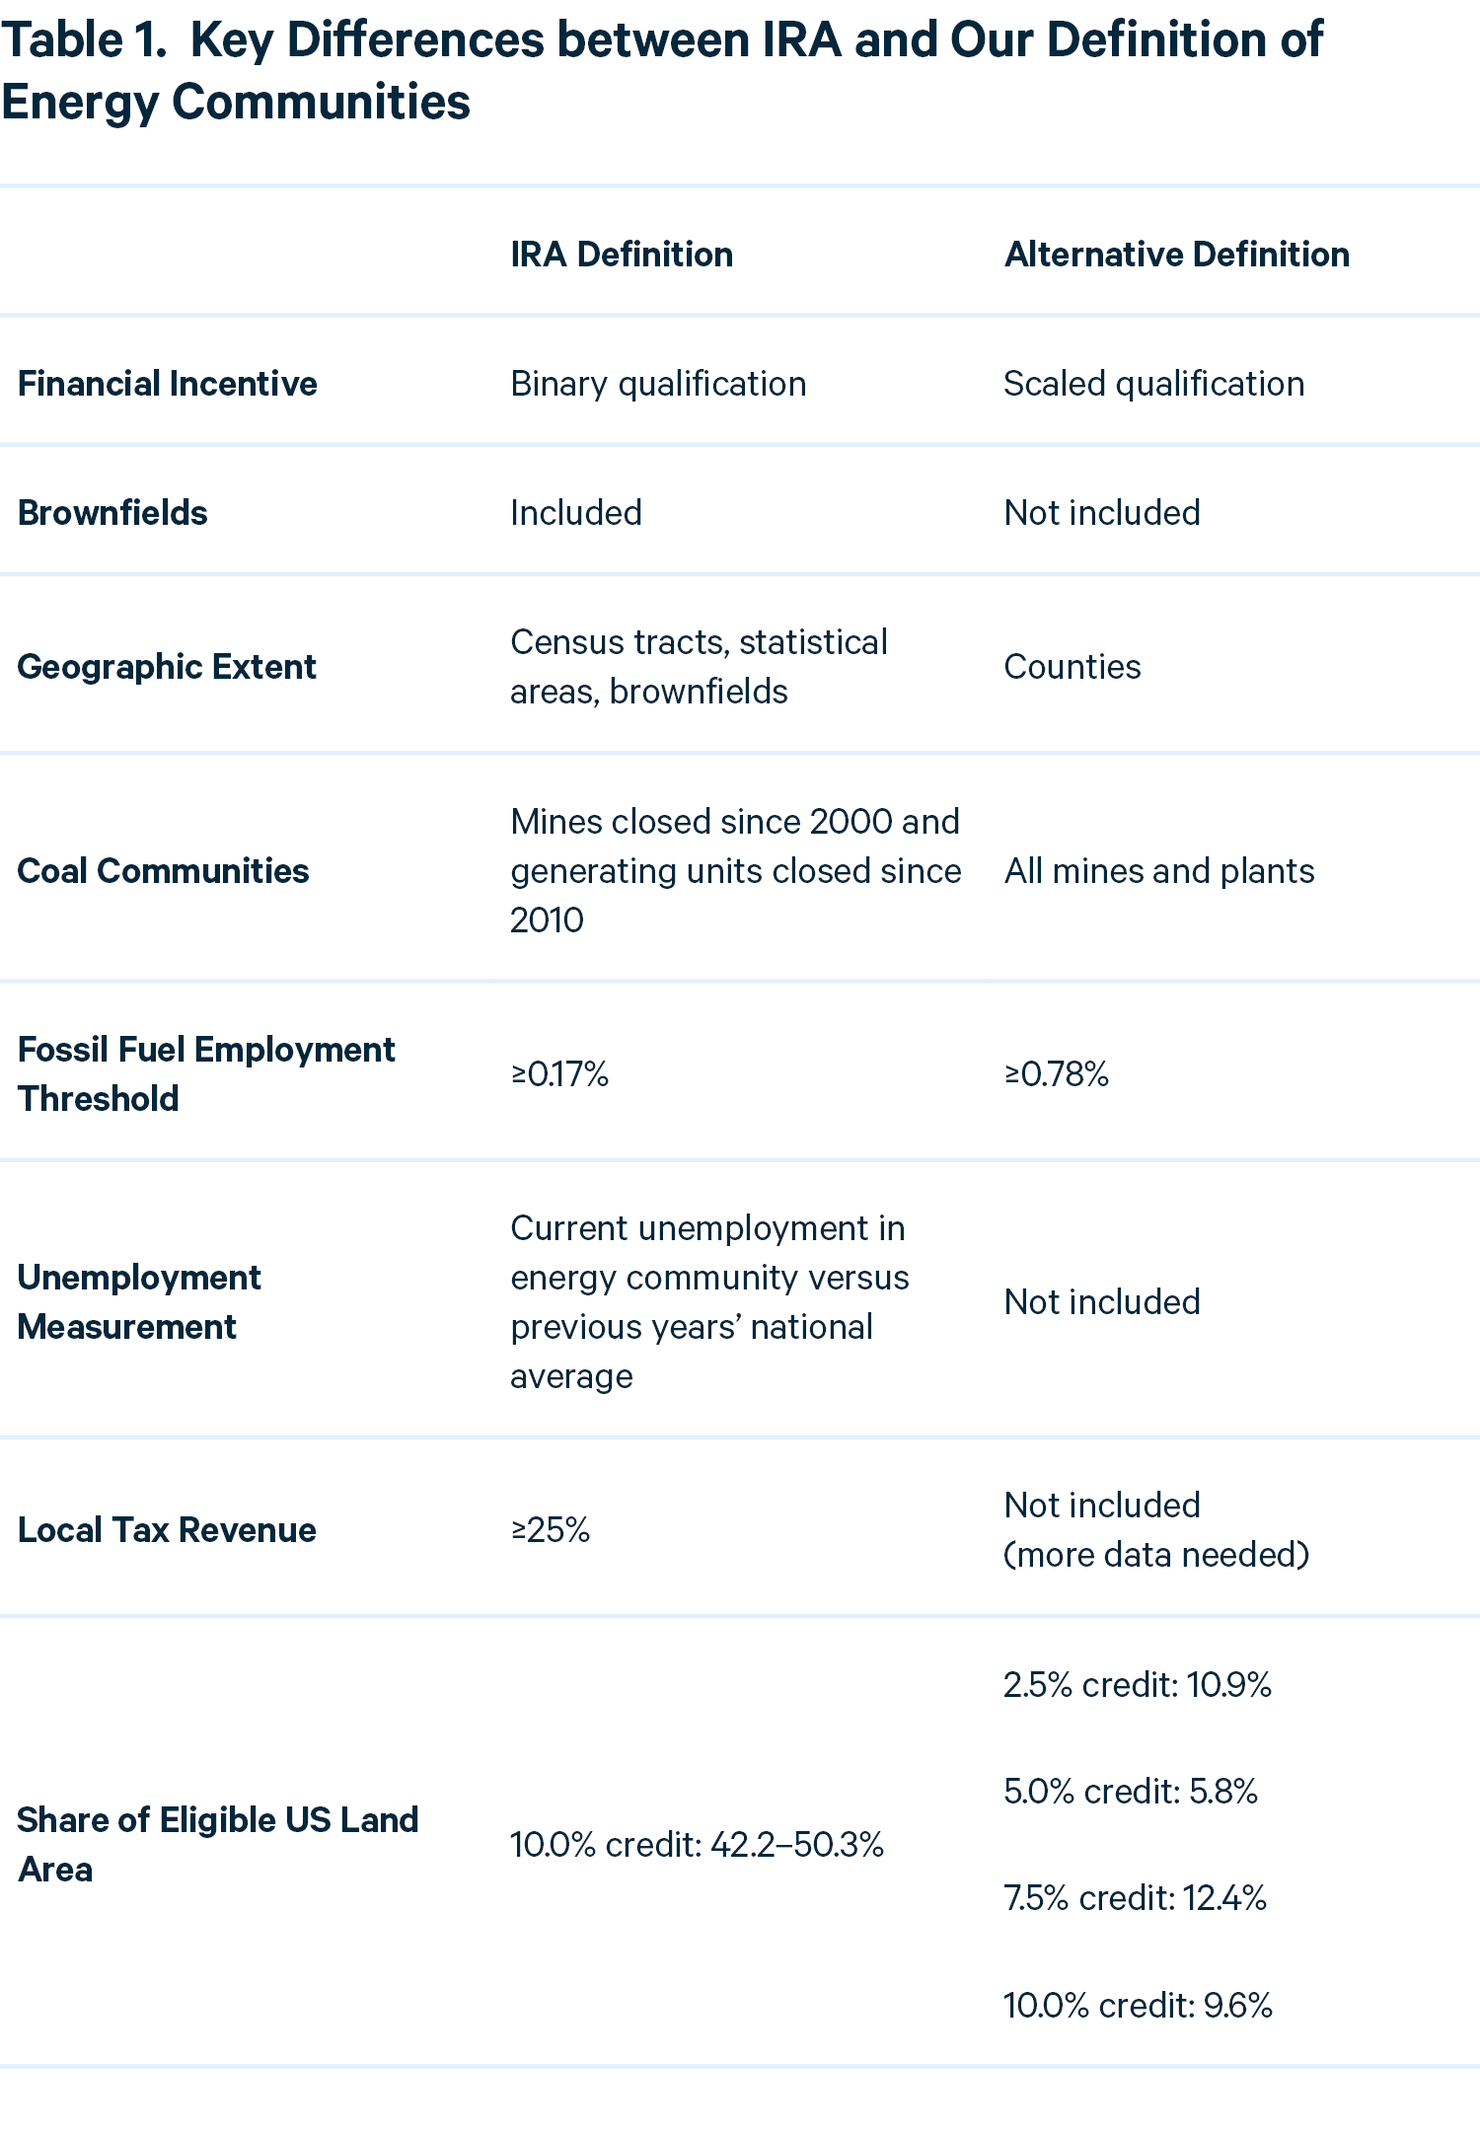
Figure 1. Areas Eligible for 10 Percent Under Central Interpretation of IRA
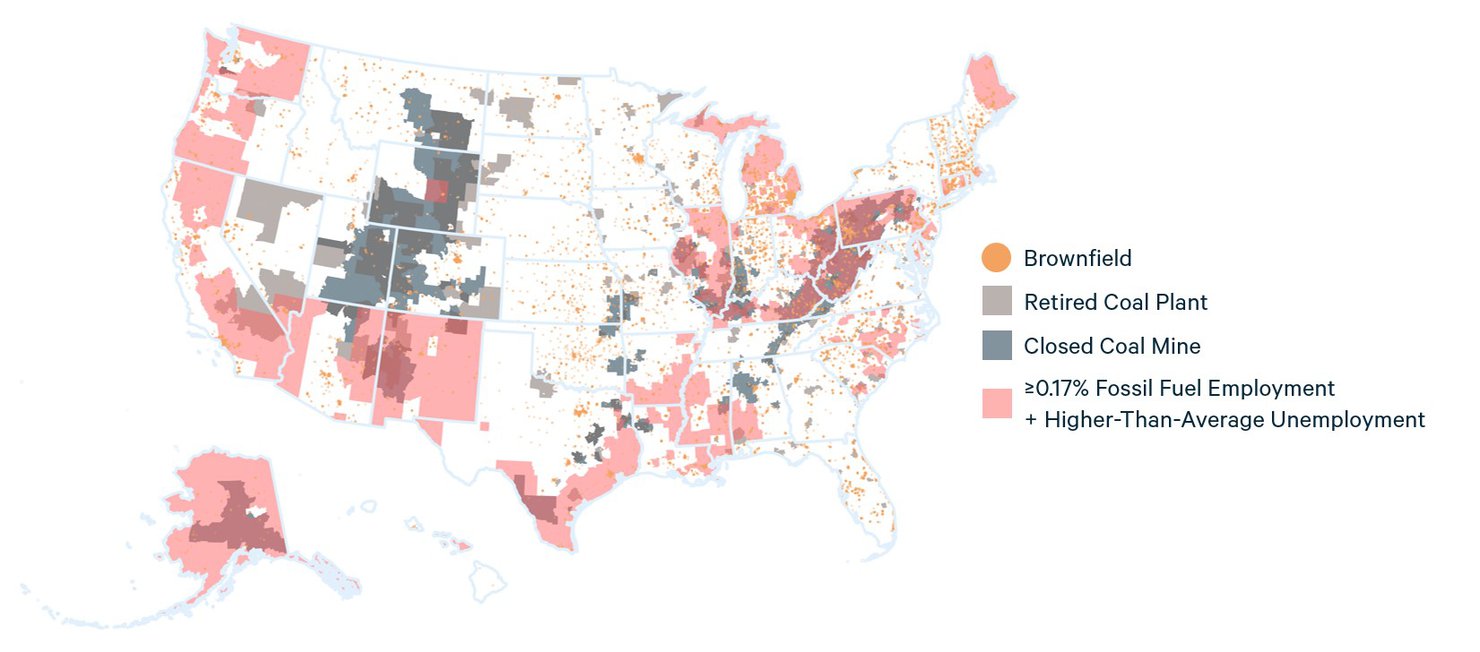
Counties Eligible for Incentives Under Our Definition of Energy Communities
2. The Inflation Reduction Act of 2022
The Inflation Reduction Act of 2022 (IRA) is the most significant federal climate policy enacted in the United States to date (H.R.5376 2022). Its core provisions include expanding and extending tax credits and government-backed loans to spur clean energy innovation, manufacturing, and deployment across a wide range of technologies, including wind, solar, geothermal, nuclear, hydrogen, carbon capture and storage, and electric vehicles.
Early projections of the effects of the IRA show dramatic reductions in greenhouse gas emissions over the next several decades, particularly in the electric power sector (Jenkins et al. 2022; Larsen et al. 2022; Roy et al. 2022). However, numerous uncertainties surround implementation, in part because the law takes the novel approach of tying key financial incentives to domestic content requirements, labor provisions, and the geographic location of project development.
We focus on the IRA provision that allows clean energy projects sited within energy communities to receive tax benefits that would increase a project’s overall incentive by 10 percent. Depending on implementation, it could hasten clean energy deployment and result in billions of dollars of additional investment and federal tax expenditures.
We seek to answer four key questions:
- How does the IRA define an energy community?
- What are the key phrases and metrics embedded in this definition, and what do they imply for the implementation of the IRA?
- How might the Department of Treasury interpret this definition, and what are the implications of alternative definitions for local eligibility?
- To target incentives more narrowly to those areas that could be most adversely affected by the energy transition, how might policymakers redefine an energy community?
We gathered, analyzed, and mapped data from publicly available sources, building on our initial analysis published on September 7, 2022 (Raimi and Pesek 2022). All the data and code we use in this analysis, including geospatial data, are available at the bottom of this page.
3. “Energy Communities” in the IRA
Although the IRA does not explicitly identify the purpose of the energy community provision, the text suggests that it is motivated by the desire to support communities that may be negatively affected by a transition away from fossil fuel extraction, processing, and use at large facilities, such as coal-fired power plants. This concept, sometimes referred to as a “just transition,” seeks to ensure that the people and places that have provided energy (primarily in the form of fossil fuels) for the United States and the world for over a century can thrive in a clean energy future (e.g., Just Transition Centre 2017; Carley and Graff 2020; Just Transition Fund 2020). By providing an additional incentive for clean energy projects to locate within these communities, the IRA encourages new clean energy development to mitigate the negative economic effects of any decline or cessation of fossil fuel activities.
For the additional 10 percent financial incentive, the IRA defines energy communities as
“(i) a brownfield site (as defined in subparagraphs (A), (B), and (D)(ii)(III) of section 101(39) of the Comprehensive Environmental Response, Compensation, and Liability Act of 1980 (42 U.S.C. 9601(39))),
(ii) a metropolitan statistical area or non-metropolitan statistical area which—
(I) has (or, at any time during the period beginning after December 31, 2009, had) 0.17 percent or greater direct employment or 25 percent or greater local tax revenues related to the extraction, processing, transport, or storage of coal, oil, or natural gas (as determined by the Secretary), and
(II) has an unemployment rate at or above the national average unemployment rate for the previous year (as determined by the Secretary), or
(iii) a census tract—
(I) in which—
(aa) after December 31, 1999, a coal mine has closed, or
(bb) after December 31, 2009, a coal-fired electric generating unit has been retired, or
(II) which is directly adjoining to any census tract described in subclause (I).”
To summarize, this text provides for the additional credit in three types of geographies, which we identify for the remainder of this report as (i) brownfields; (ii) high fossil fuel-employment areas; and (iii) coal communities. In the following section, we first provide analysis of (i) and (iii) because their interpretation is relatively straightforward. We then offer multiple options for interpreting (ii), followed by our own definition of an “energy community.”
Our interpretations, estimates, and analysis are based on our best judgments. The US Department of the Treasury is ultimately responsible for interpreting and implementing this provision. Other analysis of the energy communities provision of the IRA is available from Charles River Associates (2022), Princeton’s Net Zero Lab (Isaac, 2022), and Vibrant Clean Energy (2022).
3.1. Brownfields and Coal Communities
3.1.1. Brownfields
Brownfields are sites where future development could be impeded by pollution, such as industrial waste (EPA 2022a). These tend to be relatively small (e.g., one acre or a city block) and may be suitable for small- to medium-sized energy infrastructure, such as community- or utility-scale solar parks, energy storage, or smaller manufacturing facilities.
Based on communication with experts from EPA and elsewhere, no comprehensive list exists of every US brownfield. The most comprehensive database that we have identified is the EPA’s Assessment, Cleanup, and Redevelopment Exchange System (ACRES) database (EPA 2021). This dataset provides geocoded locations for every brownfield that has received EPA grants and completes electronic reporting, and it includes approximately 35,500 sites out of EPA’s estimate of 450,000 US brownfields (EPA 2022a).
Figure 3 shows the locations of all brownfields in the ACRES database. Although it is not comprehensive, it offers a general sense of the distribution. The map represents each site as a single dot (ACRES does not offer more specific geospatial data) and does not represent brownfields’ geographic footprints. For example, the dots cover a large extent of certain states on the map (e.g., Connecticut and Massachusetts) but likely represent a small fraction of land area in those states.
Figure 3. Brownfields Receiving EPA Grants
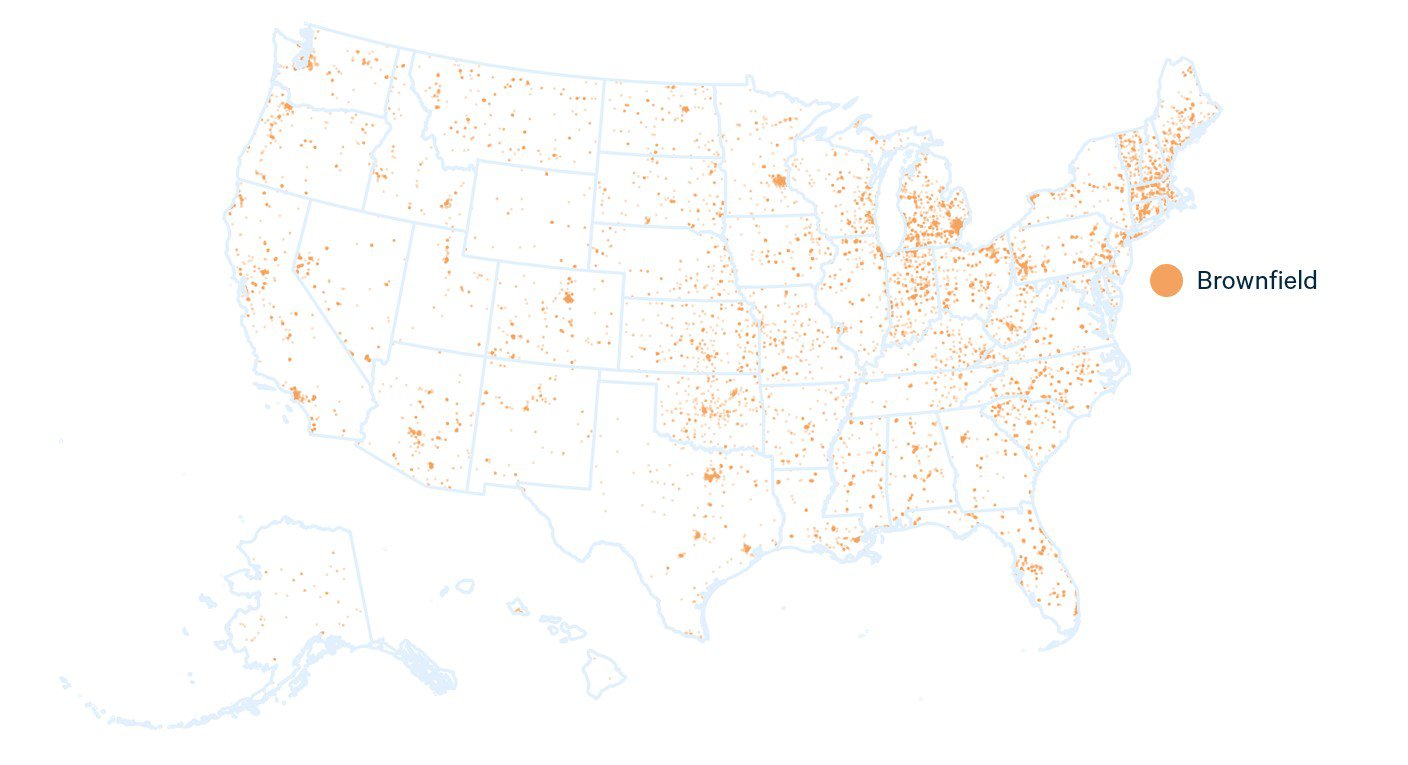
Unlike the other two eligibility criteria in the IRA’s energy communities definition, fossil fuel activities may not have a direct link to brownfields. Although contamination at some sites comes directly from fossil fuel activities, such as coal gasification or petroleum releases, contamination at many other sites is from other sources, such as industrial waste or hazardous chemicals. As a result, the brownfields provision is unlikely to result in new investments specifically targeted toward communities that are or have been heavily dependent on fossil fuels as a local economic driver.
3.1.2. Coal Communities: Coal Mines
Projects sited within any census tract where a coal mine has closed since 2000 are eligible for the bonus credit, along with any adjacent tracts. Census tracts are designed to have a fairly consistent population, roughly 1,200–8,000. This population-focused design means their physical size can vary widely. In urban areas, tracts are typically quite small. However, they may extend over large rural areas, in which they could host large-footprint energy projects, such as wind parks or large manufacturing facilities. In the most recent data (US Census Bureau 2022b), the average tract covers 43 square miles, ranging from a low of 0.006 square miles (tract 125.04, San Francisco County, CA) to a high of 86,814 square miles (tract 2, North Slope Borough, AK).
To assess the census tracts (and adjacent tracts) where coal mines have closed since 2000, we turn to data from the Mine Safety and Health Administration (MSHA 2022b), which provides a database with GPS coordinates for all US operating and closed mines dating back to 1970. We filter this data to the subset of mines coded as coal producers (thereby excluding metal and hard rock mining) and include those mines listed as “Abandoned,” “Abandoned and Sealed,” or “Nonproducing.” Although some “Nonproducing” mines may re-enter production, we randomly spot-checked 10 mine sites and found that most had not produced for 5–10 years. This gives us reasonable confidence that most “Nonproducing” mines will not re-enter production at a future date. We exclude mines listed as “Intermittent” or “Temporarily Idled” because these labels indicate a higher likelihood that they could resume production.
After noticing anomalies in the MSHA geolocation data, we carried out several quality assurance checks to improve accuracy. First, we trimmed the dataset to only mines whose coordinates fell within the geographic boundaries of the state they were assigned in the MSHA data table. Next, we used state and county codes provided in the MSHA data table to identify the counties of the 300 mines where geolocation data were clearly incorrect (i.e., placed them outside of the state listed in the MSHA data). Next, we used the MSHA data to identify the counties with these incorrectly geolocated mines and compared them with the census tracts that contained closed mines and had apparently accurate geolocation data. Using this process, we identified counties containing closed mines that would not otherwise be eligible to receive the tax credit. To identify the census tracts of these mines, we use Mine ID codes from the MSHA mine database to manually look up each mine’s address, then entered the corresponding latitude and longitude coordinates, obtained through Google Maps. We identified eight mines in census tracts that would not otherwise qualify.
Next, we joined mine locations with census tracts published in 2020, the most recent available year (US Census Bureau 2022b). The resulting map (Figure 4) illustrates our estimate for census tracts that will be eligible for the bonus tax credit due to closed coal mines.
Figure 4. Coal Mines Closed Since 2000
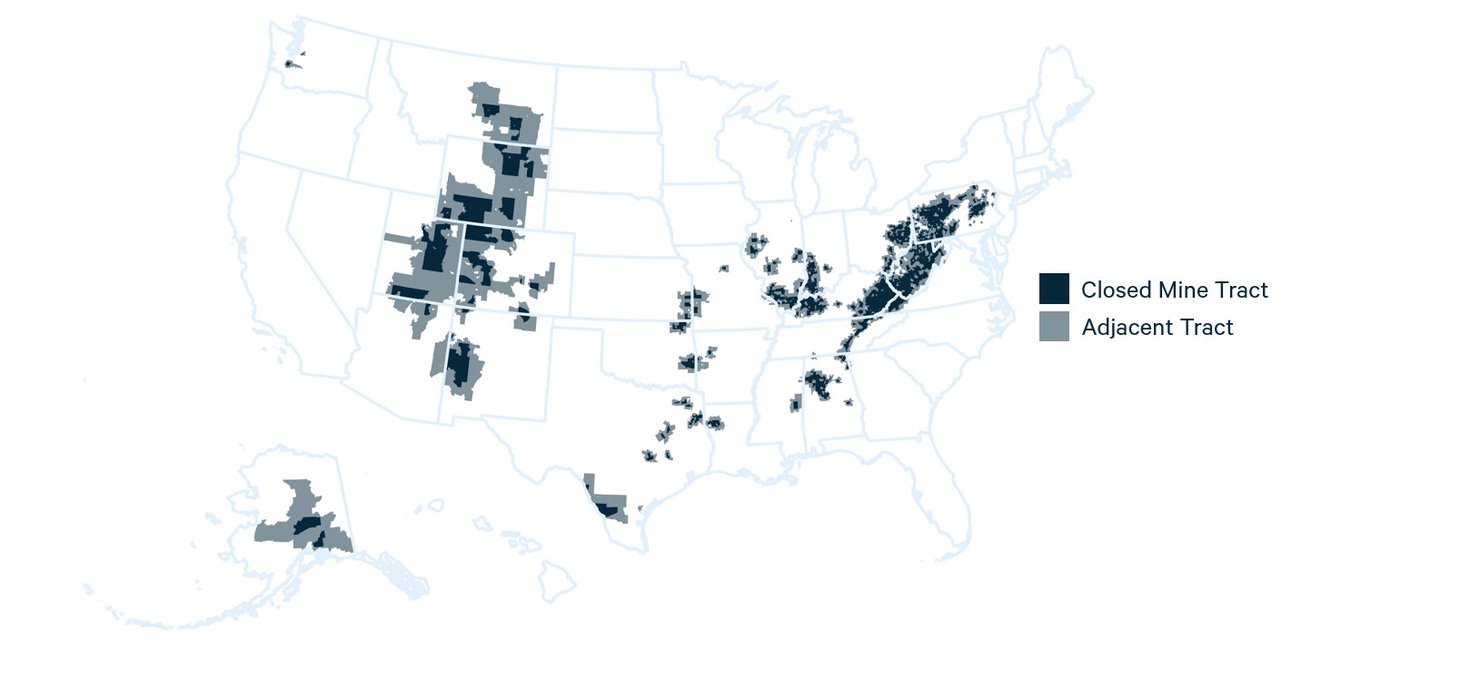
Our analysis suggests that 14.6 percent of land area representing 2.8 percent of the US population will be eligible for the bonus tax credit from this provision under the IRA. This includes the majority of land in Pennsylvania, Utah, West Virginia, and Wyoming, along with large swathes of Alaska, Colorado, Kentucky, Montana, New Mexico, and Ohio. If US coal production continues to decline, which post-IRA projections suggest it will (Jenkins et al. 2022; Larsen et al. 2022; Roy et al. 2022), more coal mines will close and eligibility will expand. However, most US coal mining today occurs in and around areas where mines have previously closed, suggesting that the geographic coverage of IRA eligibility under this provision is unlikely to dramatically grow.
3.1.3. Coal Communities: Coal-Fired Power Generators
We next add census tracts (and adjacent tracts) where coal-fired power generating units have retired since 2010 using the most recent available data from the US Energy Information Administration (EIA 2022). The text of the IRA specifies retired “generating units,” which is distinct from a coal-fired power plant. Most coal-fired (and other) plants include more than one generating unit, such as a boiler, and those units may retire at different times. As a result, the IRA’s definition includes plants where any coal-fired generating unit has retired, regardless of whether the plant remains in service.
Our analysis suggests that 7.0 percent of US land area representing 2.0 percent of the US population will be eligible for the bonus tax credit. As noted in Section 3.1.2, projections indicate that US coal consumption is likely to continue its decline, and 130 coal-fired power plants have already announced retirement dates. If we include those plants, the provision would cover 10.0 percent of land area and 2.3 percent of population. Figure 5 illustrates those census tracts (and adjacent tracts) where coal-fired generating units have retired since 2010 (in grey) or retirements have been announced (in purple).
Figure 5. Coal-Fired Electric Generating Units Retired Since 2010
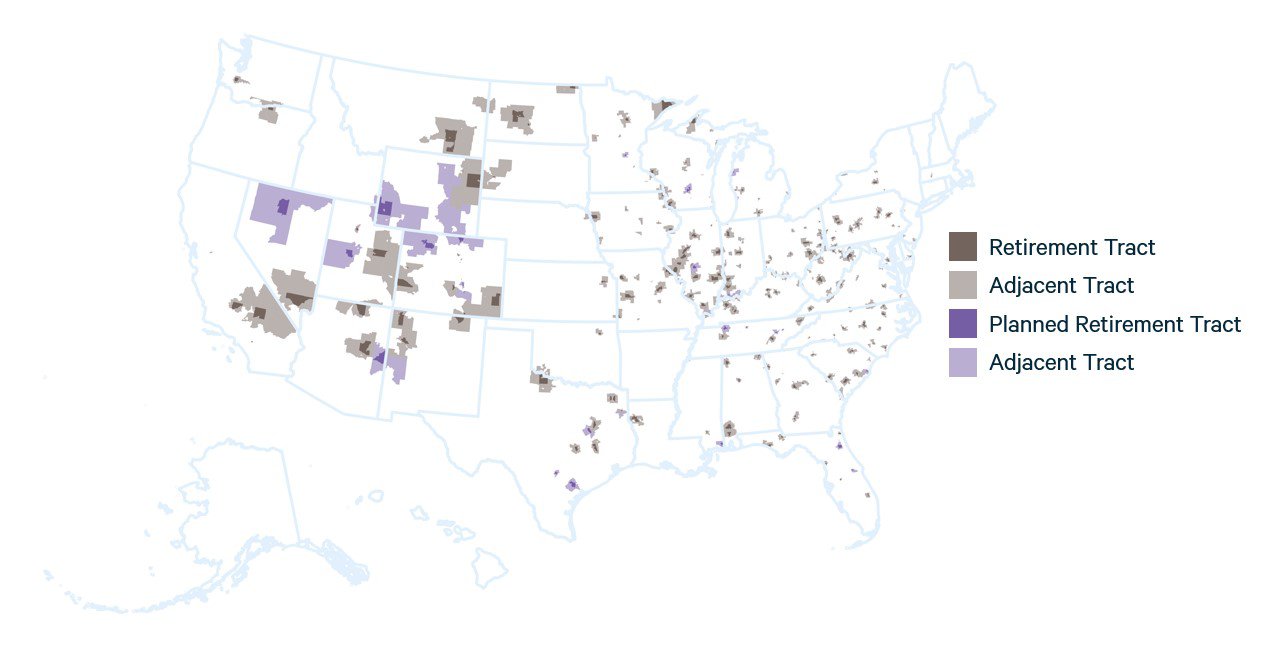
As Figure 5 illustrates, closed coal-fired generating units are distributed widely across the country, including densely populated regions where census tracts are geographically small. The states with the largest geographic coverage under this provision include Colorado, Nevada, Utah, and Wyoming, along with certain parts of Arizona, California, Illinois, New Mexico, and Appalachia.
In addition to the retired and planning-to-retire generators in Figure 5, 402 coal-fired power plants are operating without planned retirement dates according to EIA data. These plants are distributed across the US, with the largest volumes of generating capacity found in Texas (11.8 GW), West Virginia (11.7 GW), Indiana (11.0 GW), Pennsylvania (10.6 GW), Kentucky (9.8 GW), and North Carolina (8.2 GW) (EIA, 2022). The largest number of operating plants are in Indiana (29), Pennsylvania (23), Kentucky (22), Iowa (22), and Ohio (19).
3.2. Fossil Fuel Employment: Three Interpretations of the IRA
We now turn to the most complex portion of the IRA definition of energy communities: high fossil fuel–employment areas. In this provision, the law refers to a “metropolitan statistical area or non-metropolitan statistical area” (MSAs and non-MSAs). These areas, which are defined by the federal Office of Management and Budget (2021), range from 157 square miles (MSA code 16180, Carson City, Nevada) to 138,435 square miles (MSA code 0200006, Alaska non-MSA), which is roughly the size of Germany. In rural regions, including major energy-producing regions in Alaska, Texas, North Dakota, and Wyoming, a single non-MSA covers large portions of the state.
To assess which MSAs and non-MSAs will be eligible, we must answer three critical questions: (1) how to measure “direct employment…related to the extraction, processing, transport, or storage of coal, oil, or natural gas”; (2) how to measure “local tax revenues related to the extraction, processing, transport, or storage of coal, oil, or natural gas”; and (3) how to interpret “has an unemployment rate at or above the national average unemployment rate for the previous year.”
For question (1), the key issues are which data source to use and which categories of employment to include. For data sources, options include the Bureau of Labor Statistics’ (BLS) Occupational Employment and Wage Statistics (OEWS); the BLS’ Quarterly Census of Employment and Wages (QCEW); and the US Census Bureau’s County Business Patterns (CBP). In the alternative interpretations that follow (Sections 3.2.1, 3.2.2, and 3.2.3), we use the OEWS and the CBP data, and we use the CBP in our central interpretation. Our alternative interpretations also offer multiple options for which categories of employment to include within each data source.
For question (2), the answer is simple: it is not currently possible to measure how much tax revenue local governments collect from fossil fuel extraction, processing, transportation, and storage. As we showed in Raimi et al. (2022b), fossil fuels generate billions of dollars annually for local governments. However, local governments do not systematically collect or aggregate data on revenues directly related to fossil fuel activities. In some cases, localities or states publish information on property tax or severance tax revenues for local governments associated with coal, oil, and natural gas production property, but none publish comprehensive data that would cover all activities implied by the IRA, such as fossil fuel processing (e.g., refining), transport (e.g., pipeline transportation or coal-by-rail), and storage (e.g., petroleum product storage).
For question (3), the key issues are determining the appropriate time periods to measure the current unemployment rate (“has an unemployment rate”) and the “national unemployment rate for the previous year.” Perhaps the simplest interpretation is to compare the most recent monthly unemployment rate in a given MSA or non-MSA with the national average rate from the previous calendar year. However, such an approach would lead to considerable volatility in eligibility. For example, a statistical area where the monthly unemployment rate hovers at or near the national average from the previous year could find itself in a “seesaw,” rocking back and forth each month between eligibility and noneligibility.
In addition, rapid national swings in unemployment rates would lead large swathes of the country to become eligible or ineligible in unpredictable ways. For example, the national average rate in 2019 was 3.7 percent (BLS 2022). In April 2020, as COVID-19 “lockdowns” dramatically suppressed economic activity, 92.7 percent of statistical areas exceeded that average 2019 unemployment rate. In December 2021, as the economy continued to recover from the pandemic, just 6.6 percent of statistical areas had lower unemployment rates than the national average in calendar year 2020 (8.1 percent), which would render most US land area ineligible for the bonus tax credit.
To address this risk of volatility, which could create major uncertainty for communities and investors, we interpret the current unemployment rate in each statistical area as the rolling six-month average from the most recent six months. We interpret “national unemployment rate for the previous year” as the rolling 12-month average. This interpretation smooths but does not eliminate the volatility. A key question that the Department of Treasury will need to answer, which will heavily affect the level of volatility, is how long an “energy community” retains eligibility once designated.
3.2.1. Interpretation One: IWG Approach
Our first interpretation follows the approach taken by the federal Interagency Working Group on Coal and Power Plant Communities and Economic Revitalization (IWG), which characterizes fossil fuel employment using data from the BLS’ OEWS. This data series, which is produced annually and covers nearly 800 occupations, provides data at the national, state, and MSA/non-MSA level.
Table 2 lists the OEWS codes used by the IWG in its initial report to the president on energy communities (IWG 2021). We also show the share of total US employment that each code represents based on data from May 2021, the most recent available year (BLS 2021). The IWG codes represent 0.34 percent of total US employment in 2021, twice the level specified in the IRA.
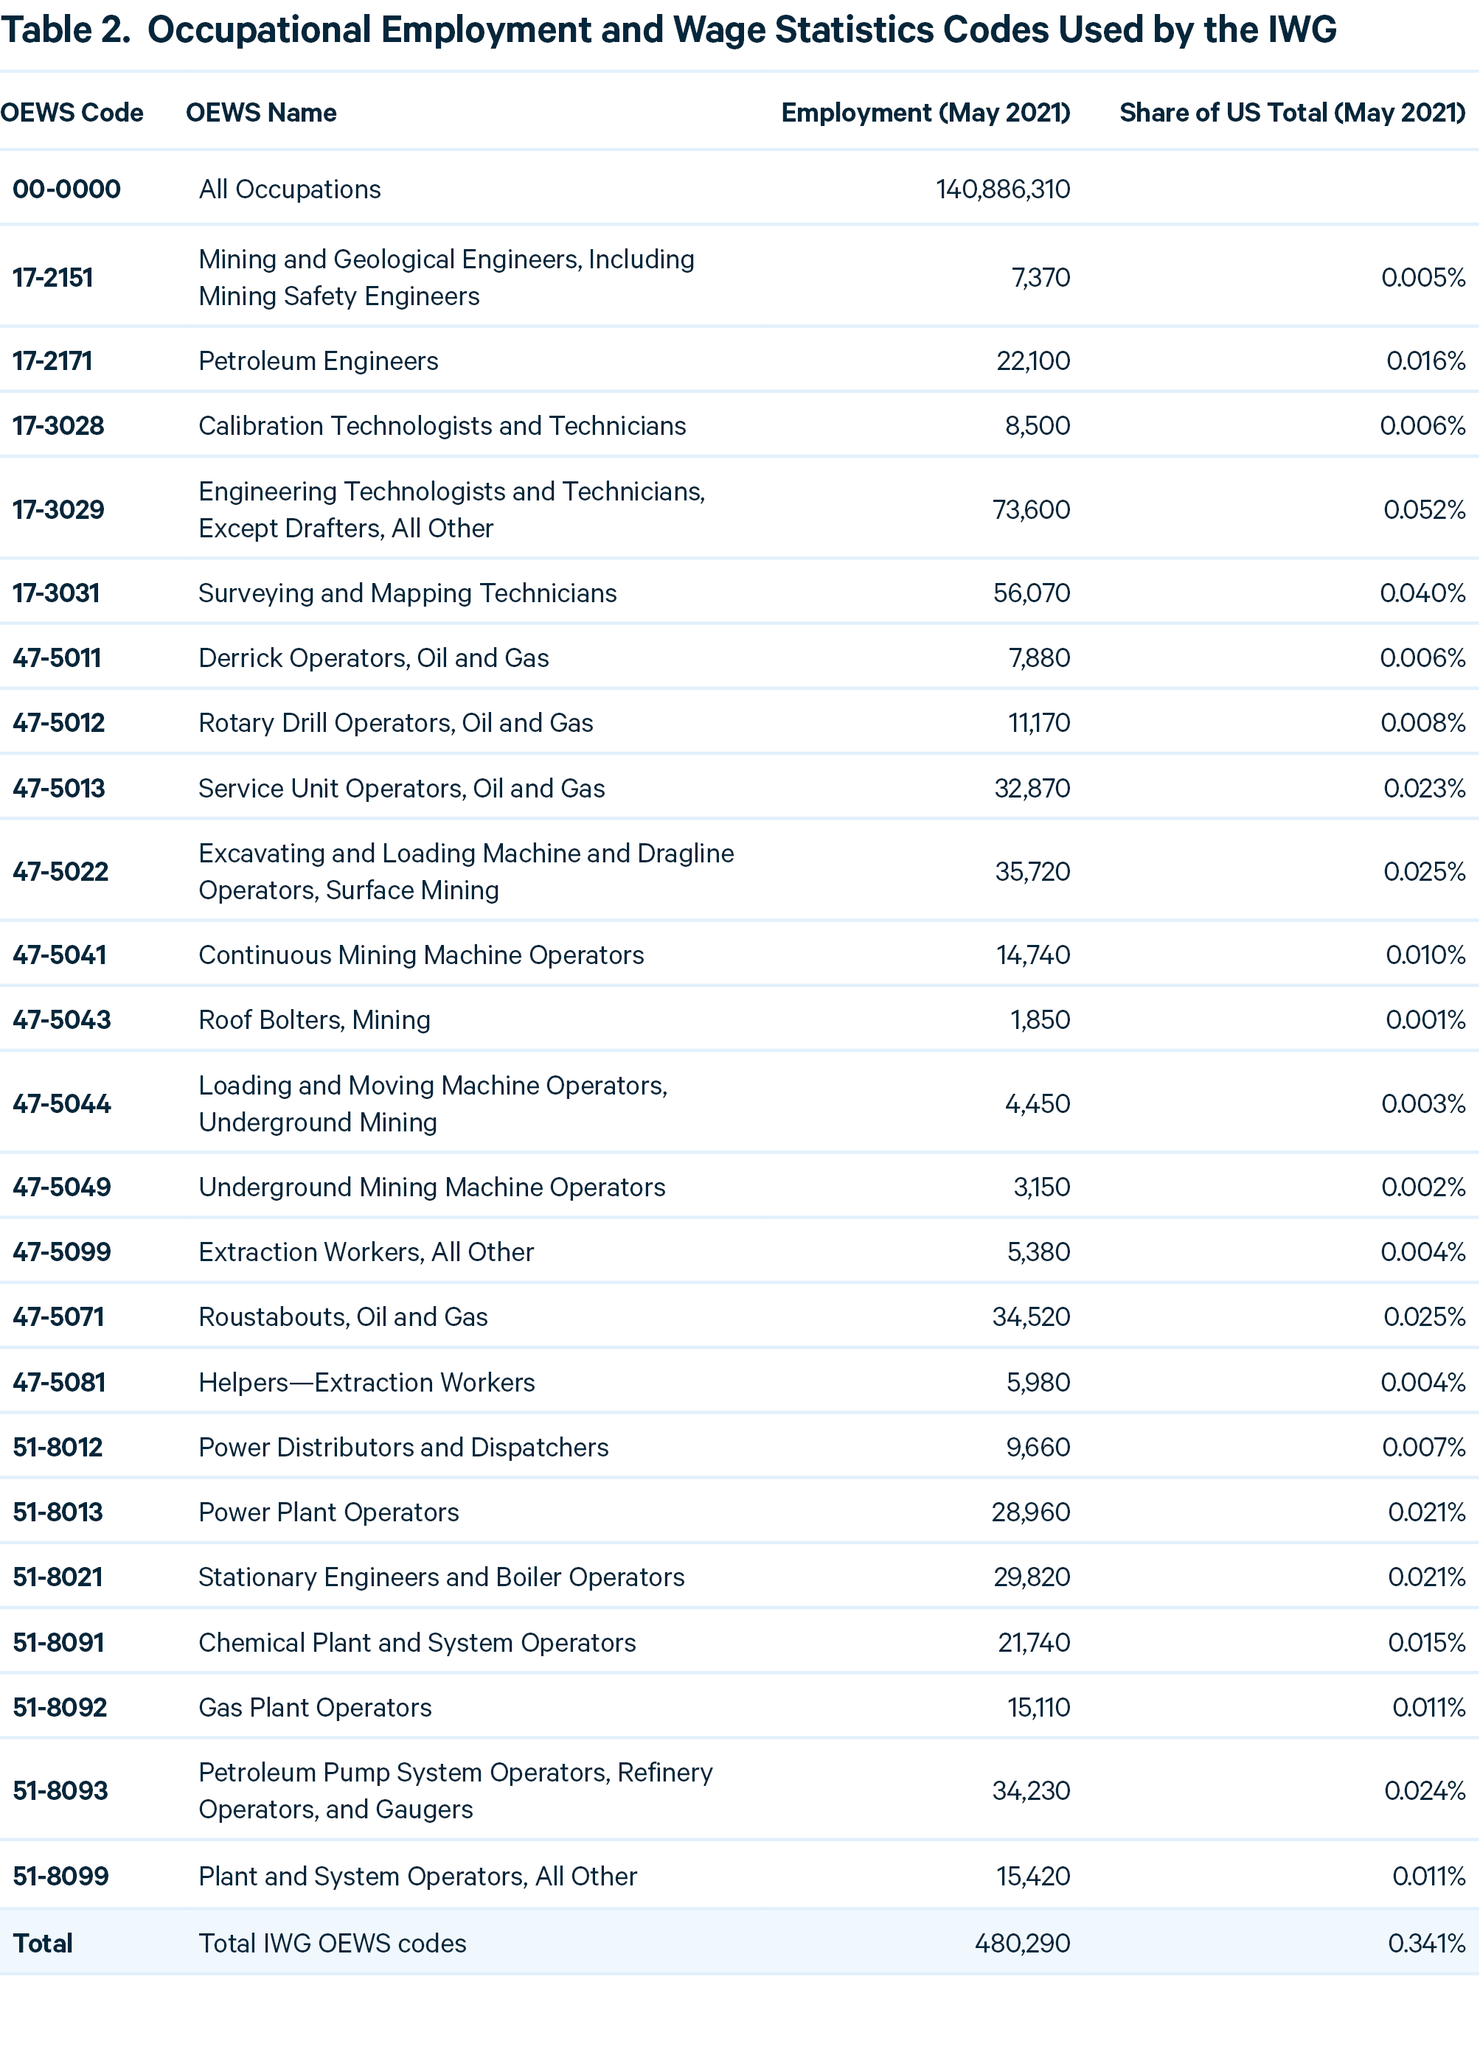
It is not clear how Congress identified 0.17 percent as the appropriate eligibility threshold, but it is surprising that an energy community would be defined as having less than the national average in the relevant categories. We believe that two factors may have contributed to this result.
First, analysts may have aggregated local economic data to the national level to identify the appropriate threshold. This approach would create a threshold that was lower than the true national average because local data are often suppressed to protect confidential business information, a common practice in federal data on local employment and wages (e.g., Bartik et al. 2018). For example, in the May 2021 OEWS data series, “Service Unit Operators, Oil and Gas” (Code 47-5013) in the west Texas nonmetropolitan area (Area 4800001) is suppressed. Because west Texas is home to the Permian basin, the largest oil- and gas-producing region of the United States, suppressed data are unlikely to be near zero. When using localized data from the OEWS, interpreting suppressed data as “zero” would lead to a systematic undercounting of fossil fuel employment at national scale.
A second factor that leads to this relatively low threshold is the choice of OEWS codes. Unlike the QECW or CBP data series, which classify workers based on the industries they work in, OEWS codes classify employment by the activities a worker carries out. For example, one of the most common occupations in oil and gas extraction is truck driving. Although OEWS includes a code for truck drivers (53-3032), it does not provide a direct estimate of the number of truck drivers who work in oil and gas extraction. This exclusion, and others like it, leads to lower estimates of fossil fuel employment than would be found using a data series that classifies employment by industry, as the CPB and QCEW do.
Setting aside the potential issues associated with the OEWS data, applying the codes listed in Table 2 to all MSAs and non-MSAs results in 67.0 percent of US land area exceeding the 0.17 percent threshold. When we apply the provision that eligible MSAs/non-MSAs must have above average unemployment compared with the previous year (see Section 3.2) using the most recent available unemployment data, this shrinks to 31.4 percent of land area (Figure 6).
Figure 6. Eligibility of Statistical Areas Under the IWG Approach
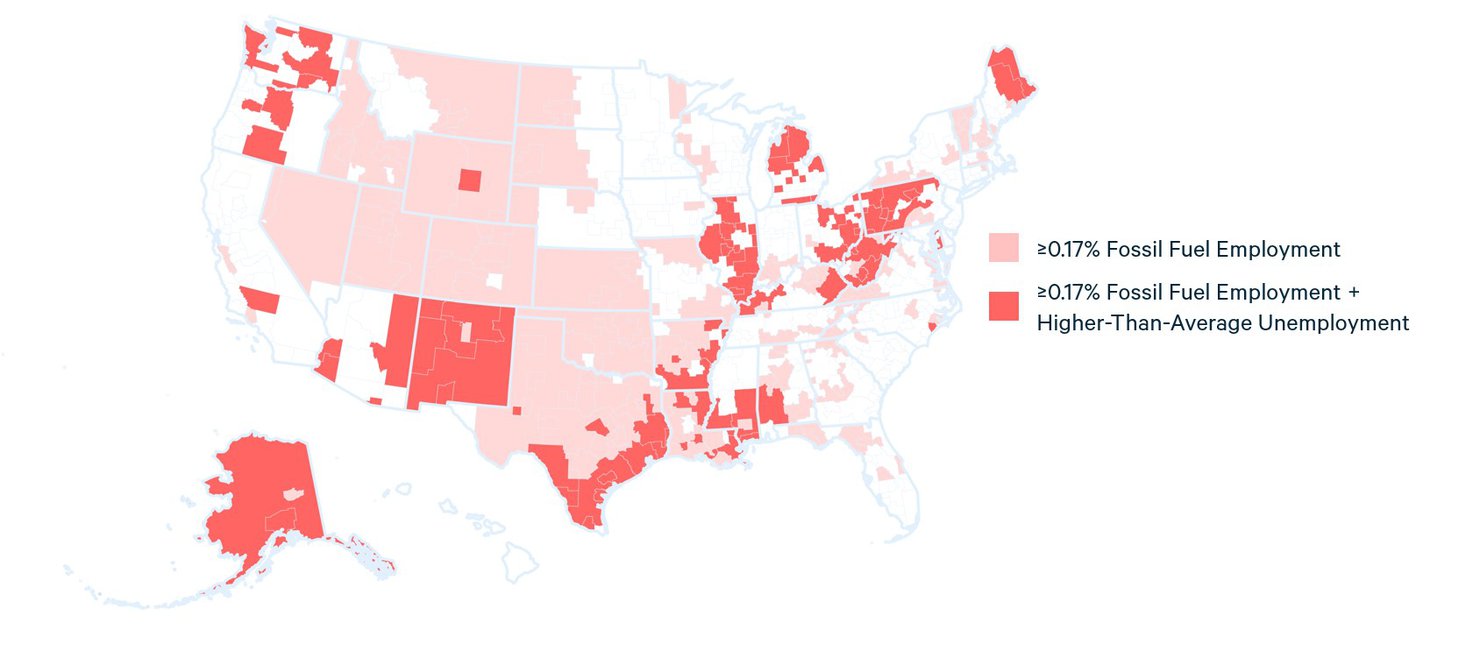
The geographic distribution of eligibility under this interpretation includes some regions that are highly dependent on fossil fuels (e.g., Alaska, New Mexico, Texas’ Gulf Coast, and West Virginia) and others that are not (e.g., large portions of Illinois, Maine, Michigan, Oregon, and Washington State). Because of the unemployment clause, it also excludes most or all of Colorado, Louisiana, North Dakota, Oklahoma, Utah, west Texas, and Wyoming, which have some of the highest levels of US dependence on fossil fuels for employment and tax revenue (Raimi et al. 2022a, 2022b).
3.2.2. Interpretation Two: Central Approach
Our central interpretation of the IRA uses data from the Census’ CBP, which classifies employment according to the North American Industrial Classification System (NAICS). The CBP is published annually and based on data from the Business Register, a database maintained by the Census that includes all known US employers. Compared with other local economic data products, such as the OEWS or QECW, the CBP has little data suppression because the Census uses a “noise infusion” method that randomly adjusts certain data points to avoid disclosing confidential business information (US Census 2022c). Although this methodology may slightly alter the true estimates of employment in a given location and sector, we believe that the randomness of the alterations is less problematic than wholesale data suppression, which introduces nonrandom data concerns and will systematically undercount the rural regions where most fossil fuel activities occur.
Following the text of the IRA, we choose seven NAICS codes to represent employment in “extraction, processing, transport, or storage of coal, oil, or natural gas.” Table 3 shows those codes, their descriptions, and their employment levels in the 2022 CBP. We considered several other NAICS codes but choose to present a relatively narrow interpretation here. Section 3.2.3 offers a more expansive interpretation with additional NAICS codes.
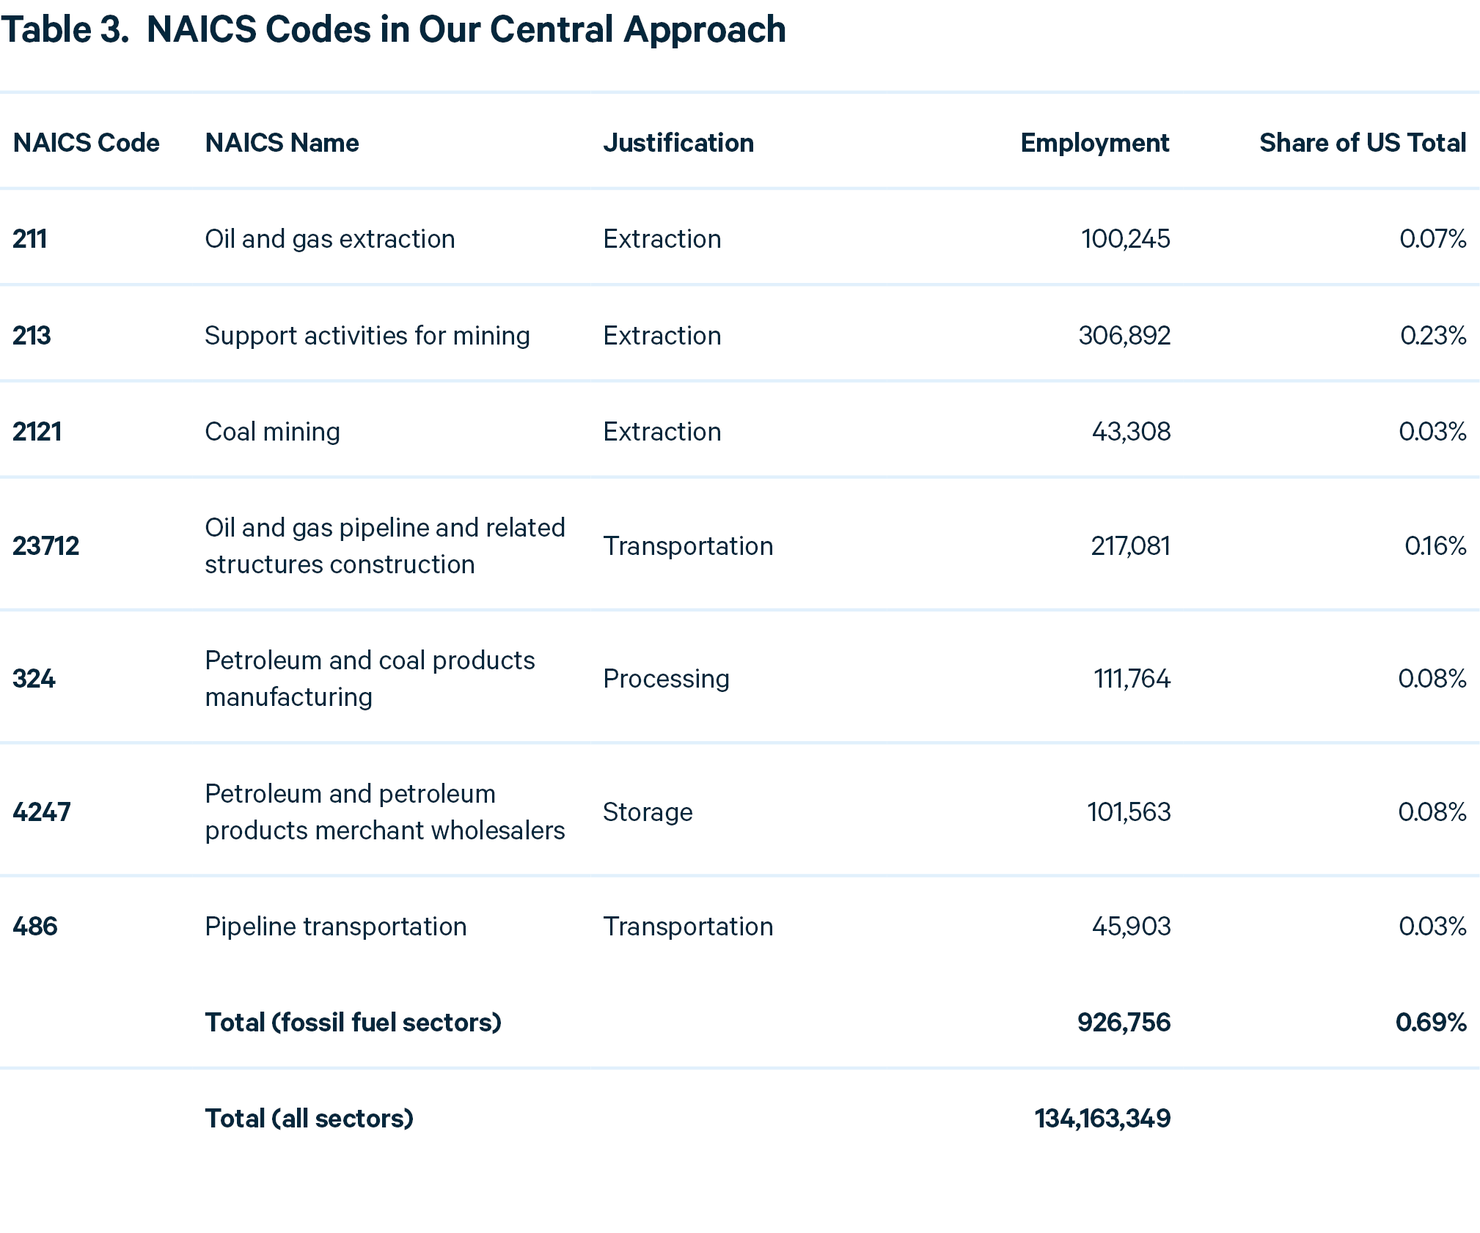
Because of data suppression concerns, we use higher-level (three- or four-digit) NAICS codes wherever possible. However, we acknowledge that this approach will lead to a small amount of overcounting in two of the seven codes. The first, NAICS 213 (Support activities for mining), includes jobs that support non-fossil-fuel mining, such as metals and hard rock mining. If comprehensive (i.e., nonsuppressed) data were available, we would instead use three higher-level (six-digit) NAICS codes: 213111 (Drilling oil and gas wells), 213112 (Support activities for oil and gas operations), and 213113 (Support activities for coal mining). However, in 2020, 98.1 percent of national employment in NAICS 213 came from the three fossil fuel–related codes (213111, 213112, and 213113).
The second higher-level code that could lead to some overcounting is NAICS 486 (Pipeline transportation). It incorporates four six-digit NAICS codes: 486110 (Pipeline transportation of crude oil), 486210 (Pipeline transportation of natural gas), 486910 (Pipeline transportation of refined petroleum products), and 486990 (All other pipeline transportation). It could include some non-fossil-fuel pipeline transportation, such as carbon dioxide (CO2) or hydrogen. Transportation of these products is often associated with fossil fuel activities, such as CO2 pipeline networks that support enhanced oil recovery and hydrogen pipelines that move hydrogen at and around oil refineries and petrochemical manufacturing facilities. Nonetheless, any overcounting due to the use of this higher-level code is very small. In 2020, 99.2 percent of national employment in NAICS 486 came from the three codes noted that are unequivocally fossil fuel–related (486110, 486210, and 486910).
One limitation of the CBP data is that they exclude certain sectors of the economy, including the self-employed, agricultural production workers, and most government employees. To assess whether this limitation would qualitatively affect our estimates of the share of employment in each sector, we examined alternative estimates from the BLS. The CPB 2020 national estimate of 134.2 million employees was 3.6 percent lower than estimates from the BLS’ OEWS and QCEW 2020 estimate (both 139.1 million). If we were to use the BLS estimate, the total fossil sector employment share listed in Table 3 would change to 0.67 percent. Because of this small difference, and for consistency, we continue to use CPB data throughout this analysis.
Applying employment data from these NAICS codes along with the provision that eligible MSAs and non-MSAs have above average unemployment compared with the previous year (see Section 3.2) using the most recent available unemployment data, we estimate that 37.9 percent of US land area would be eligible for the bonus tax credit (Figure 7).
Figure 7. Eligibility of Statistical Areas Under Our Central Approach
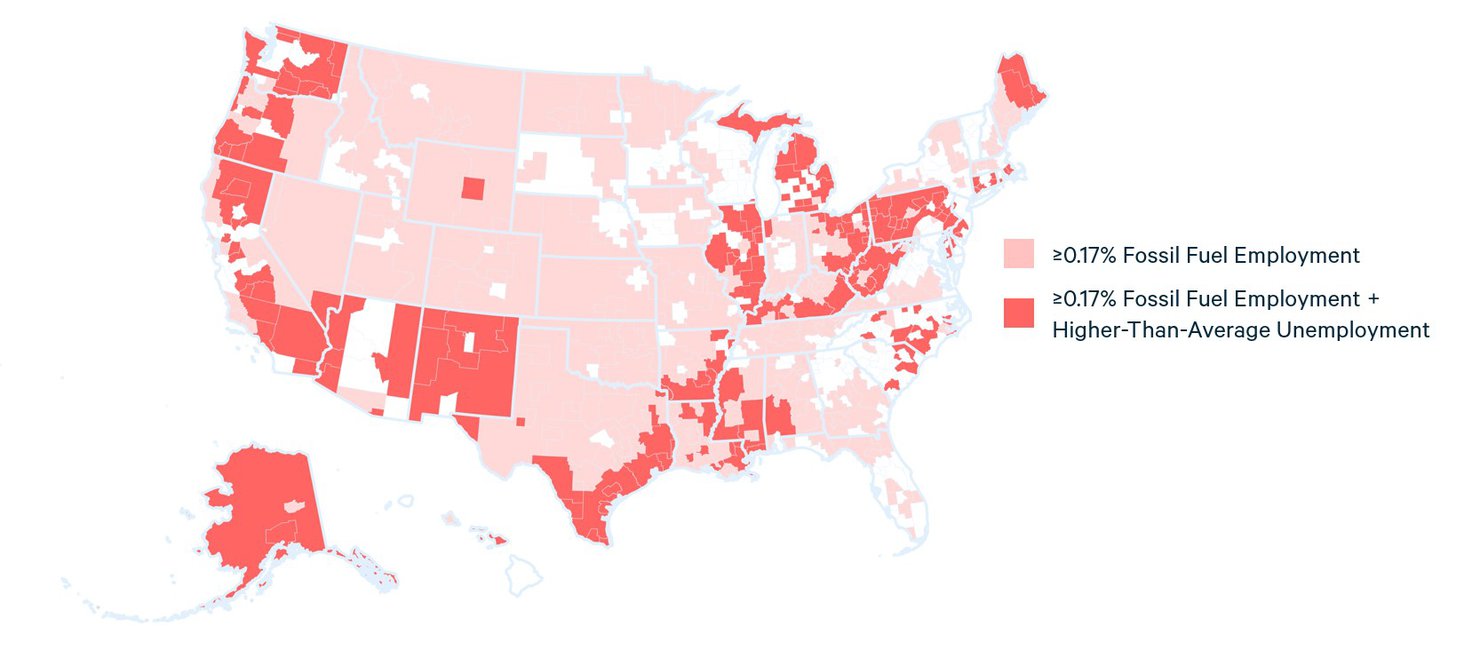
Similar to the results from Section 3.2.1, this interpretation includes some regions with high dependence on fossil fuels (e.g., Alaska, Appalachia, New Mexico, and Texas’ Gulf Coast). Because it uses data from the CPB, which we believe more comprehensively cover fossil fuel–related employment, its coverage of regions with low dependence (e.g., large swathes of Arizona, California, Illinois, Maine, Michigan, Mississippi, Oregon, and Washington State) are even greater than those seen in Section 3.2.1. Because of the unemployment clause, this definition also excludes large parts of fossil fuel–dependent states, such as Colorado, Louisiana, Montana, North Dakota, Oklahoma, west Texas, Utah, and Wyoming.
3.2.3. Interpretation Three: Expansive Approach
Because the language in the IRA does not specify the specific NAICS (or OEWS) codes to use when defining employment in “extraction, processing, transport, or storage of coal, oil, or natural gas,” one could plausibly add industries that are not included in Section 3.2.2. In this section, we add six additional codes to those in our central approach:
- Fossil fuel electric power generation (NAICS 221112). Coal, petroleum, and some natural gas–fired power stations store large volumes of fuel on site, which could make them eligible based on the word “storage.”
- Natural gas distribution (NAICS 221210) systems transport natural gas underneath most US cities. It could be eligible under “transport.”
- Chemical manufacturing (NAICS 325) largely consists of the transformation of hydrocarbons into useful products, such as plastics, fertilizers, and medicines. It could be eligible under “processing.” More detailed codes, such as 325110 (Petrochemical manufacturing), may also be appropriate if policymakers were concerned about overincluding sectors with less direct connection to fossil fuels.
- Metal Tank (Heavy Gauge) Manufacturing (NAICS 332420) includes the construction of large storage tanks used at oil and natural gas extraction, processing, and storage facilities. It could be eligible under “storage.”
- Mining and Oil and Gas Field Machinery Manufacturing (NAICS 33313) primarily consists of machinery used in extracting coal, oil, and natural gas. It could be eligible under “extraction.”
- Fuel dealers (NAICS 454310) store large volumes of fuel, such as gasoline, diesel, or propane, on site. It could be eligible under “storage.”
Table 4 lists all the NAICS codes in this approach, along with their estimated employment in the most recent CBP publication (US Census Bureau 2022a).
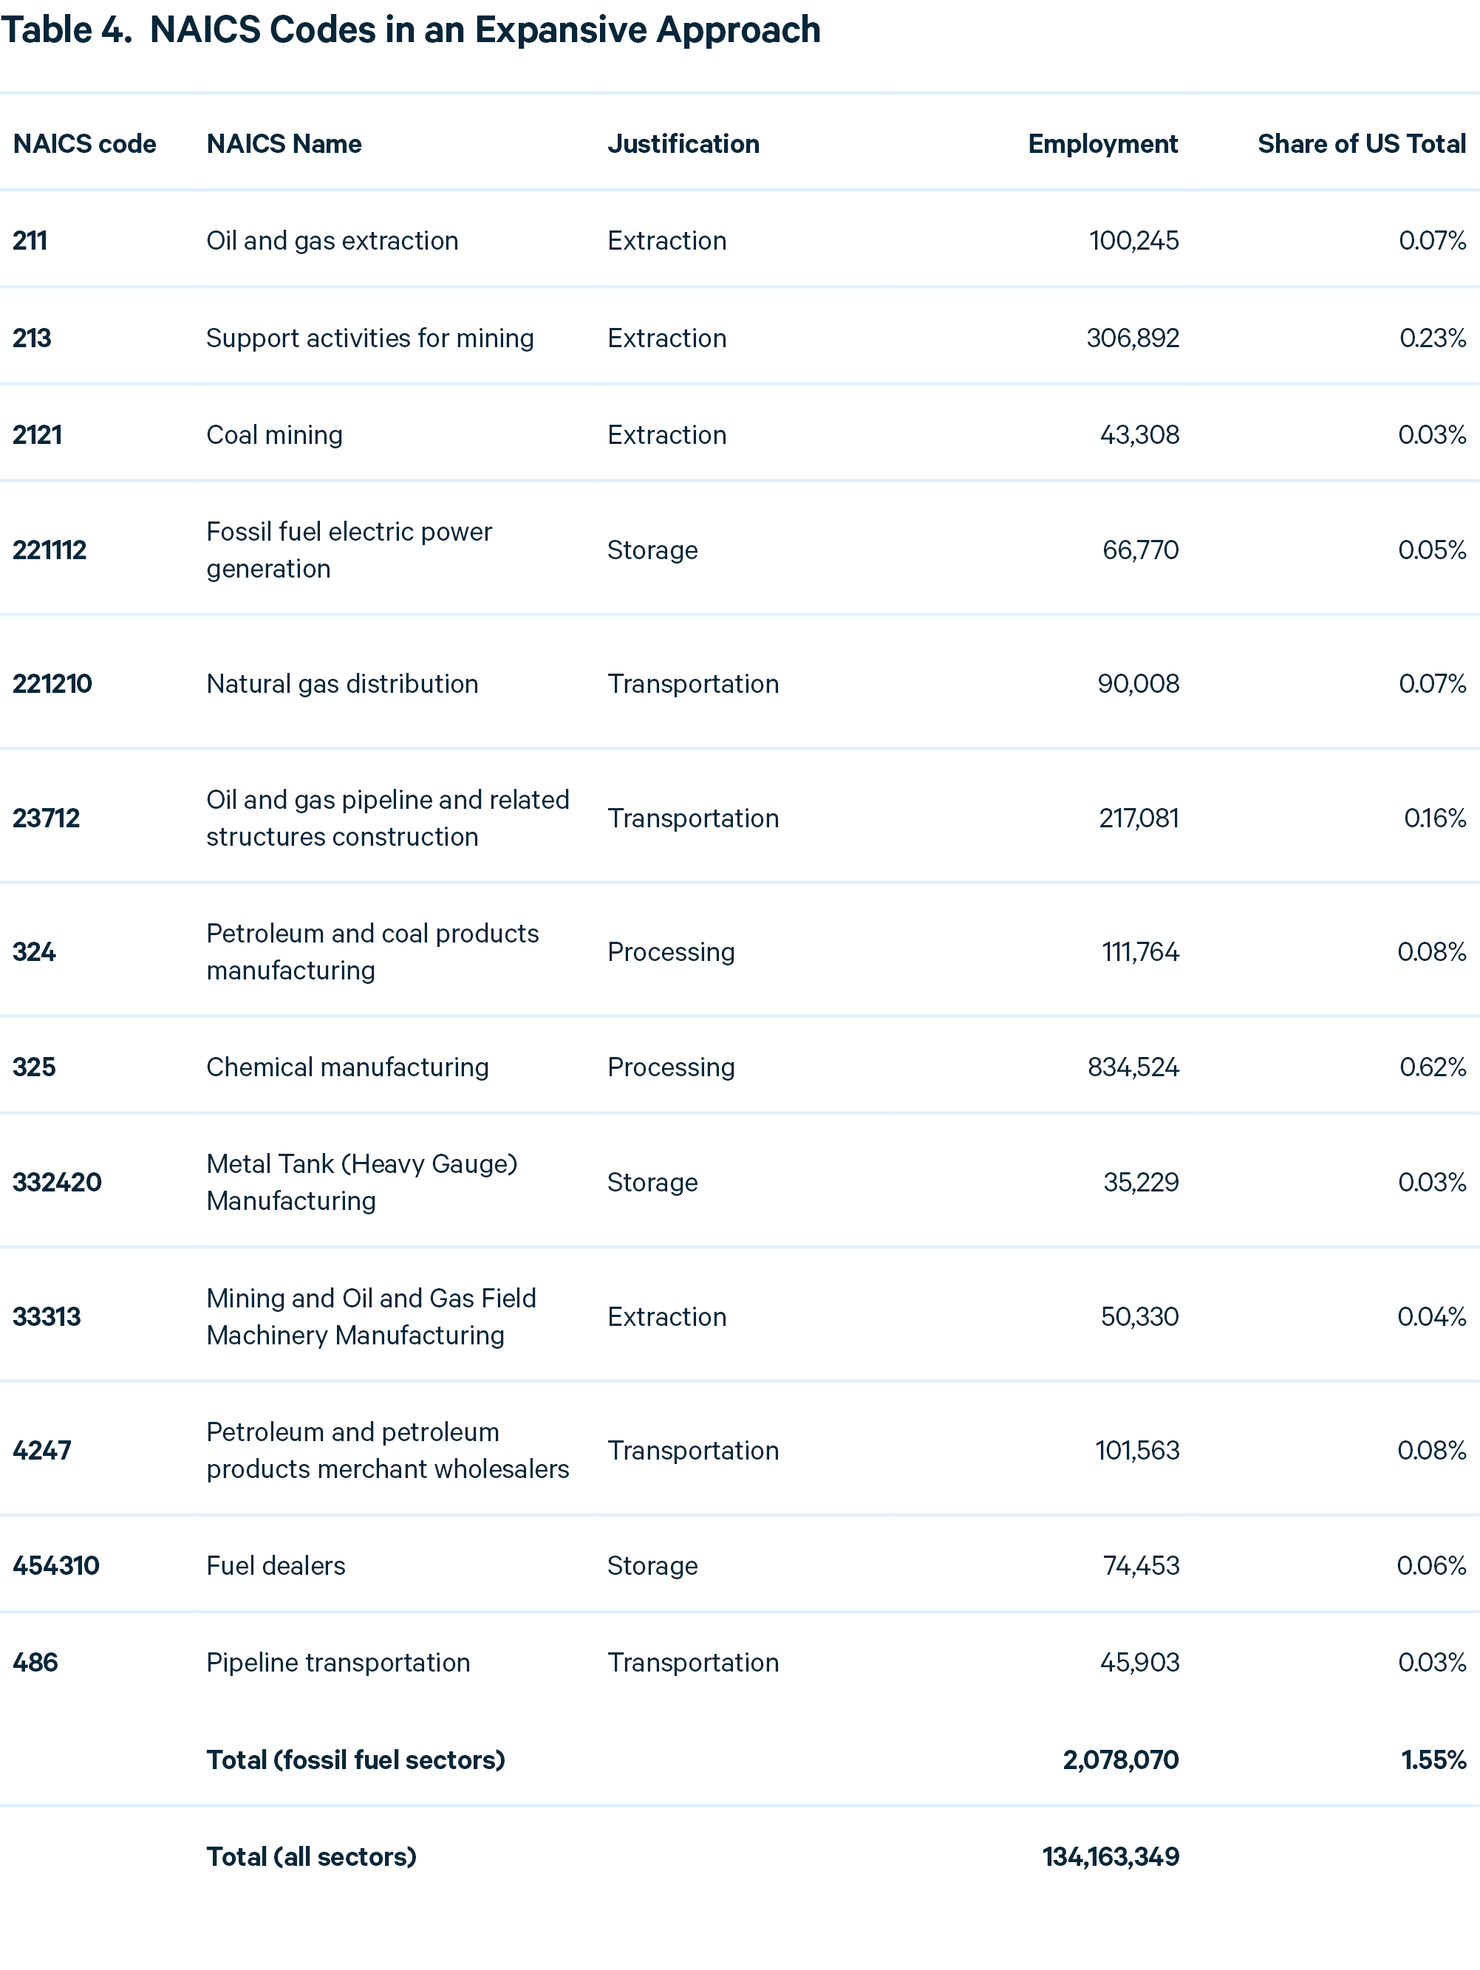
As noted previously, CBP data exclude the self-employed, agricultural production workers, and most government employees. If we instead use the 2020 national employment estimates from the BLS’ OEWS and QCEW (both 139.1 million), the total fossil sector employment share listed in Table 4 would change to 1.49 percent.
Applying employment data from the NAICS codes in Table 4 along with the provision that eligible MSAs and non-MSAs have above average unemployment compared with the previous year (see Section 3.2) using the most recent available unemployment data, we estimate that 40.8 percent of US land area would be eligible for the bonus tax credit (Figure 8).
Figure 8. Eligibility of Statistical Areas Under an Expansive Approach
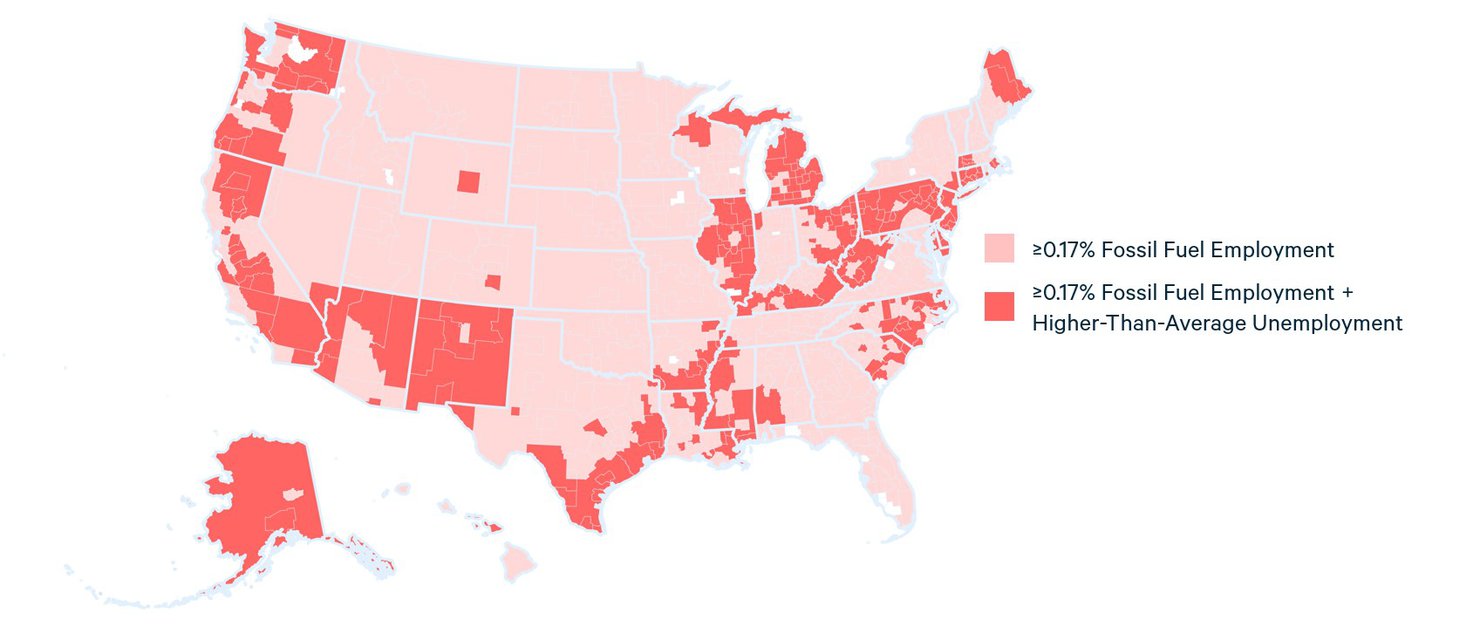
Because this interpretation has the broadest definition of fossil fuel employment, it covers most of the United States, setting aside the unemployment clause. When that clause is introduced, this definition exacerbates the issues discussed in Sections 3.2.1 and 3.2.2: it includes some regions with high fossil fuel dependence (Alaska, New Mexico, Texas’ Gulf Coast, West Virginia), an even larger set of regions with low dependence (much of Arizona, California, Connecticut, Illinois, Massachusetts, Michigan, Maine, North Carolina, Oregon, and Washington State), and excludes regions with high dependence (e.g., most of Louisiana, Montana, North Dakota, Oklahoma, west Texas, Utah, and Wyoming).
4. An Alternative Definition of Energy Communities
To ensure an equitable transition to a net-zero future, it will be necessary to target resources toward the places that are or have been heavily reliant on coal, oil, and natural gas for local employment, economic activity, and government revenue. In this section, we lay out principles for how policymakers can accomplish this outcome, develop a framework to identify the locations in need of the most support, and apply this framework to the IRA energy communities tax incentive.
4.1. Scaling, Targeting, and Timing of Financial Incentives
Many IRA provisions offer scaled financial incentives that allow benefits to increase when an activity (e.g., hydrogen production) occurs with lower life cycle greenhouse gas emissions. The IRA also applies scaled incentives for carbon capture, use, and storage deployment, domestic content use, and labor standards.
For energy communities, a scaled approach could provide different levels of financial incentives for projects located in regions with different levels of dependence on fossil fuel extraction, processing, and concentrated use (e.g., at power plants). When applying this principle to the IRA, tax credits for clean energy development could scale from zero in regions with very little fossil fuel dependence to 10 percent (or higher) for locations with the greatest dependence.
When deciding on how to geographically target financial incentives, our preferred approach would focus on counties because they are widely understood, consistently defined over time, and highly organized. Counties routinely collect, aggregate, and publish data and interact with state and federal governments. In addition, counties typically do not cover as much land area as non-MSAs in rural states, allowing for more precise geographic targeting in these regions.
With regard to the timing of eligibility for financial incentives, the IRA approach focuses on geographies that have already experienced fossil fuel closures and economic hardship. Incentives flow to locations where coal mines and generating units have closed and current unemployment is above national average rates. However, because diversifying local and regional economies takes years, if not decades, scholars and practitioners working on energy transition regularly point to the need to plan for economic changes before disruptions occur (Haggerty et al. 2018; Just Transition Fund 2020; Look et al. 2021; US Climate Alliance and BlueGreen Alliance 2022). Our approach for defining energy communities therefore includes data that incorporate retired and operating fossil fuel assets.
4.2. Measuring Fossil Fuel Dependence: Employment, Government Revenue, and Coal Communities
4.2.1. Employment
As described in Sections 3.2.2 and 3.2.3, the national average for fossil energy employment is roughly 0.7–1.6 percent, depending on data choices (and varying over time). If a policy seeks to target those communities most dependent on fossil energy activities, it would naturally focus on locations where employment and other relevant metrics are at or above the national average.
Although we are unable to say with precision which employment thresholds would offer the most economically efficient targeting, one reasonable approach would be to include all counties where fossil fuel–related employment is at or above the national average, then increase incentives step-wise in line with rates of fossil fuel employment. For the IRA, this approach could scale incentives in quartiles up to the full 10 percent additional tax credit.
Using an average of data from the CBP from 2010 to 2020, the US national average fossil fuel employment in our central set of NAICS codes (Section 3.2.2) is 0.78 percent. To estimate fossil fuel employment at the county level, we use the same data source and NAICS codes, taking the average share of county-level employment in fossil fuels from 2010 through 2020. The results are heavily right-tailed, with the modal and median counties both equal to 0, and the mean county has 1.1 percent employment. Because of this right-tailed distribution, we did not create equal-sized quartiles but instead used simple representative thresholds based on visual inspection of the data.
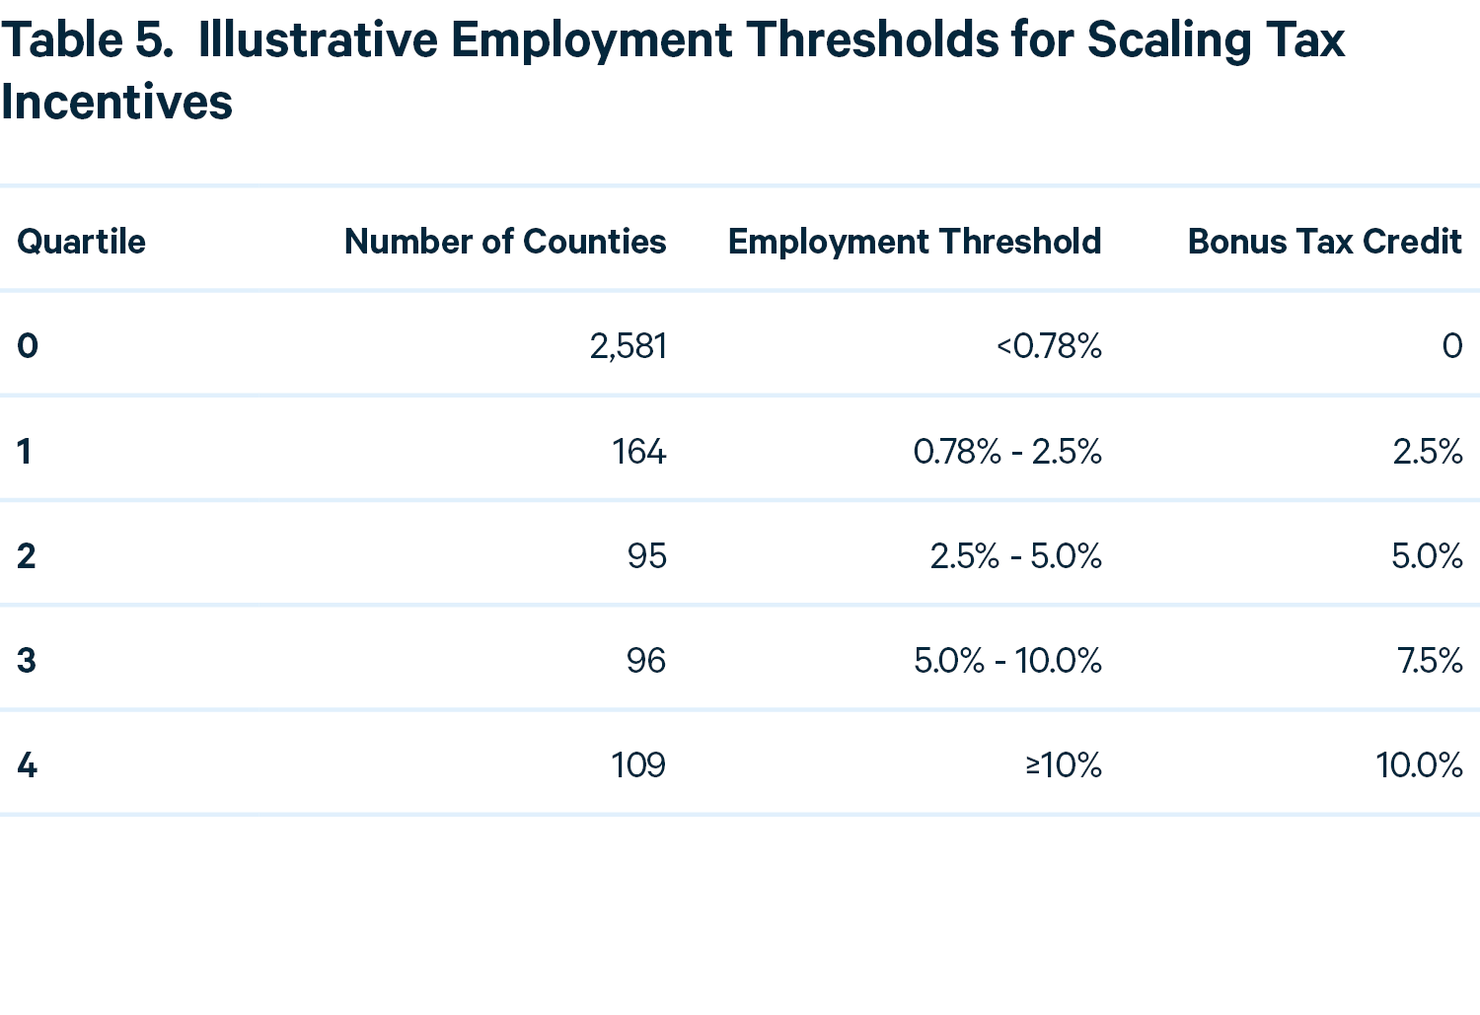
Policymakers could adjust these quartiles to increase or decrease eligibility and the level of financial support through simple changes in the thresholds or size of the credit. Figure 9 illustrates the counties that would be eligible for different levels of tax credits using the thresholds in Table 5.
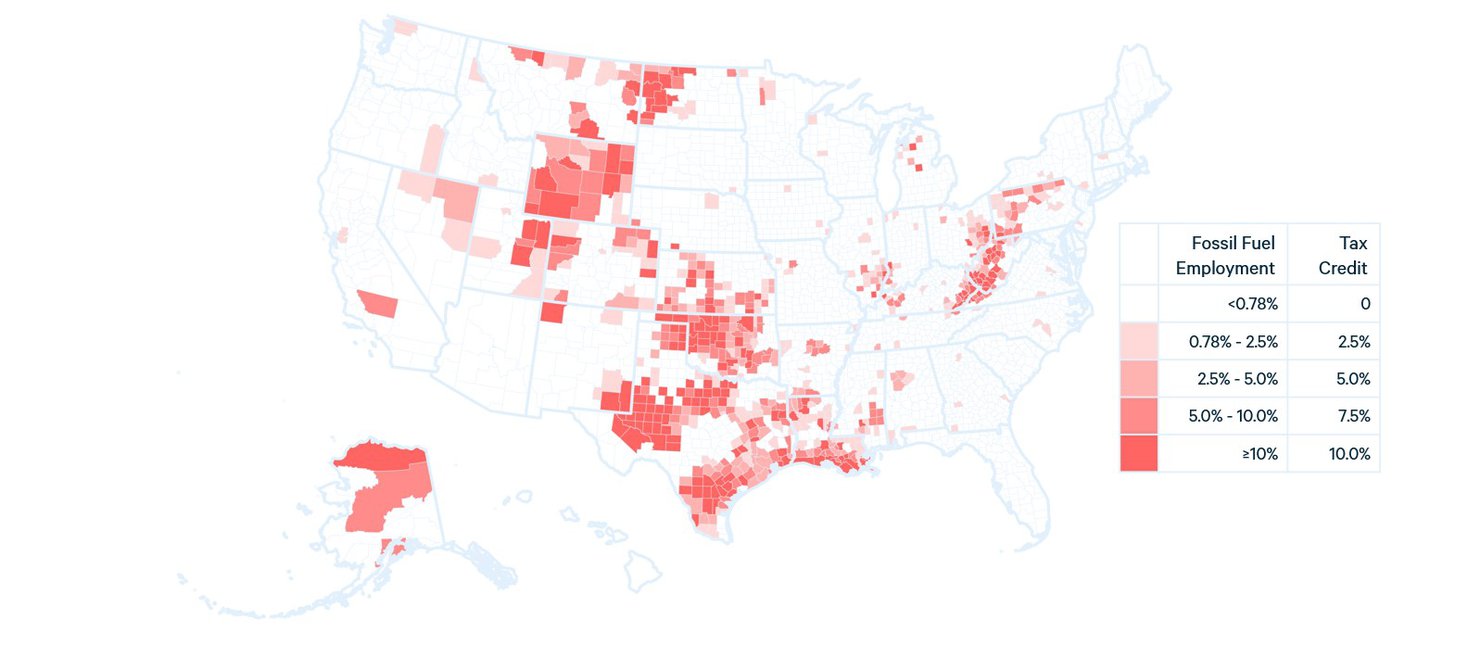
The set of counties in Figure 9 illustrates a more narrowly targeted set of geographies relative to the definition in the IRA. Although eligible counties cover 27.4 percent of US land area, just 8.8 percent of land area would be eligible for the full 10 percent credit. Because our definition does not include any eligibility criteria related to unemployment rates, it covers fossil fuel–dependent areas that are excluded from the IRA’s employment criterion (large portions of Colorado, Louisiana, Montana, North Dakota, Oklahoma, west Texas, Utah, and Wyoming).
Similarly, the geographies in Figure 9 do not include large areas where fossil fuels play a small role in local employment, some of which are included in the IRA’s definition (e.g., large portions of California, Illinois, Oregon, Maine, Michigan, and Washington State). Although some counties in these states do meet our eligibility criteria—often due to the presence of petroleum product wholesalers (NAICS code 4247)—they are often eligible for the lowest tier of the tax credit.
4.2.2. Government Revenue
As noted in Section 3, governments generally do not aggregate data on fossil energy–related tax revenues. Although county and state governments do maintain tax rolls that include all properties, and those properties are often categorized according to their purpose or ownership (for example, many states and localities use codes to indicate which properties are public utilities), they do not systematically gather or aggregate data that would allow for implementing the IRA’s definition of an energy community that receives “25 percent or greater local tax revenues related to the extraction, processing, transport, or storage of coal, oil, or natural gas.”
This definition raises two issues. First, the specification of “tax revenues” excludes revenue from production on public lands (e.g., royalties and bonus payments), which generates tens of billions of dollars per year for governments at various levels. Second, the threshold of 25 percent is quite high. Based on Raimi et al. (2022b), only Wyoming receives this level of tax revenue (i.e., not including public lands royalties) from the activities specified in the IRA.
To address these issues, we propose several steps. The first would be to commission new research or other activities to provide baseline data on the level of fossil fuel-related revenues collected by local governments. However, we believe that a comprehensive accounting still would not be possible given current data limitations, and this task would likely take years to carry out robustly.
A more practical first step would be to narrow the categories of revenue data to those collected and aggregated by most state and local governments. The second step would be to include revenue from production on public lands, which is a major source of funding for local services in many regions. The third step would be to lower the revenue threshold and, once again, scale the level of the incentive with the share of fossil fuel revenue collected in each county.
Because these county-data are not available, it is not clear how to set the thresholds, but the employment thresholds from Table 5 would be a reasonable starting point. In Raimi et al. (2022b), we identified four states in which revenue from fossil fuel production, processing (e.g., refining), transportation (e.g., pipelines), and consumption (e.g., power plants and petroleum consumption) generated 10 percent or more of total own-source revenue for the state and its local governments, five states where the share was 5–10 percent, and seven states where the share was 3–5 percent.
We would suggest the following categories of revenue for the calculation, which—based on our previous work—we believe most states systematically collect and aggregate:
- Local property tax revenue from coal, oil, and natural gas-producing property;
- Local distributions of state-collected severance or production taxes (or similar fees) on fossil fuels to localities; and
- Local distribution of state- and federally collected coal, oil, and natural gas leasing revenues.
One limitation of this approach is that it would not incorporate the Native nations where fossil fuels provide a major source of revenue, typically because these data are not publicly available. Policymakers will need to address this issue, which would be a serious concern for the Blackfeet Nation; Crow Nation; Jicarilla Apache Nation; Mandan, Hidatsa, and Arikara Nation; Navajo Nation; Southern Ute Indian Tribe; and others, to ensure these nations receive the same benefits as others.
In addition, these sources would generally exclude revenue from property taxes on power plants. However, the communities where coal-fired power plants provide an important source of revenue would be eligible for financial incentives based on the coal provisions described in Section 4.2.3.
We do not attempt to create quantitative thresholds, due to lack of data. However, we believe that the three sets of data listed could be gathered for most, if not all, counties.
4.2.3. Coal Communities
Although many of the counties that are or have been dependent on coal would qualify for incentives based on the employment thresholds described in Section 4.2.1, a rationale exists for additional provisions that ensure coal communities are supported. In the last several decades, hundreds of coal mines and coal-fired power stations have closed. The negative effects have been substantial, particularly in parts of Appalachia and the Intermountain West (e.g., Carley et al. 2018; Jolley et al. 2019; Metcalf and Wang 2019; Weber 2020; Roemer and Haggerty 2022).
However, like other aspects of the energy system, local economic dependence on coal varies considerably . For example, Campbell County, Wyoming produced more than one third of the nation’s coal in 2019 and is also home to more than 1,000 megawatts (MW) of coal-fired electric generating capacity (Raimi et al. 2022a). On the other end of the spectrum sits Orange County, North Carolina, which has no coal mining but hosts a small (32 MW) coal-fired co-generation station that provides power and steam to the University of North Carolina campus. Clearly, an energy transition that reduced or eliminated coal mining and coal-fired power would have dramatically different effects in these two counties. To reflect such differences, one can scale incentives based on the amount of coal activity in a given county.
To implement such an approach, we use data on coal mining and coal-fired power capacity from MSHA (mining) and EIA (capacity). To capture locations that are and have been dependent on coal, we use data extending back to 2000 and incorporate retired and operating assets (under the IRA approach, only retired facilities qualify). MSHA data show some level of coal production in 255 counties from 2000–2021, with a heavy right-tailed distribution. Using a quartile approach similar to the one in Section 4.2.1, financial incentives could scale according to the schedule in Table 6.
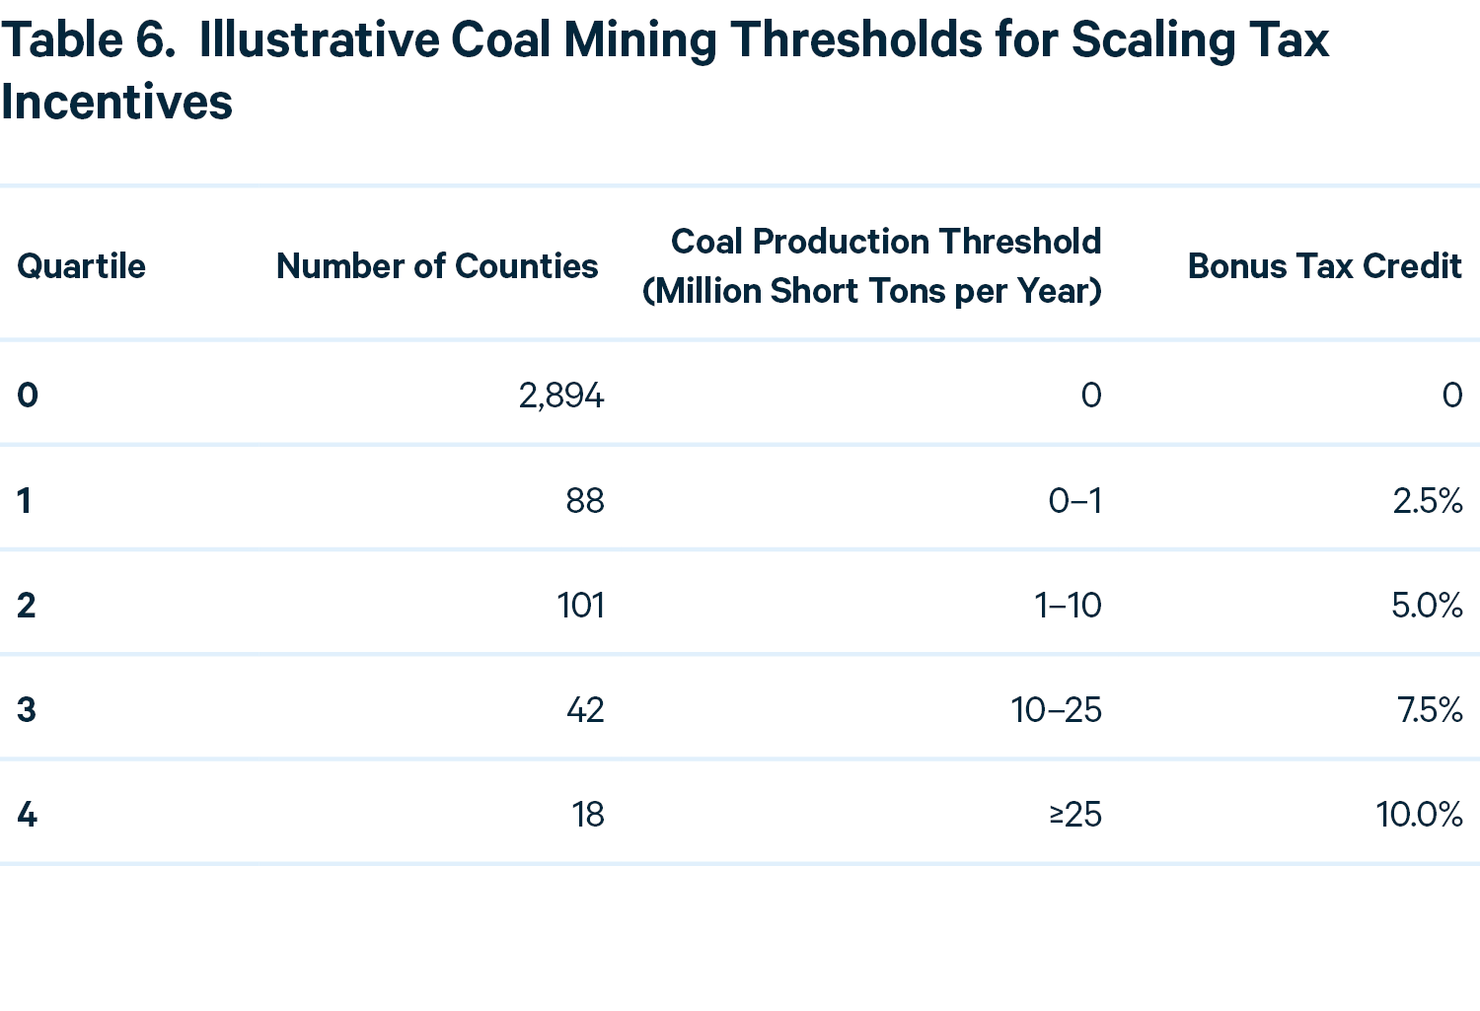
Like the other scaled incentives described in this section, policymakers could adjust these quartiles to increase or decrease eligibility and the level of financial support through simple changes in the thresholds or size of the credit. Figure 10 illustrates the counties that would be eligible for different levels of tax credits using the thresholds in Table 6. Each county’s eligibility is based on the maximum level of county-level coal production from all mines in any year from 2000–2021.
Figure 10. Eligible Coal Mining Counties Under Our Definition
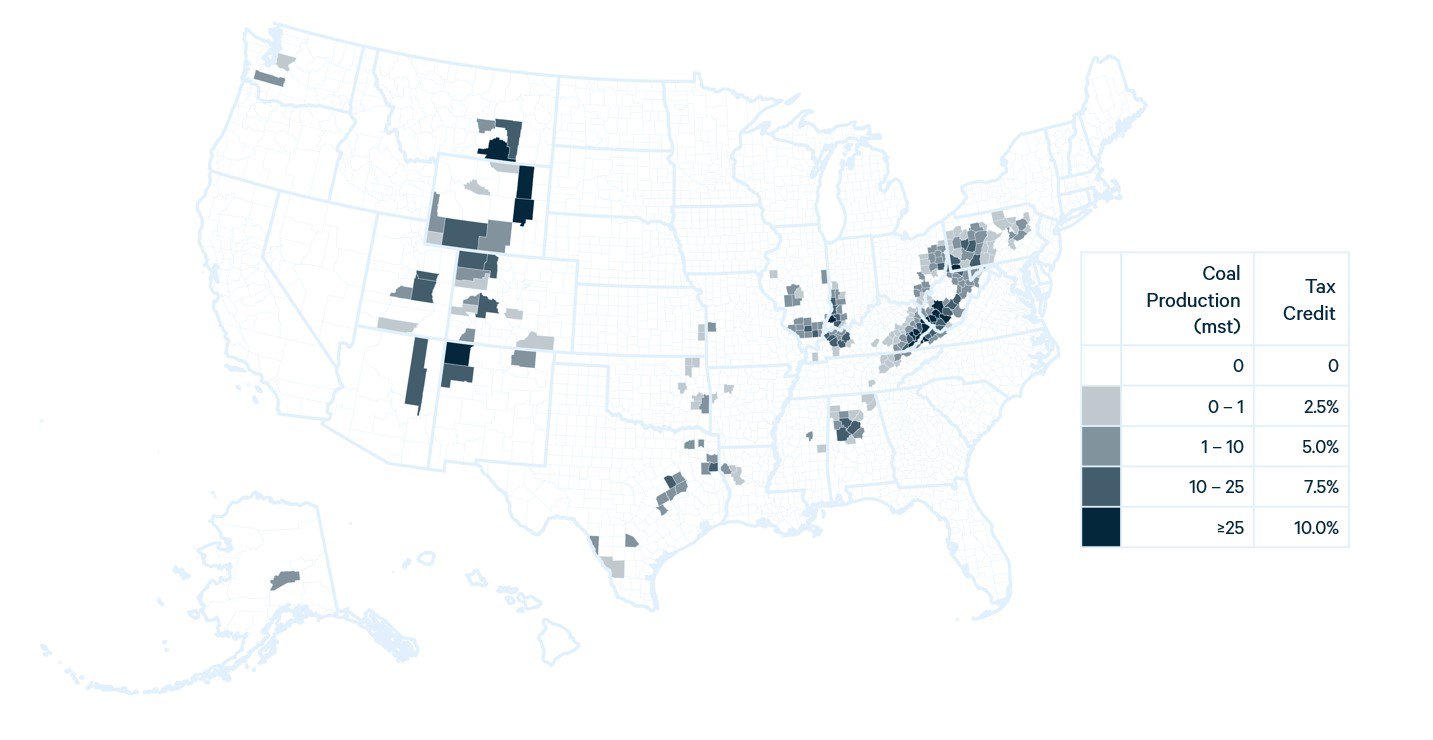
The counties in Figure 10 illustrate a more targeted set of geographies than those included in the IRA’s definition of coal mining communities (Section 3.1.2), covering 7.2 rather than 14.6 percent of US land area. This more limited geographic scope is primarily due to our use of counties, rather than census tracts, as the geographic unit. For example, under the IRA definition, a few closed coal mines in central Alaska designates 25.0 percent of the state’s land area as an energy community, whereas our definition includes those same mines but covers just 2.2 percent of the state’s area.
For coal-fired power, tax credits could be scaled to reflect generation capacity in each county. This method also differs in its focus on plants’ aggregate capacity; the IRA makes locations eligible based on whether any single generator (e.g., a boiler) has retired, regardless of aggregate capacity or operating status. Table 7 provides an illustration of how county-level coal-fired power generation capacity, including both operating and retired plants, could be used to scale tax incentives.
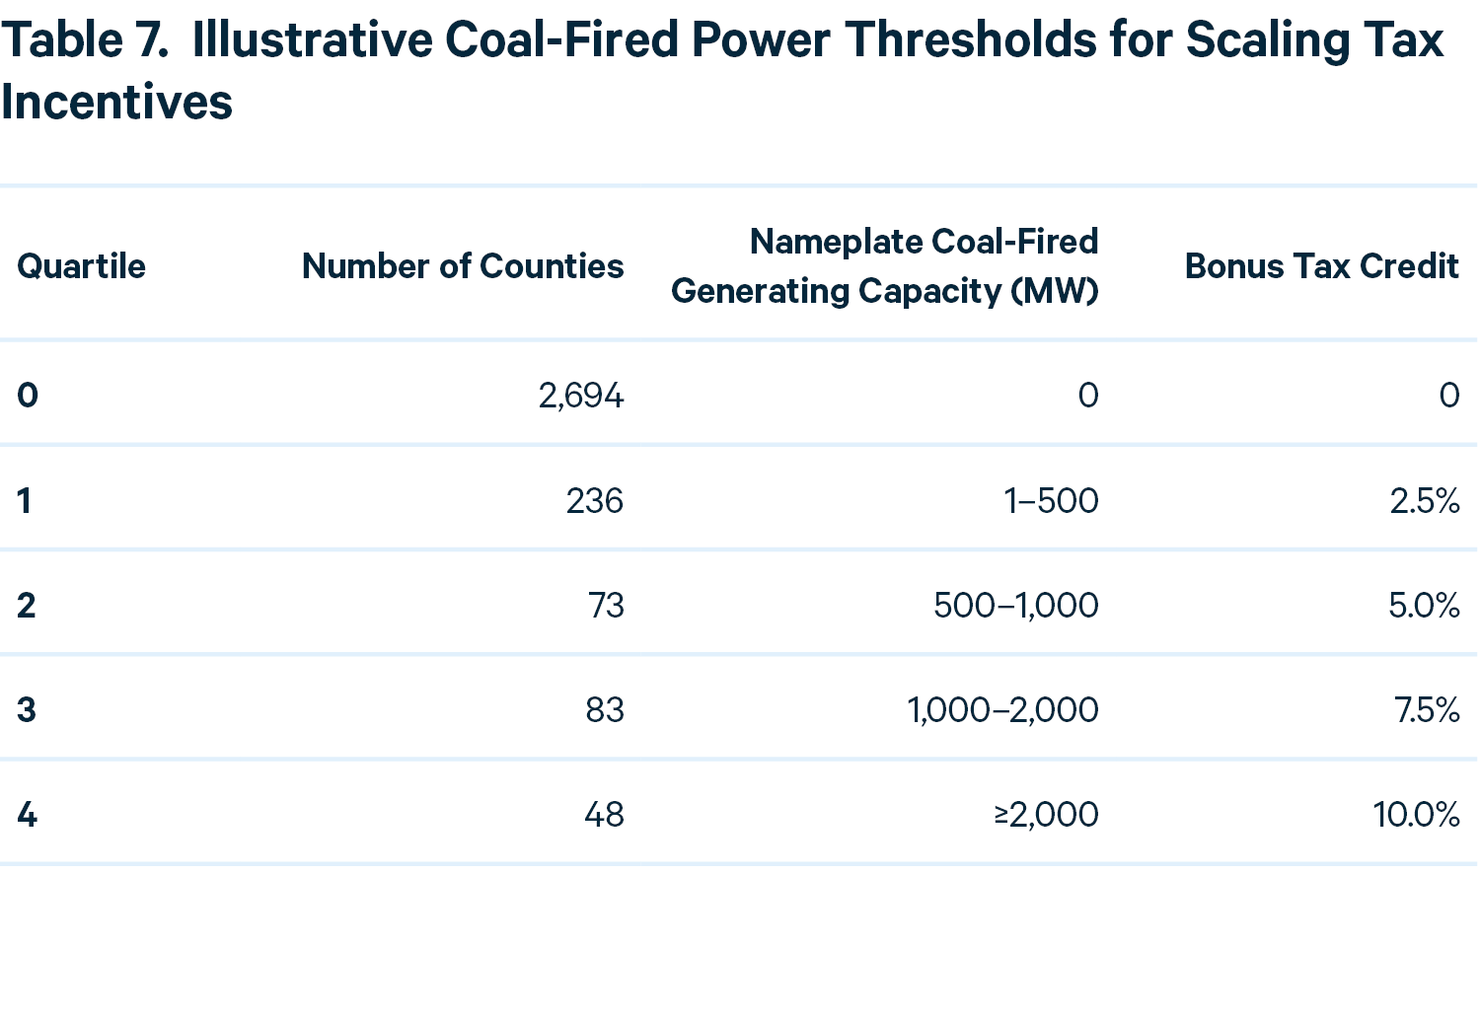
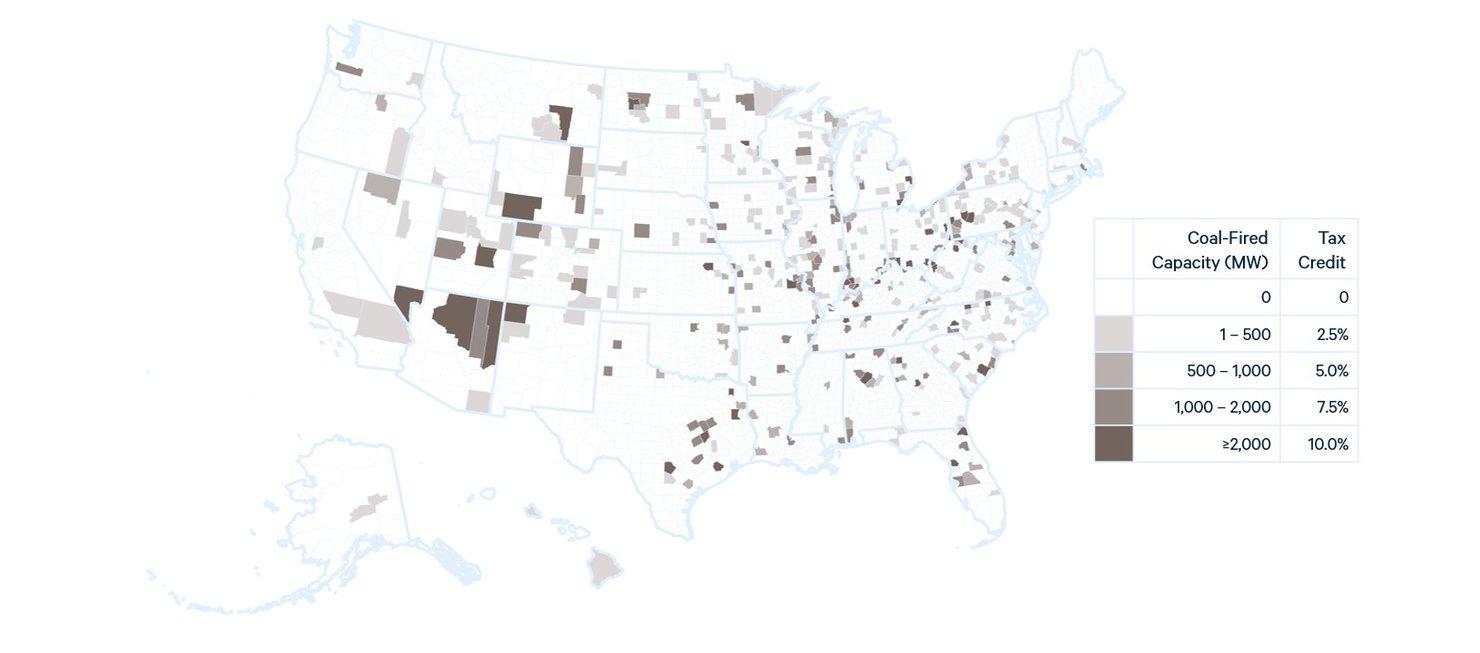
Like the quartiles elsewhere in this analysis, policymakers could adjust the thresholds or the level of the tax credit to reflect their policy priorities. For example, if they wanted to increase the geographic scope or the scale of the incentive, they could do so easily by reducing the capacity thresholds or increasing the level of the tax credit for either coal mining or coal-fired power. Figure 11 illustrates eligibility based on the criteria shown in Table 7.
Figure 11. Eligible Coal-Fired Power Counties Under Our Definition
4.2.4. Summary of Our Approach
Because counties can qualify as energy communities in multiple ways under our definition and the level of the tax credit may vary depending on which quartile the county falls into, we must choose a method to determine what level of credit is appropriate when a county meets multiple criteria. Our suggested approach would allow a county to be eligible for the highest level of incentive that it qualifies for under any criterion. For example, if a county was in the top quartile for fossil fuel employment (eligible for a 10 percent credit) and the third quartile for coal mining or coal-fired power (eligible for a 5 percent credit), projects in that county would receive the 10 percent credit.
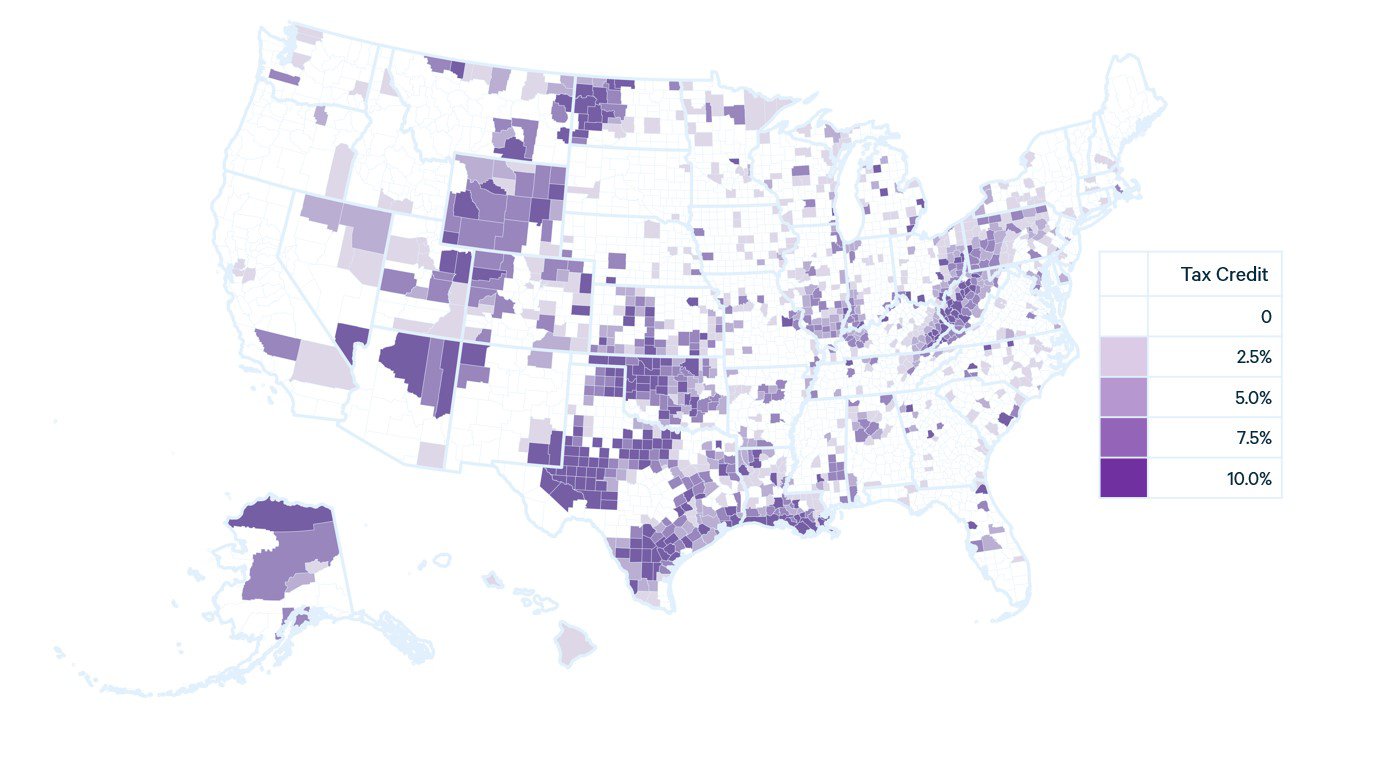
Figure 12 combines all three eligibility criteria to illustrate which counties would qualify and which level of tax credit they would be eligible for under our approach.
Figure 12. Tax Incentives Under Our Definition of Energy Communities
Our energy communities definition covers 39 percent of US land area, compared with the IRA, which covers 42–50 percent depending on the interpretation. However, just 10 percent of land area (202 counties) would be eligible for the full 10 percent credit under our definition. The remaining counties would be eligible for lower levels, reflecting their lower dependence on fossil fuels as a driver of local employment, economic activity, and government revenue. Table 8 summarizes the distribution of credit eligibility under this approach.
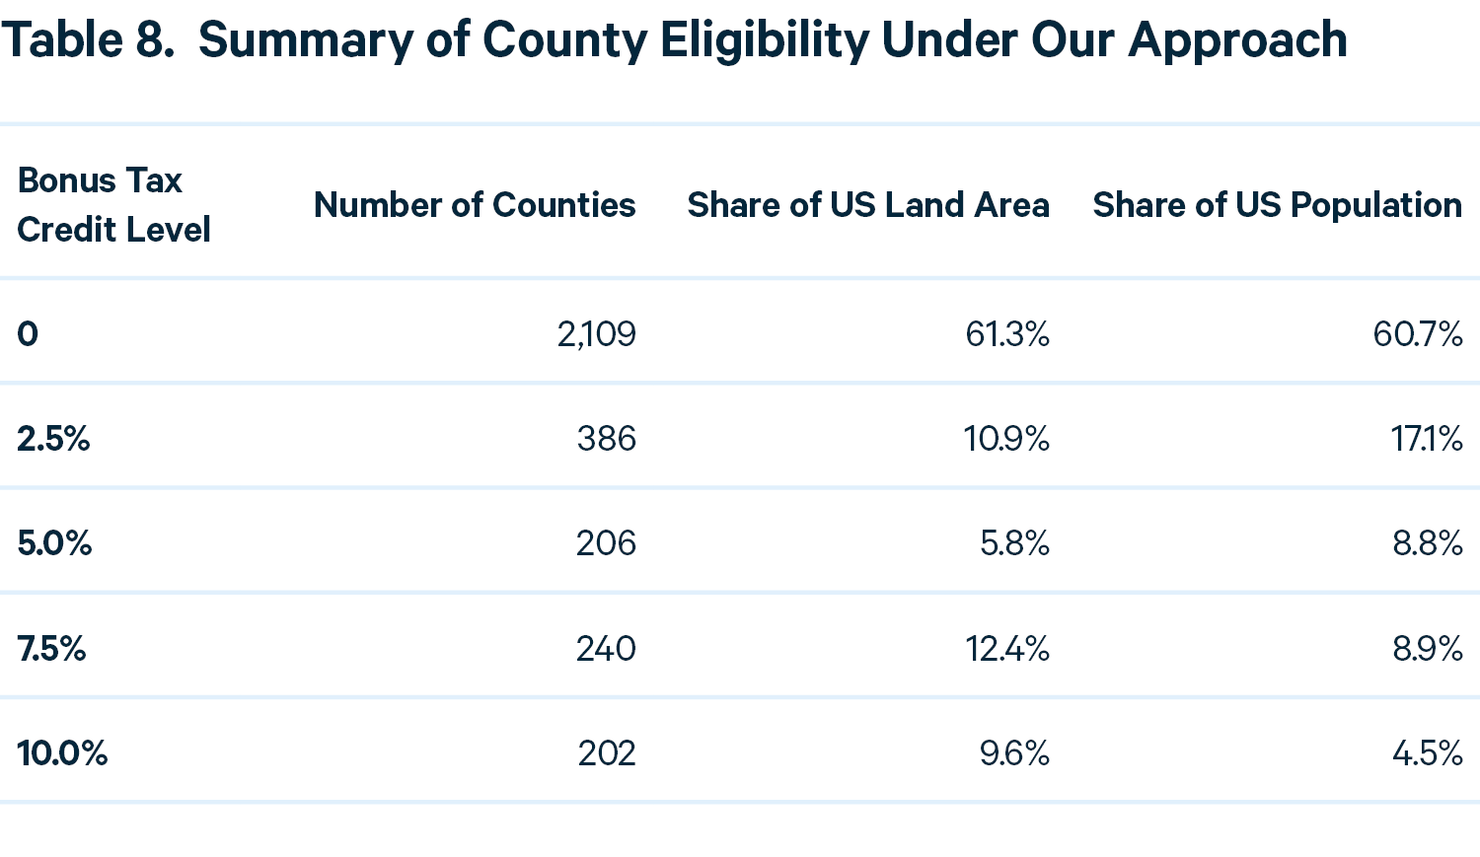
The regions with the largest concentrations of eligibility are in Appalachia, parts of the Intermountain West (particularly Wyoming), Texas and Louisiana’s Gulf Coast, west Texas, Oklahoma, and western North Dakota. Other, more isolated locations with high levels of dependence on fossil fuels, such as certain counties in Alaska, California, Colorado, the Midwest, and the Southeast, are also eligible for the full 10 percent credit under our definition.
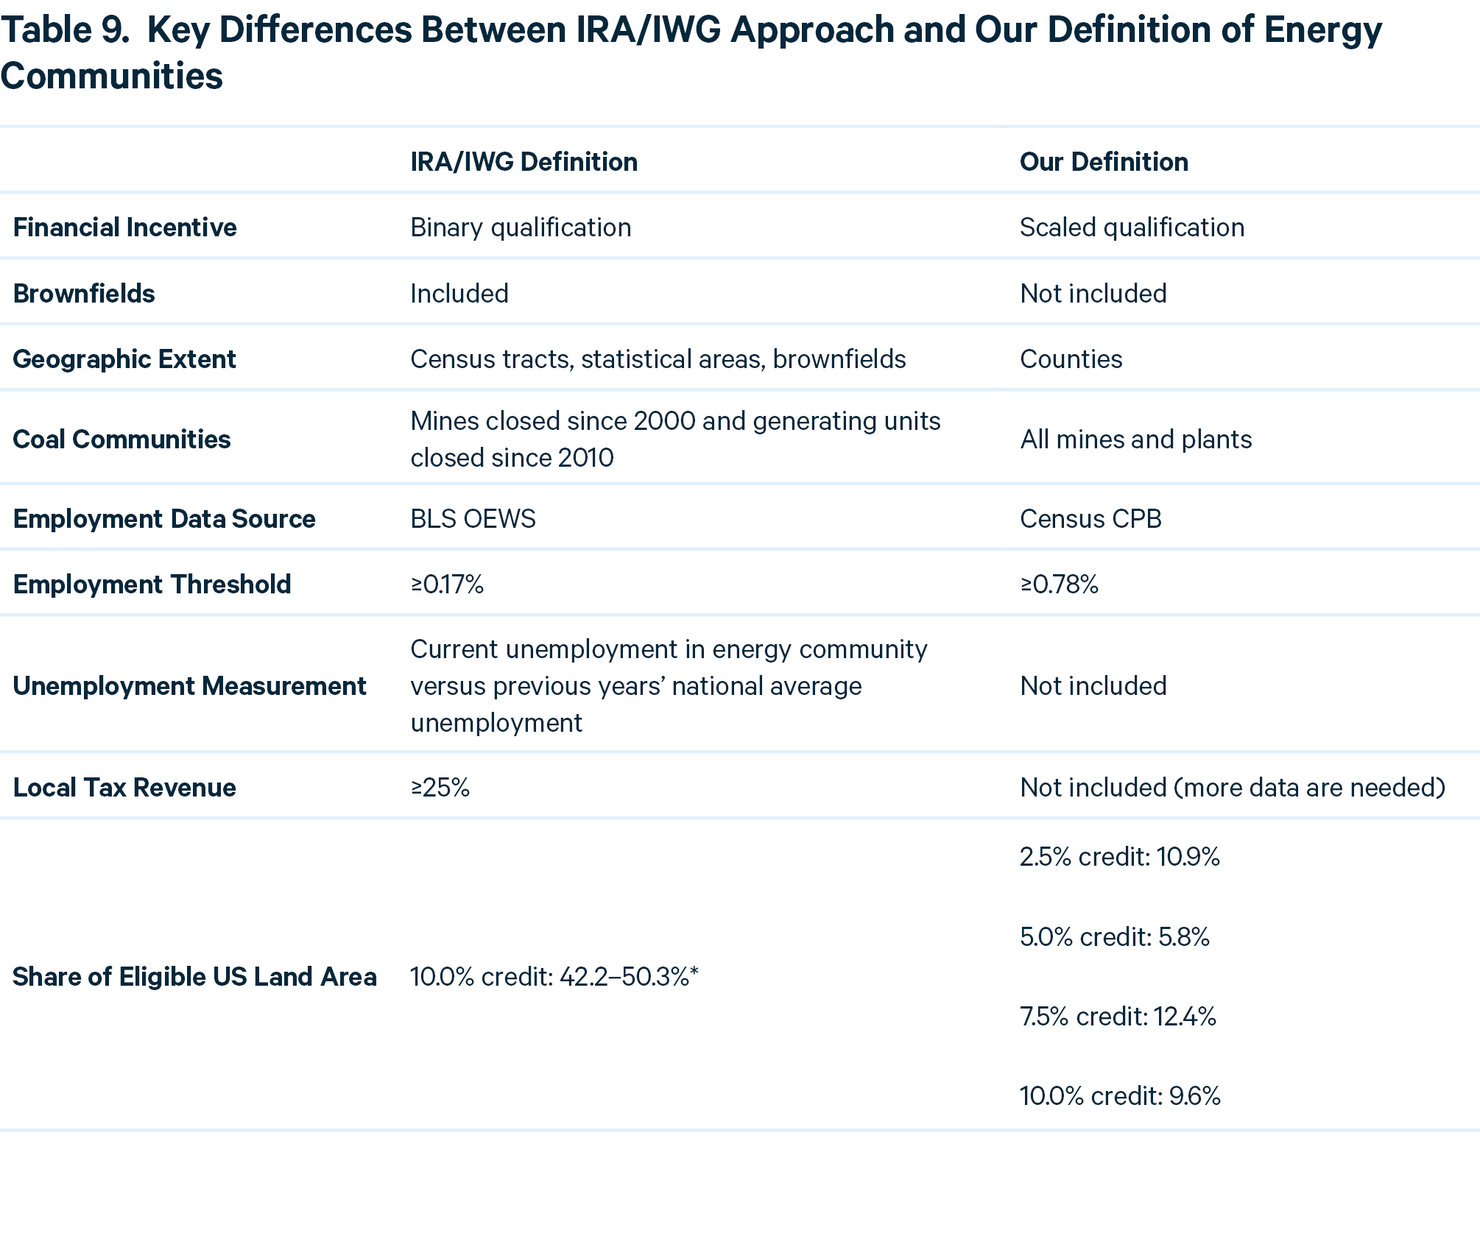
Our definition of an “energy community,” differs in several ways from the IRA. Key differences include binary versus scaled classifications of eligibility, choices of eligible geographies, use of unemployment data, employment threshold for qualification, criteria related to local public revenue, operating status of coal mines and electric generating units, and inclusion of brownfield sites. Our approach differs from that of the IWG (2021) primarily in its choice of geographic groupings and data source for employment data.
As a result of these differences, our definition covers less land area and, we believe, better targets the areas that are or have been heavily reliant on coal, oil, and natural gas as local economic drivers. Table 9 summarizes these differences.
5. Conclusion
Efforts to reduce greenhouse gas emissions in the United States and the world will affect workers and communities in many ways. Some of the most concentrated effects are likely to occur in regions that are or have been heavily dependent on the extraction, processing, and concentrated use (e.g., at power plants) of coal, oil, and natural gas. The IRA includes a provision that directs additional financial incentives for clean energy projects developed in energy communities, which could provide geographically targeted economic benefits to regions that face challenges associated with the reduction or cessation of fossil fuel activities.
However, defining an energy community is not straightforward, and the IRA definition could be interpreted in multiple ways. In this analysis, we offer three interpretations, describe their implications, and identify key clauses where the Department of Treasury’s interpretation will substantially affect eligibility outcomes. We also develop and implement our own definition of energy communities that seeks to more narrowly target the regions that are most heavily dependent on fossil fuels for employment, economic activity, and government revenue.
In each of our interpretations of the IRA, we estimate that the law’s additional financial incentive is unlikely to specifically support the communities that are or will be most heavily affected by a decline or cessation of fossil fuel activities. Although the law is likely to channel additional resources to certain regions with high levels of fossil fuel dependence, such as Alaska, Pennsylvania, West Virginia, Wyoming, and parts of Ohio and the Gulf Coast, it excludes other highly dependent regions, such as North Dakota, Oklahoma, Utah, and west Texas. In addition, it appears to include large swathes of states where fossil fuel extraction, processing, and concentrated use do not play a major role in the economy, such as California, Maine, Michigan, Oregon, and Washington State.
Our alternative definition of an energy community would more narrowly target fossil fuel–dependent communities by relying on smaller geographic units (i.e., counties) and scaling financial incentives to reflect the level of fossil fuel activity in each county. Policymakers could easily adapt this approach to increase or decrease the geographic scope by adjusting eligibility thresholds and the level of financial support by adjusting the levels of the tax credit to suit their policy priorities.
6. Appendix