An Analysis of US Subsidies for Electric Buses and Freight Trucks
In this issue brief, RFF researchers examine how a tax credit for medium- and heavy-duty vehicles could accelerate emissions reductions in the transportation sector.
Introduction
The Biden administration has set a goal of reducing US greenhouse gas (GHG) emissions to half of 2005 levels by 2030, and of achieving net-zero emissions by 2050.We thank the Macarthur Foundation for supporting this work. The analysis presented in this issue brief was conducted as part of a collaboration with researchers at Oak Ridge National Laboratory, which is not responsible for any content or views expressed in the Issue Brief. https://www.whitehouse.gov/briefing-room/statements-releases/2021/04/22/fact-sheet-president-biden-sets-2030-greenhouse-gas-pollution-reduction-target-aimed-at-creating-good-paying-union-jobs-and-securing-u-s-leadership-on-clean-energy-technologies/. Congress has considered major legislation toward achieving these goals during 2021, including a clean electricity performance program, increasing subsidies for low-GHG technologies and removing subsidies for fossil fuels, and possibly even introducing a carbon tax. https://www.npr.org/2021/07/15/1016448921/democrats-budget-plan-pushes-a-shift-to-clean-energy-heres-how-it-would-work; https://www.finance.senate.gov/chairmans-news/-wyden-colleagues-introduce-legislation-to-overhaul-energy-tax-code-create-jobs-combat-climate-crisis; https://www.nytimes.com/2021/10/16/climate/democrats-carbon-tax-climate.html.
At least for the time being, Congress has moved away from two of those options—a clean electricity standard and a carbon tax—which increases the interest in what can be accomplished by subsidizing clean energy technologies. https://www.nytimes.com/2021/10/15/climate/biden-clean-energy-manchin.html; https://www.politico.com/news/2021/10/19/climate-joe-manchin-plan-c-democrats-516262. For example, recent legislative proposals increase existing subsidies for wind power, solar power, and plug-in passenger vehicles. Those subsidies, which have received considerable media attention, also would strengthen incentives for domestic manufacturing of batteries and clean technologies. What has gotten substantially less attention is that Congress may create entirely new subsidies for commercial electric vehicles and associated charging infrastructure included in both the Clean Energy for America Act and the Build Back Better Act. This issue brief analyzes the carbon dioxide (CO2) reductions and fiscal costs of subsidies for transit buses and certain trucks.
Medium- and heavy-duty vehicles (that is, anything larger than a passenger vehicle) consume roughly 30 percent of the total energy used by on-road or “highway” vehicles and generate about one-quarter of GHG emissions from the transportation sector (equivalent to 7 percent of total US emissions). See EIA AEO 2021, Reference Case, Table 35 and https://www.epa.gov/greenvehicles/fast-facts-transportation-greenhouse-gas-emissions. Recent analysis of subsidies for plug-in passenger vehicles leverages past experience with these subsidies to predict future outcomes. The fiscal costs and GHG reductions of the electric truck subsidies will depend on how much truck buyers respond to the subsidies and how much those trucks are driven, but because these subsidies are brand new, it is that much harder to anticipate their effects and assess how much the subsidies may help achieve the Biden administration’s climate objectives.
We study the potential effects of offering tax credits to transit buses, day cabs (freight trucks that do not include a sleeping compartment), and sleeper cabs (freight trucks that include a sleeping compartment). The three vehicle categories account for almost half of carbon dioxide (CO2) emissions from medium and heavy-duty vehicles (MHDVs), with sleeper cabs making the largest contribution of the three types. Medium and heavy-duty trucks include any vehicle larger than a small pickup truck. Transit buses and other “vocational” vehicles belong to the category of medium and heavy-duty trucks. We note that because we analyze a subset of the vehicle types that are eligible for subsidies, we are not estimating the total effect of the policies on all MHDVs.
We use a new computational model of MHDVs that accounts for the effects of subsidizing 30 percent of the up-front purchase cost of transit buses, day cabs, and sleeper cabs to estimate the uptake, fiscal costs, and CO2 benefits of the subsidies through 2035, relative to a baseline case that does not include the subsidies. This analysis is meant to represent recent legislative proposals, such as the commercial vehicle investment tax credit included in both the Clean Energy for America Act and the Build Back Better Act. We consider scenarios that differ by the rate at which electric vehicle prices decline over time; in all scenarios, the subsidy phases out after electric vehicles achieve 50 percent market share.
Our key findings are:
- In the baseline case (no subsidies), electric buses, day cabs, and sleeper cabs are unlikely to achieve significant shares of new purchases by 2035.
- The effectiveness of the 30 percent subsidy at increasing electric bus and truck sales depends on the assumed rate at which electric vehicle prices decline. Assuming a moderate rate of pre-subsidy price decline, the subsidy causes electric bus, day cab, and sleeper cab sales to begin increasing around 2030 and achieve a 50 percent market share in 2035.
- Assuming a faster rate of price decline, the subsidy causes electric buses, day cabs, and sleeper cabs to achieve a combined 80 percent market share by 2035. At a faster rate of price decline, the subsidy reduces emissions by about 60 million metric tons of CO2 in 2035, which amounts to about a 60 percent decrease in emissions relative to the baseline (no subsidy) scenario.
- Total (undiscounted) fiscal costs between 2022 and 2031 are $2-24 billion, depending on the degree of price decline, with faster decline causing greater uptake and higher fiscal cost. Fiscal costs per ton of CO2 reduction are broadly comparable to recent estimates for subsidizing plug-in electric light-duty vehicles.
Note that the Biden administration’s target is for total US GHG emissions in 2030 to equal half of total emissions from 2005. The emissions reduction in 2030 for transit buses, day cabs, and sleeper cabs in the high-technology scenario amounts to 1.4 percent of the total emissions reduction needed to achieve that target. To estimate baseline emissions levels in 2035, we use the Energy Information Administration’s 2021 Annual Energy Outlook Reference Case carbon dioxide projections. We compute the difference of this projection and EIA’s 2005 carbon dioxide estimate. The number reported in the text is the ratio of the emissions reduction caused by the policy and the difference between the 2005 and projected 2030 emissions, expressed as a percentage. We consider energy-related carbon dioxide emissions only. However, this emissions reduction represents a large share of projected future emissions from those vehicles.
Description of Model and Policy Scenarios
2.1 Computational Model
We model three markets: transit buses, day cabs, and sleeper cabs. As we explain next, an important feature of the model is that we account for variation across vehicle buyers in their expected miles driven and discount rates. Each market (bus, day cab, or sleeper cab) contains two types of vehicles that are differentiated by fuel type: battery-electric or diesel fuel. Each year, a pre-determined number of buyers enters the market, and each buyer selects its preferred vehicle. Buyers consider the total cost of ownership of the buses and trucks over their lifetimes, and total costs include the up-front purchase cost (net of any subsidies) as well as discounted operational costs (fuel and maintenance). An individual buying a vehicle discounts future costs when comparing with current costs. A high discount rate means that the individual cares less about future costs relative to current costs, compared to a low discount rate. For more background on discounting, https://www.rff.org/publications/explainers/discounting-101/.
An individual buyer considering either a bus or cab trades off up-front purchase costs against fuel and maintenance costs. For example, we assume that an all-electric bus has a purchase price of about $185,000 in 2030 (not including subsidies), which is almost 50 percent higher than the price of a diesel bus. Most of the parameter assumptions are from Burnham et al. (2021) “Comprehensive Total Cost of Ownership Quantification for Vehicles with Different Size Classes and Powertrains.” The Appendix summarizes key assumptions.
In contrast to the higher purchase price of an electric vehicle, fuel costs and maintenance costs of electric vehicles are considerably lower than for diesel fuel vehicles. For example, electric day cabs have roughly 23 percent lower per-mile fuel costs and 40 percent lower annual maintenance costs than diesel fuel day cabs. Because of the lower per-mile fuel costs, a day-cab buyer expecting to drive a high number of miles is more likely to buy an electric day cab than a buyer expecting to drive fewer miles. Moreover, because fuel costs and maintenance costs accrue over the vehicle’s lifetime, and the electric vehicles save money each year, a buyer with a low discount rate is more likely to buy an electric vehicle than a buyer with a high discount rate.
If we assume that all buyers had the same expected miles and discount rates as one another, the model would predict either that all buyers would buy electric vehicles or that all buyers would buy diesel fuel vehicles; the market share of electric vehicles would be 100 percent or zero. Clearly, this is unrealistic, and instead we assume that expected miles and discount rates vary across individuals. For example, one day-cab buyer may expect to drive long routes and perhaps 200 miles per day, whereas a second day-cab buyer may expect shorter routes and only 100 miles per day. Buyers may also have different discount rates because the discount rate is closely linked to interest rates faced by different buyers when they finance their purchases. For example, a large fleet operator may have access to low-interest loans and would discount future costs at a lower rate than an individual owner-operator. The Appendix describes the parameters that characterize the variation of miles driven and discount rates.
The upshot of this variation is that even if a typical buyer prefers one fuel type, there may be some buyers who prefer the other fuel type. Consequently, the model predicts market shares of electric vehicles that are between 0 and 100 percent. At current battery costs, and without large electric vehicle subsidies, only a few buyers may be interested in an electric vehicle, but as battery costs and electric vehicle prices decline over time, increasing shares of buyers decide to buy an electric vehicle.
Charging infrastructure availability also affects vehicle purchase decisions. Investments in charging infrastructure are exogenous to the model and the investment trend between 2020 and 2035 is based on Xie and Lin (2021). Xie, Fei, and Zhenhong Lin. “Integrated U.S. Nationwide Corridor Charging Infrastructure Planning for Mass Electrification of Inter-City Trips.” Applied Energy 298: 117142.Owners of electric vehicles incur costs when aggregate charging demand exceeds the capacity of the charging infrastructure. Charging infrastructure investments reduce the likelihood that charging demand exceeds supply and reduces total costs of owning and operating the electric vehicles.
We simulate the model from 2005 through 2035. We use the simulation results between 2005 and 2020 to construct the on-road stocks of buses and trucks in 2020, and we compare policies between 2020 and 2035.
For each year and market, we estimate the distribution of expected miles and discount rates across the buyers. We simulate the fuel type choice of each buyer accounting for vehicle prices, vehicle subsidies (if any), fuel prices, maintenance costs, expected miles, vehicle lifetimes, and discount rates. We keep track of the diesel fuel and electricity consumption for the buses and trucks between their purchase and retirement. Total CO2 emissions each year include tailpipe emissions from burning diesel fuel as well as electric power sector emissions from charging the batteries. The rate of CO2 emissions per kilowatt hour of electricity decline over time as the power sector continues its transition toward lower-emitting sources. We assume a linearly declining national average emissions rate for electricity, which begins at 0.417 kilogram of carbon dioxide per kilowatt hour (kg CO2/kWh) in 2020 to 0 kg/kWh in 2050 (which is consistent with 2020 emissions and current US climate objectives). We assume an emissions rate of 10.16 kg CO2/gallon for diesel fuel; this assumption may overstate future diesel fuel emissions to the extent that biofuels replace diesel, which would cause us to underestimate the emissions reductions presented in Section 3.4.
2.2. Policy Scenarios
The baseline scenario does not include any subsidies for electric trucks or buses. We compare the baseline to two policy scenarios, both of which include a subsidy equal to 30 percent of the electric vehicle purchase price. The subsidy level is the same as the 30 percent investment tax credit (ITC) in the Build Back Better Act. We also analyzed scenarios that include 50 percent subsidies for electric buses and trucks. Not surprisingly, these scenarios accelerate the adoption of the electric vehicles, although the larger subsidy reduces emissions just slightly more than the 30 percent subsidy over the 10-year budget window. One of these policy scenarios assumes modest declines in battery costs (low-technology case) and the other assumes more aggressive declines in costs (high-technology case). Specifically, in the low-technology case, bus and truck prices decline about 40 percent between 2020 and 2030 due to improving battery costs. In the high-technology case, battery costs decline even further by 2030, causing bus and truck prices to drop almost 70 percent between 2020 and 2030. Technology assumptions are based on Burnham et al. (2021) “Comprehensive Total Cost of Ownership Quantification for Vehicles with Different Size Classes and Powertrains.” In principle, the prices of electric buses and trucks could depend on past sales of these vehicles. For example, high sales in one year could allow vehicle producers to reduce costs in subsequent years by realizing economies of scale or learning-by-doing. Our model does not include this feature, and instead we assume an exogenous path of technology development. We note that the high-technology case cost assumptions may be more accurate than the low-technology assumptions.
For each vehicle type, the subsidy begins phasing out after electric vehicles account for 50 percent of total new sales. This assumption is consistent with the Build Back Better Act and the Clean Energy for America Act. The two subsidy scenarios also include subsidies for 30 percent of the cost of charging infrastructure.
Results
This section discusses the results of the simulations. We consider sales of electric buses, day cabs, and sleeper cabs; fiscal costs of the subsidies; the stock of on-road electric buses and trucks; and CO2 emissions.
3.1. Electric Vehicle Sales
Figure 1 shows that in the baseline scenario, sales of electric buses and trucks are close to zero through 2035. With the low-technology assumptions, the 30 percent subsidy causes sales to increase noticeably around 2030, reaching about 80,000 units by 2035. Those sales represent about half of total sales across the three vehicle types, but market shares vary across types (not shown in the figure). The electric market share is just 10 percent for sleeper cabs, and it is 80 percent for day cabs and 100 percent for transit buses.
Market shares in 2035 vary across the three vehicle types for the following reason. Without subsidies, for most of the time period electric trucks are more expensive than diesel fuel trucks. Because of their larger battery packs, this price difference is greater for sleeper cabs than day cabs and transit buses. Consequently, the subsidy is insufficient to cause many sleeper cab customers to choose electric, but it does cause many transit bus and day cab customers to choose electric.
Figure 1. Total Sales (number of new EV trucks sold per year, all modeled vehicle classes)
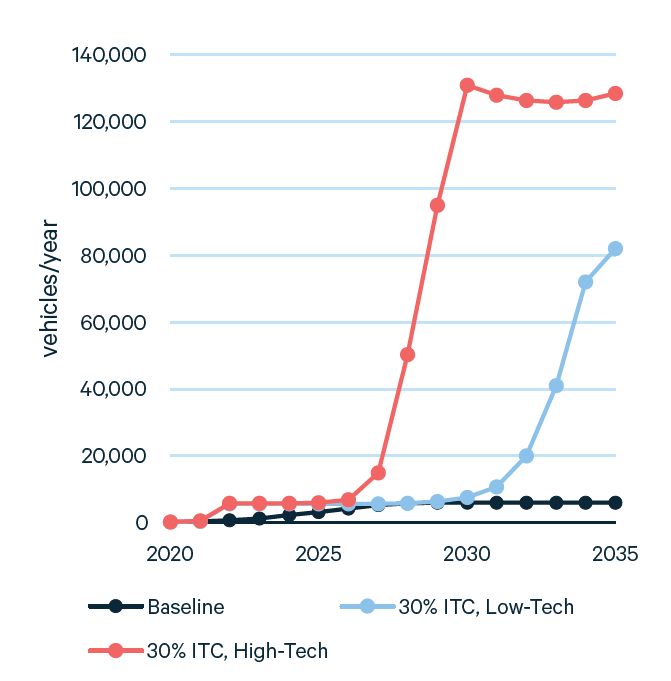
Figure 1 also shows that the technology assumptions affect electric vehicle sales. The lower electric vehicle prices in the high-technology scenario causes electric sales to start increasing sooner and reach a higher level (about 80 percent of new sales in 2035) than in the low-technology case.
3.2. Fiscal Costs
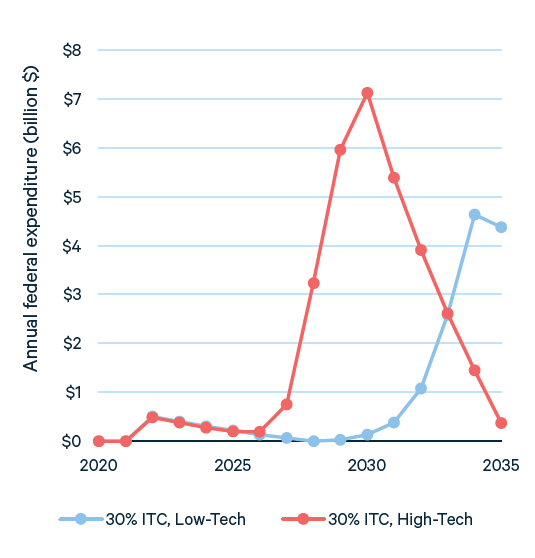
Because the purchase subsidy equals 30 percent of bus and truck prices until the subsidy begins phasing out, total fiscal expenditures are related directly to electric vehicle purchases. Figure 2 shows the annual subsidy expenditure for both scenarios (expenditure for the baseline scenario is zero). For the low-technology scenario, expenditures follow a similar trajectory to the sales trajectory in Figure 1. This similarity shows that for the low-technology scenario, the subsidies are driving sales.
Comparing figures 1 and 2 reveals that, for the high-technology scenario, the subsidies drive electric vehicle sales through the late 2020s, but by the 2030s, the role of the subsidies diminishes as the subsidy phases out. Expenditures decline to zero by 2035, but Figure 1 shows that sales of electric buses and trucks remain at high levels in the 2030s. This indicates that buyers of electric buses and trucks in the 2030s no longer require high subsidy levels.
Annual federal expenditures peak at about $7 billion in 2030 under the high-technology scenario and almost $5 billion in 2034 under the low-technology scenario. The estimated cumulative costs between 2022 and 2031 are $24 billion for the high-technology scenario and $2 billion for the low-technology scenario.
Figure 2. Annual Federal Tax Expenditure by Scenario (2019$)
3.3. Electric Vehicle Stocks
The subsidies for electric buses and trucks reduce CO2 emissions from new vehicles, but climate damages depend on emissions from all on-road vehicles, not just new ones. Therefore, the effects of subsidies on CO2 emissions depend on the share of all on-road vehicles that is electric.
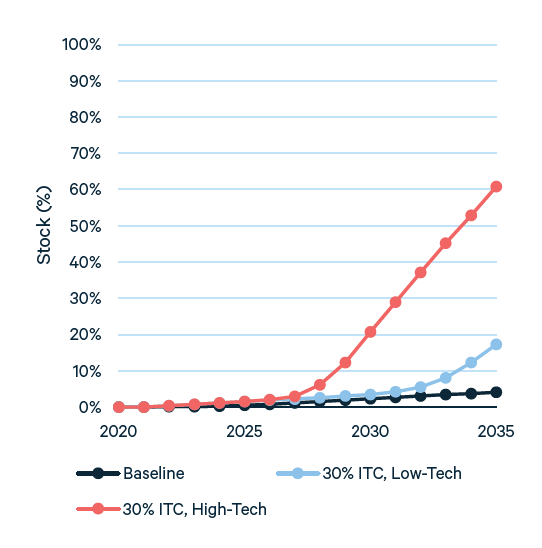
Because diesel fuel buses, day cabs, and sleeper cabs are driven 10-12 years before retirement, the stock of on-road vehicles transitions gradually from diesel fuel to electric. That is, in a particular year, only about 10 percent of on-road buses and trucks were purchased new that year. Consequently, it would require 10-12 years of 100 percent market shares for new electric buses and trucks until electric vehicles replace the entire on-road stock.
Figure 3 shows the percentage of electric buses and trucks among all buses and trucks on the road. Comparing figures 1 and 3 illustrates that the transition from diesel fuel to electric buses and cabs will be gradual. For example, the high-technology scenario causes most vehicle sales to be electric in the late 2020s, but the share of electric vehicles in the on-road stock is just 20 percent.
Figure 3. Percent of Electric Buses and Trucks on the Road
3.4. CO2 Emissions and Cost Effectiveness
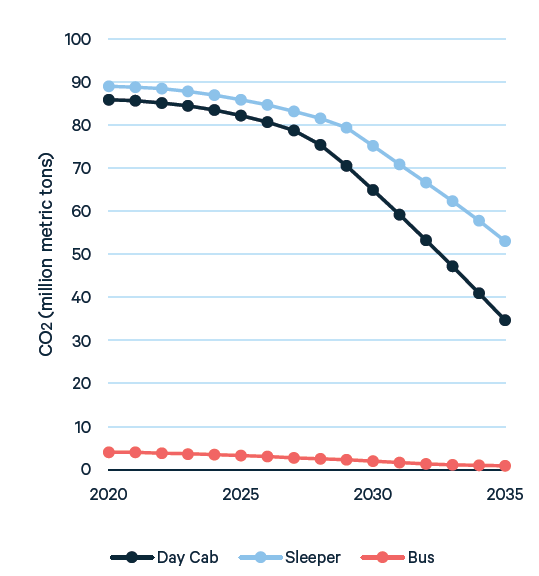
Because CO2 emissions are proportional to the share of electric buses and trucks in the on-road fleet, emissions decline over time as this share in Figure 3 increases. Figure 4 illustrates this relationship, showing that emissions decline gradually over time. Note that baseline emissions also decrease because fuel economy of diesel fuel buses and trucks is projected to increase over time, which reduces CO2 emissions.
Figure 4. CO2 Emissions
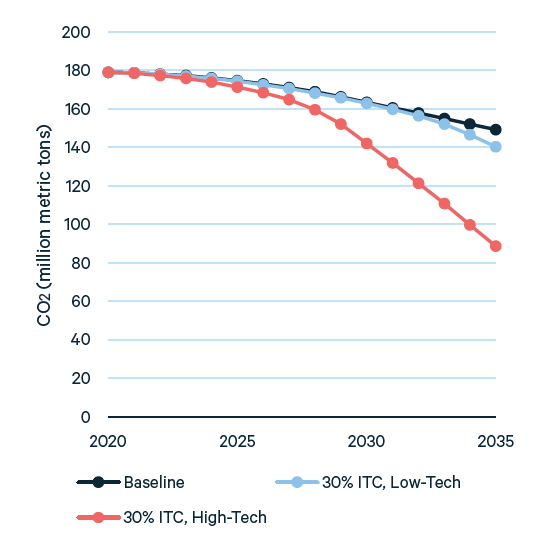
For the low-technology scenario, the subsidies have small effects on emissions through 2035. For example, in 2030, the subsidies reduce emissions by only 0.4 percent of baseline emissions estimates for these vehicle classes (and by 6 percent in 2035). In contrast, in the high-technology scenario, the subsidies cut emissions by 13 percent (21 million metric tons CO2) in 2030 and 41 percent (61 million metric tons CO2) in 2035. These emissions reductions are computed relative to the baseline scenario. The Biden administration’s target is that GHG emissions in 2030 will be half of emissions from 2005. The emissions reduction caused by the subsidy amounts to 1.4 percent of the total emissions reduction needed to meet the Biden target. See footnote 7 above for a description of how we estimate this percentage.
Figure 5 provides additional information about the sources of the emissions reductions for the scenario that includes the 30 percent subsidies and high-technology assumptions. Day cabs account for 62 percent of the total 2030 emissions reductions; sleeper cabs account for 34 percent, and buses for the remaining 4 percent.
Relative to the baseline, 2035 emissions from day cabs decline by a greater percentage (51 percent) than emissions from sleeper cabs (31 percent). As noted above, the subsidy has a greater effect on sales of day cabs and transit buses than sleeper cabs, and emissions from day cabs and buses decline more than emissions from sleeper cabs.
Figure 5. Emissions by Vehicle Type (30 percent subsidy, high-technology)
Combining the results on fiscal costs and emissions allows us to characterize the fiscal cost-effectiveness of the subsidies. The subsidies reduce emissions by causing bus or truck buyers who would have bought a diesel vehicle without the subsidy to instead buy an electric vehicle. In other words, the greater the subsidy’s effect on behavior, the larger the emissions reduction and the lower the fiscal cost per ton of carbon dioxide reduction. On the other hand, fiscal costs are high if many consumers would have bought an electric vehicle in the absence of the subsidy. Those consumers benefit from the subsidy, because they don’t have to pay as much for their vehicles, but there is no effect on emissions. The overall cost effectiveness of the subsidy depends on the behavioral responses and the extent to which the subsidy is claimed by people who would have bought electric anyway.
Table 1 reports the undiscounted fiscal cost per ton of carbon dioxide reduction over the first 5 years (2022-2026), 10 years (2022-2031), and 14 years (2022-2035) of the policy. For each budget window, we divide cumulative expenditures by cumulative emissions reductions. We note that this cost effectiveness assessment includes only emissions and not other potential benefits of electric buses and trucks, such as reducing local air pollution.
Table 1. Fiscal Cost-Effectiveness (USD per ton CO2 reduced)
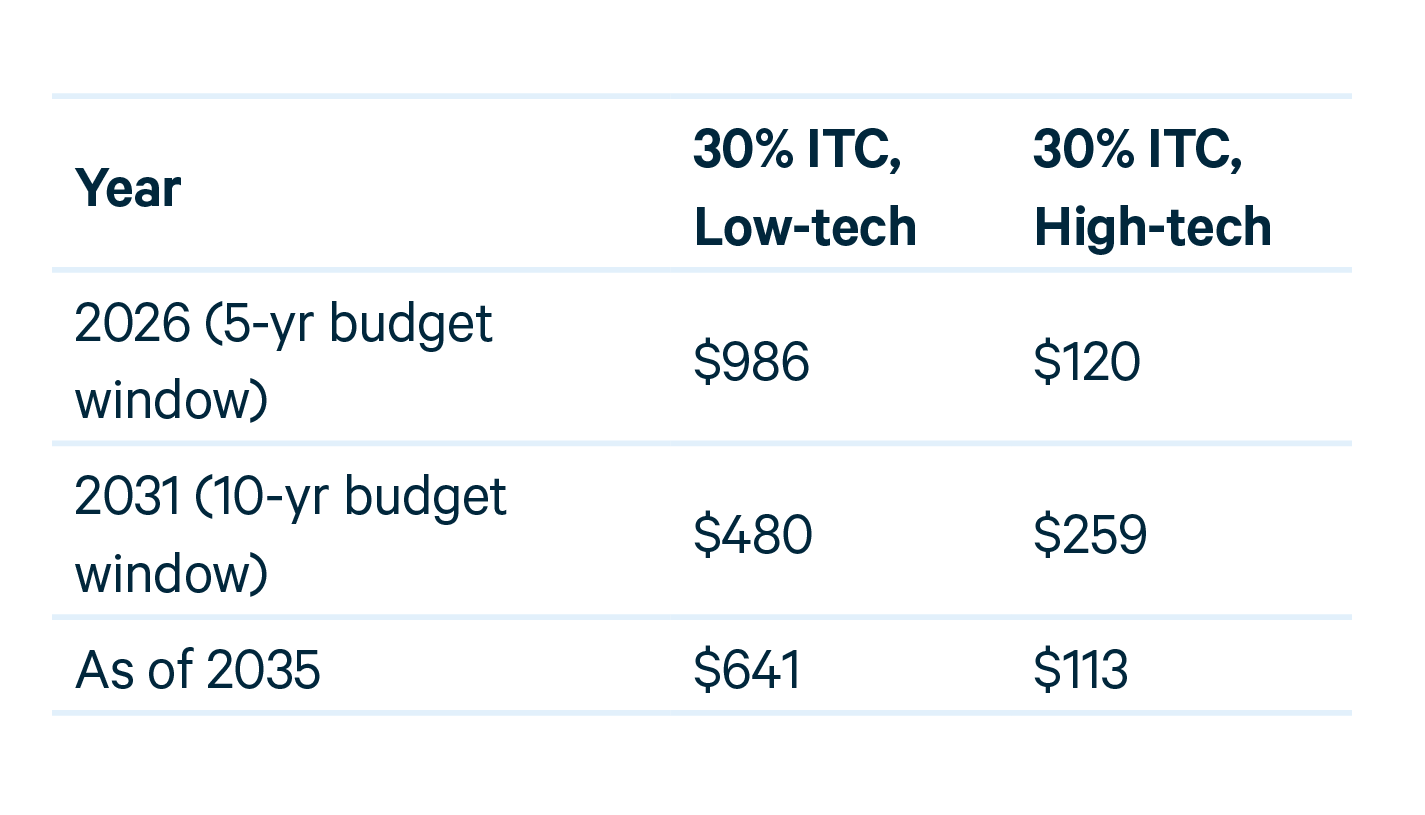
Table 1 shows that in the low-technology case, the average fiscal cost-effectiveness of the subsidy improves over time. The overall average fiscal cost-effectiveness is $641 per metric ton of carbon dioxide, which is better than recent estimates for light-duty vehicles.See Xing, Jianwei, Benjamin Leard, and Shanjun Li (2021). “What Does an Electric Vehicle Replace?” Journal of Environmental Economics and Management v107. Costs per ton reduced are lower for the high-technology scenario. The policy is more cost-effective in the high-technology scenario because the price differential between electric and diesel vehicles is smaller in this scenario. The lower price differential increases the efficacy of the subsidy at raising electric vehicle sales, causing greater emissions reductions than the low-technology scenario.For the high-technology scenario, the fiscal cost per ton of carbon dioxide is higher for the 10-year budget window than for either the 5-year or 14-year budget window. This is because in the high-technology scenario, many bus and truck buyers would have bought electric vehicles even without the subsidy, particularly in the late 2030s. The subsidy has higher fiscal cost per ton than in other periods because when a larger share of the fiscal expenditure is for consumers who would not have purchased an electric vehicle in the absence of the subsidy.
Conclusion
This issue brief presents results from a computational model that characterizes the effects of purchase subsidies for electric buses and trucks. We analyze transit buses, day cabs, and sleeper cabs—which together account for about half of total CO2 emissions from on-road medium- and heavy-duty vehicles.
We simulate the model to compare a baseline scenario (no subsidy for electric buses and trucks) with two policy scenarios, each of which includes a subsidy equal to 30 percent of the electric vehicle purchase price (the same subsidy described in the Build Back Better Act). The subsidy scenarios also include a 30 percent subsidy for construction costs for bus and truck charging infrastructure. The subsidy scenarios differ from one another according to the assumed rate of price declines for electric vehicles. We simulate the model through 2035, and the main outputs include annual new electric vehicle sales, fiscal expenditure, and CO2 emissions from all on-road transit buses, day cabs, and sleeper cabs.
In the baseline scenario, electric buses and trucks are unlikely to achieve substantial sales by 2035. Under the high-technology case, in 2035 the 30 percent subsidy causes electric vehicles to account for about 80 percent of new sales of these three vehicle types and reduces CO2 emissions by 60 million metric tons, which is roughly 40 percent of the forecasted baseline emissions. In the low-technology scenario, the subsidy has a smaller effect, although by 2035 electric vehicles achieve about a 50 percent market share across the three vehicle types.
Fiscal costs per ton of CO2 reduction are broadly comparable to recent estimates for subsidizing electric light-duty vehicles. Federal expenditures between 2022 and 2031 are $24 billion for the high-technology scenario and $2 billion for the low-technology scenario.
Overall, we find that electric bus and truck subsidies can substantially affect new sales, on-road stocks and associated CO2 emissions, and the timing of these effects depends on the pace of battery price reductions. Further work to incorporate additional vehicle classes, hydrogen fuel vehicles, and endogenous technology development could enhance this research, as well as empirical work to evaluate consumer responses to the subsidies in the recently proposed legislation such as the Build Back Better Act.
To view the full issue brief and appendix, click "Download" below.