Projected Effects of the Bipartisan American Affordability and Jobs Act on the Power Sector
In this issue brief, we model how aspects of a broad permitting and energy infrastructure package could drive change in the power sector.
Summary
The Bipartisan American Affordability and Jobs Act (BAAJA) is a broad permitting and energy infrastructure package that would significantly change federal environmental review and project approval processes. Building on many elements of earlier permitting proposals, BAAJA’s reforms would affect both the energy system and other aspects of the environment if the bill were to be signed into law. BAAJA was introduced to the US Senate on September 30, 2026, by Senators Shelley Moore Capito (R-WV), Sheldon Whitehouse (D-RI), Mike Lee (R-UT), and Martin Heinrich (D-NM).
In this issue brief, we model how aspects of the bill could affect the power sector. For our central policy scenario, we find that the modeled elements of BAAJA would have the following effects:
- Drive a robust expansion of the US electrical grid, including long-distance transmission infrastructure, enabling more efficient development and use of additional clean energy and existing resources of all types. By 2041, we project overall transmission capacity to increase by 30 percent over the baseline; interregional transmission capacity more than doubles.
- Reduce the costs of providing electricity, decreasing the average annual costs of the electricity system by 3.5–7.0 percent over the modeled period. BAAJA is projected to save more than $350 billion through 2050 in net-present-value terms, decreasing national electricity prices.
- Deploy additional new clean energy, especially in the near term, displacing generation from higher-emitting sources.
- Reduce emissions, as the enhanced grid and more generation from clean energy reduce the need to run higher-emitting facilities. We project near-term emissions reductions from the power sector of roughly 200 million tonnes (Mt) of carbon dioxide, with cumulative carbon dioxide emissions from the power sector declining by about 1.8 gigatonnes (Gt) through 2041 as compared to the baseline.
Background
Bill Provisions
BAAJA would implement a wide array of reforms for both environmental review and project approval. The legislation would amend the National Environmental Policy Act, the Clean Water Act, the Endangered Species Act, and the National Historic Preservation Act, generally seeking to shorten permitting timelines, clarify the scope of federal reviews, and limit some forms of judicial review. BAAJA also includes provisions to increase certainty for a broad selection of energy projects after projects have received federal approvals; guard against disparate treatment of energy technologies by the executive branch; and facilitate geothermal energy, hydropower, offshore energy, and other infrastructure.
The bill contains substantial reforms to electricity-sector policies, particularly for transmission and interconnection. It would expand the Federal Energy Regulatory Commission’s authority to permit certain interstate transmission lines, establish regional and interregional transmission planning requirements, modify transmission cost allocation, encourage greater use of advanced transmission technologies and existing transmission line rights-of-way, and reform generator interconnection processes. Other provisions would expand wholesale market access for distributed energy resources and establish new requirements intended to prevent the costs of power system investments associated with large data centers from being borne by other electricity customers. (Click here for a section-by-section description of BAAJA.)
Methodology
We use the Regional Energy Deployment System (ReEDS) created by the National Laboratory of the Rockies (NLR), a capacity-planning and dispatch model of the US power system, to evaluate how BAAJA’s provisions could affect the power sector. Key strengths of ReEDS for evaluating BAAJA are its high spatial resolution (90 regions) and its detailed representation of transmission. ReEDS has been used extensively in peer-reviewed publications, as well as by the US Department of Energy for its National Transmission Planning Study and the Transmission Impact Assessment that informed legislative consideration of the bipartisan Energy Permitting Reform Act of 2024.
Our representation of the bill is detailed in the Appendix. In brief, we represent provisions to facilitate the siting and construction of transmission by easing limits on and decreasing costs for the construction of transmission. We increase the capacity of existing lines to represent the widespread adoption of advanced transmission technologies and reduce costs of building spur lines and interconnecting generation on federal lands to account for changes to environmental statutes. Our baseline includes impediments to wind generation associated with executive branch actions and modeled interconnection limits for all generation. We remove both these constraints in our policy cases. We use a high-electrification demand scenario to represent the rapid increase in demand from data centers and other sources. Our central policy case uses NLR’s reference costs for fossil and clean technologies as well as oil and natural gas prices; additional scenarios vary fuel prices as well as clean technology costs (see Appendix).
BAAJA would amend multiple statutes with potentially wide-ranging effects across the energy system and beyond. This study focuses exclusively on the power sector. We do not model the bill’s effects on other sectors nor examine how changes outside the power sector (such as natural gas pipeline development or changes in natural gas exports) could indirectly affect the sector.
Analysis and Modeling Results
Effects on Transmission
Improving the electrical grid is a primary goal for BAAJA. In our central policy case shown in Figure 1, we project that BAAJA would expand transmission capacity of all types by roughly 30 percent over the baseline in 2041. Interregional capacity specifically is projected to grow by 10–15 gigawatts per year between 2032 and 2041, leading to a rough doubling of capacity over the period modeled.
Figure 1. Percent Change in Transmission Capacity from the Baseline
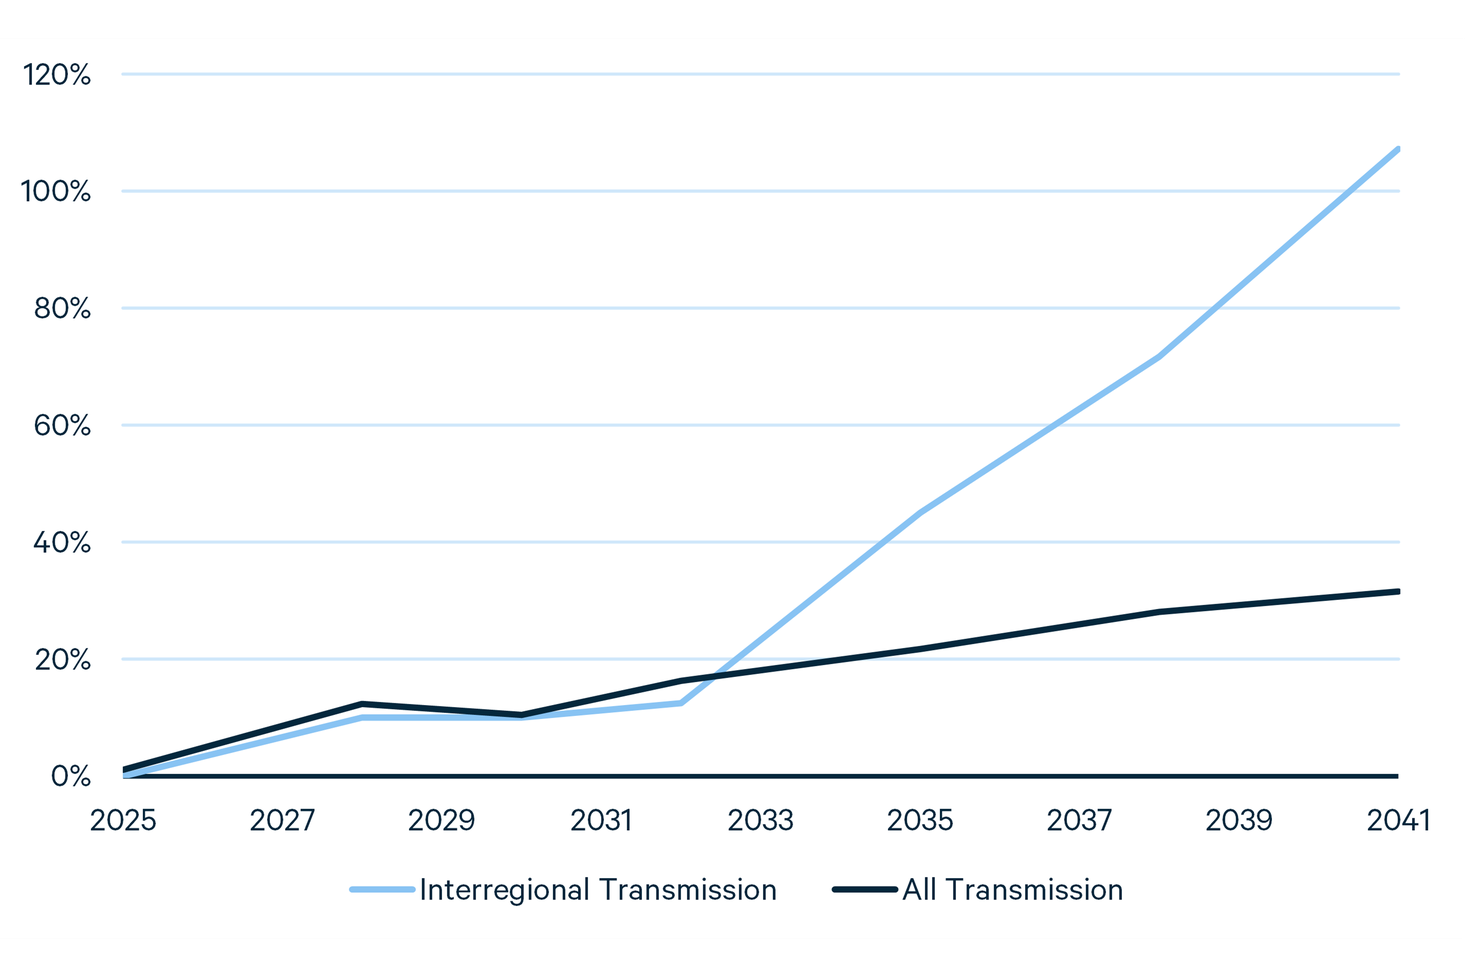
The model finds benefits to the grid in building transmission across all modeled scenarios, including those that rely more heavily on clean energy and those that rely relatively more on natural gas (Figures A1, A2).
Effects on Generation Capacity and Generation
Provisions of BAAJA lead to multiple effects on generation investment and operation over time. In the near term, the primary drivers are provisions intended to increase permitting certainty and consistency across administrations and provisions intended to speed the interconnection of new generation. Over the longer term, interregional transmission expansion changes the relative economic value of different generation technologies.
The modeled impact of BAAJA on generation capacity in our central case is shown in Figure 2. Clean generation capacity increases substantially in the early years, in both the baseline and central policy scenarios. Compared to the baseline scenario, in 2028, the policy scenario leads to roughly 60 gigawatts more clean capacity. There is also a small increase in generation capacity for natural gas combined-cycle, likely due to the removal of the interconnection-queue constraint and a decrease in capacity of other types of gas. Later in the modeling period, the increase in clean capacity driven by the policy persists, but there is less natural gas combined-cycle generation capacity on the grid in the policy case than in the baseline. A relatively small amount of nuclear power is built in the baseline. In the policy case, the model projects renewable energy plus transmission to be a less expensive alternative to deploying additional nuclear capacity. Although demand for electricity is held constant between the baseline and policy scenarios, expanded transmission under the policy allows that demand to be met with less overall capacity.
Figure 2: Generation Capacity in the Baseline and Central Policy Case
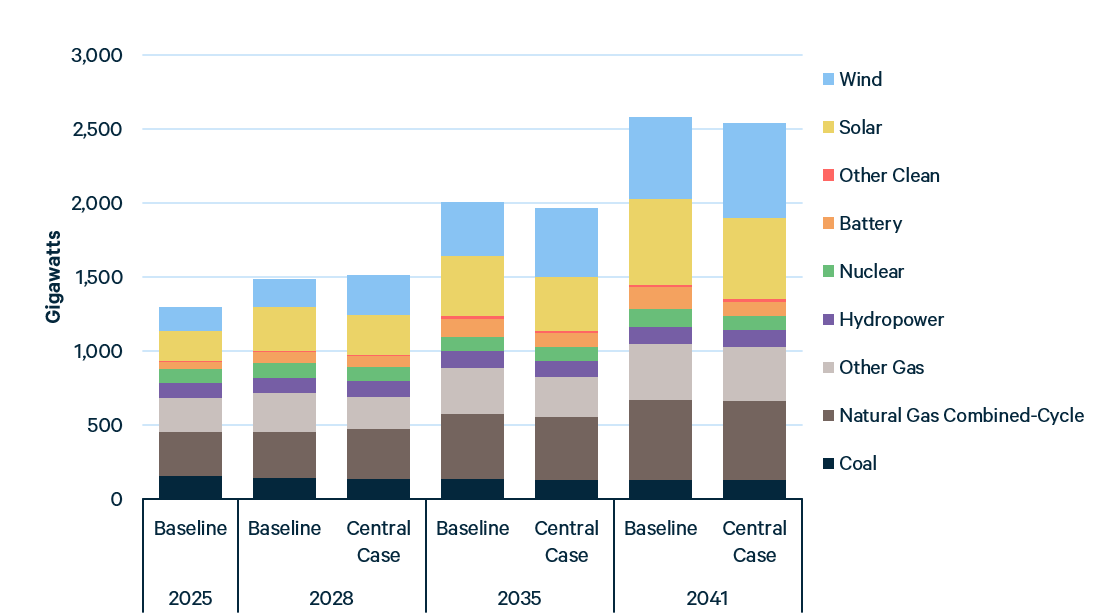
We modeled additional scenarios (not shown) to test the sensitivity of our results to our representation of provisions affecting the interconnection queue and modeled constraints on wind capacity. With respect to the overall build-out of clean energy, the results are robust to changes in these parameters. In particular, the amount of clean energy is roughly comparable across sensitivities by the end of the modeling period, though with a shifted timeline for deployment. This is because, in our modeling, BAAJA incentivizes additional interregional transmission that makes clean energy more valuable to the power sector after 2035.
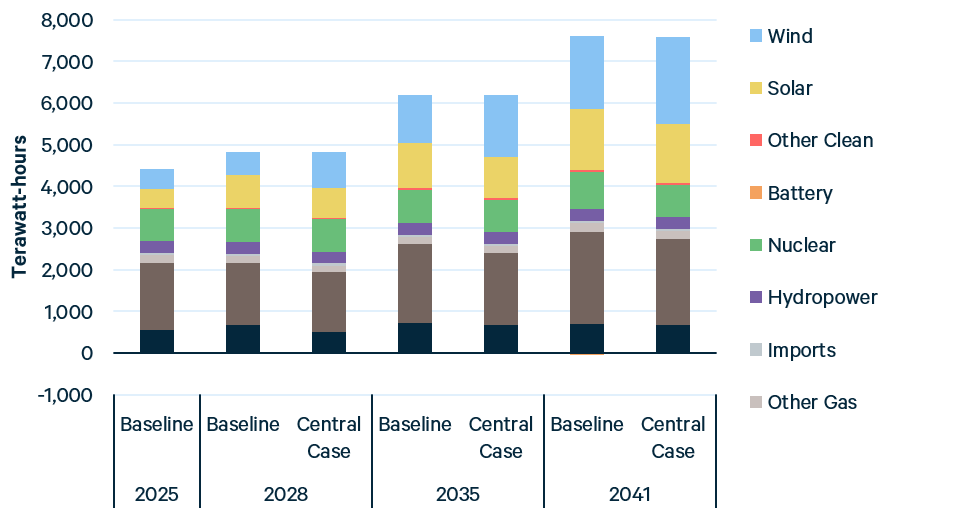
The projected increase in clean capacity in the central policy case leads to a corresponding increase in clean generation (Figure 3). In the near term, as compared to the baseline, the additional clean generation primarily displaces fossil generation, particularly coal. In the medium term, additional clean generation continues to primarily displace fossil energy, but a greater proportion comes from natural gas combined-cycle plants. By 2041, natural gas combined-cycle generation remains lower than the baseline, along with a reduction in generation from nuclear power, as the model finds it more cost-effective to build renewable energy than nuclear generation in the policy case.
Figure 3. Generation in the Baseline and Central Policy Case
Effects on Emissions
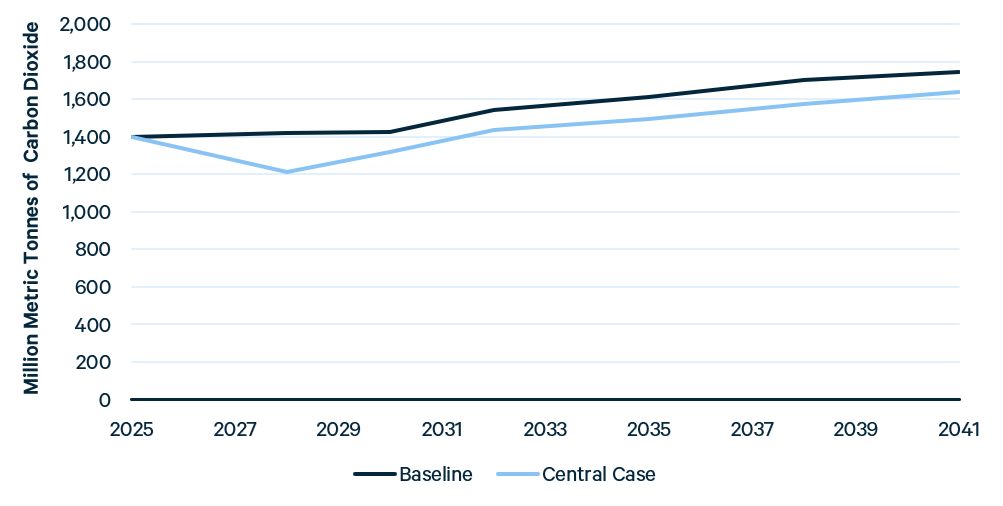
In our baseline scenario, direct power-sector emissions increase from roughly 1,400 Mt of carbon dioxide in 2025 to nearly 1,800 Mt of carbon dioxide in 2041 as the model builds a combination of clean and emitting generation to meet the increasing demand for electricity (Figure 4). The near-term deployment of clean energy in the central policy case, and the consequent displacement of coal and natural gas generation, results in a near-term reduction in emissions of roughly 210 Mt of carbon dioxide (15 percent) from the baseline. Over time, as the baseline electricity mix becomes less emissions intensive, the additional clean energy driven by the policy displaces primarily natural gas combined-cycle rather than coal generation. As a result, emissions in the policy case remain below the baseline in 2041, but the reduction narrows to 107 Mt of carbon dioxide (6 percent). The policy is projected to reduce emissions for the power sector by a cumulative 1.83 Gt through 2041.
Figure 4. Power-Sector Carbon Dioxide Emissions
Effects on Costs
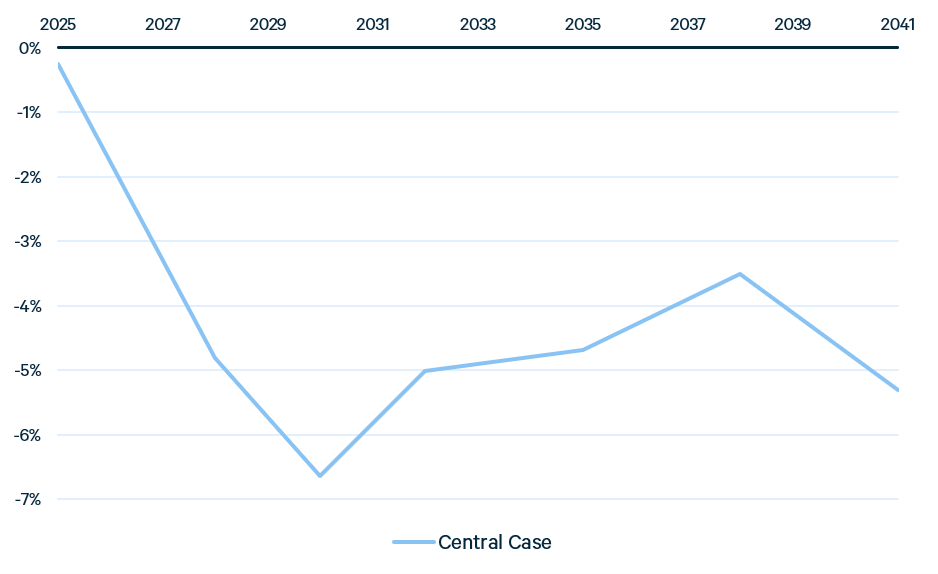
To assess the impact of BAAJA on costs, we evaluate the system cost of electricity (SCOE). The SCOE reflects the operating costs for the power sector as well as annualized payments for capacity, divided by electricity demand. We model that BAAJA will reduce such costs in the central case by roughly 3.5–7.0 percent annually through 2041 (Figure 5).
Figure 5. Percent Change in System Cost of Electricity from the Baseline
We emphasize that the SCOE is not the same as the retail rates seen by customers. The determination of retail rates depends on whether a region is regulated or restructured. Retail rates also include components such as the cost of the distribution network, which are not included in the SCOE. The SCOE is a reasonable proxy for retail electricity rates (ignoring distribution costs) in regulated regions with vertically integrated utilities. We have separately assessed national average wholesale costs of generation in the central case and find that they also decline.
The cost declines are driven by a reduction in fuel expenditures and capital expenditures on new generation and storage, which are partially offset by increases in capital and operating costs for transmission. For the period 2025–2050, we model a reduction in net-present-value costs of roughly $350 billion as compared to the baseline (Figure A4).
Discussion
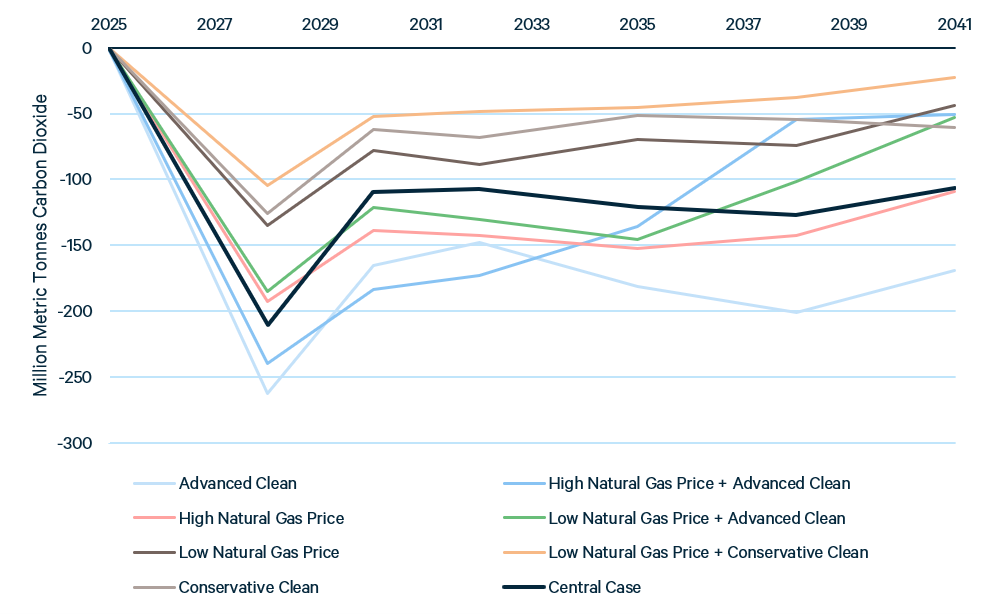
We project the modeled BAAJA provisions to result in a robust build-out of the electrical grid, particularly with respect to interregional transmission, which leads to greater efficiency and usage of all generating resources. Our modeling also projects an increase in clean energy deployment, with electricity generated by the additional clean assets largely displacing generation from fossil resources. These changes to the power sector collectively result in a power system that generates electricity at both reduced cost and reduced emissions from the baseline. We find that, though the details vary, the directionality of the effects is consistent for these metrics across all scenarios explored (see Appendix).
We cannot directly represent some provisions of BAAJA in ReEDS. Provisions not represented include changes to the scope and procedures of environmental review, requirements governing project applications and public input, and changes to judicial review. ReEDS also does not capture potential effects of the bill’s changes to environmental statutes on pipelines, mining, and other activities outside of the power sector. Our representation of the permitting certainty provisions of BAAJA (Sections 1401–1403 of the released bill text) reflects the stated intent of those provisions to ensure durability of federal permits and preclude future disparate treatment of energy technologies through potential executive branch actions. Whether these provisions, as introduced, could have consequences beyond their stated intent remains the subject of active discussion. Our representation does not capture such potential consequences, and our study should be considered with these limitations in mind.
Our modeling evaluates transmission expansion without additional carbon policy, but other studies show that interregional transmission becomes increasingly important as the electricity sector approaches full decarbonization. Although we do not examine a deep decarbonization scenario, these findings suggest that the transmission expansion we project under BAAJA would help enable substantially deeper emissions reductions under future policies.
Appendix
Methodology
We represent the provisions of BAAJA in ReEDS as follows:
Table A1. Baseline and Policy Representation
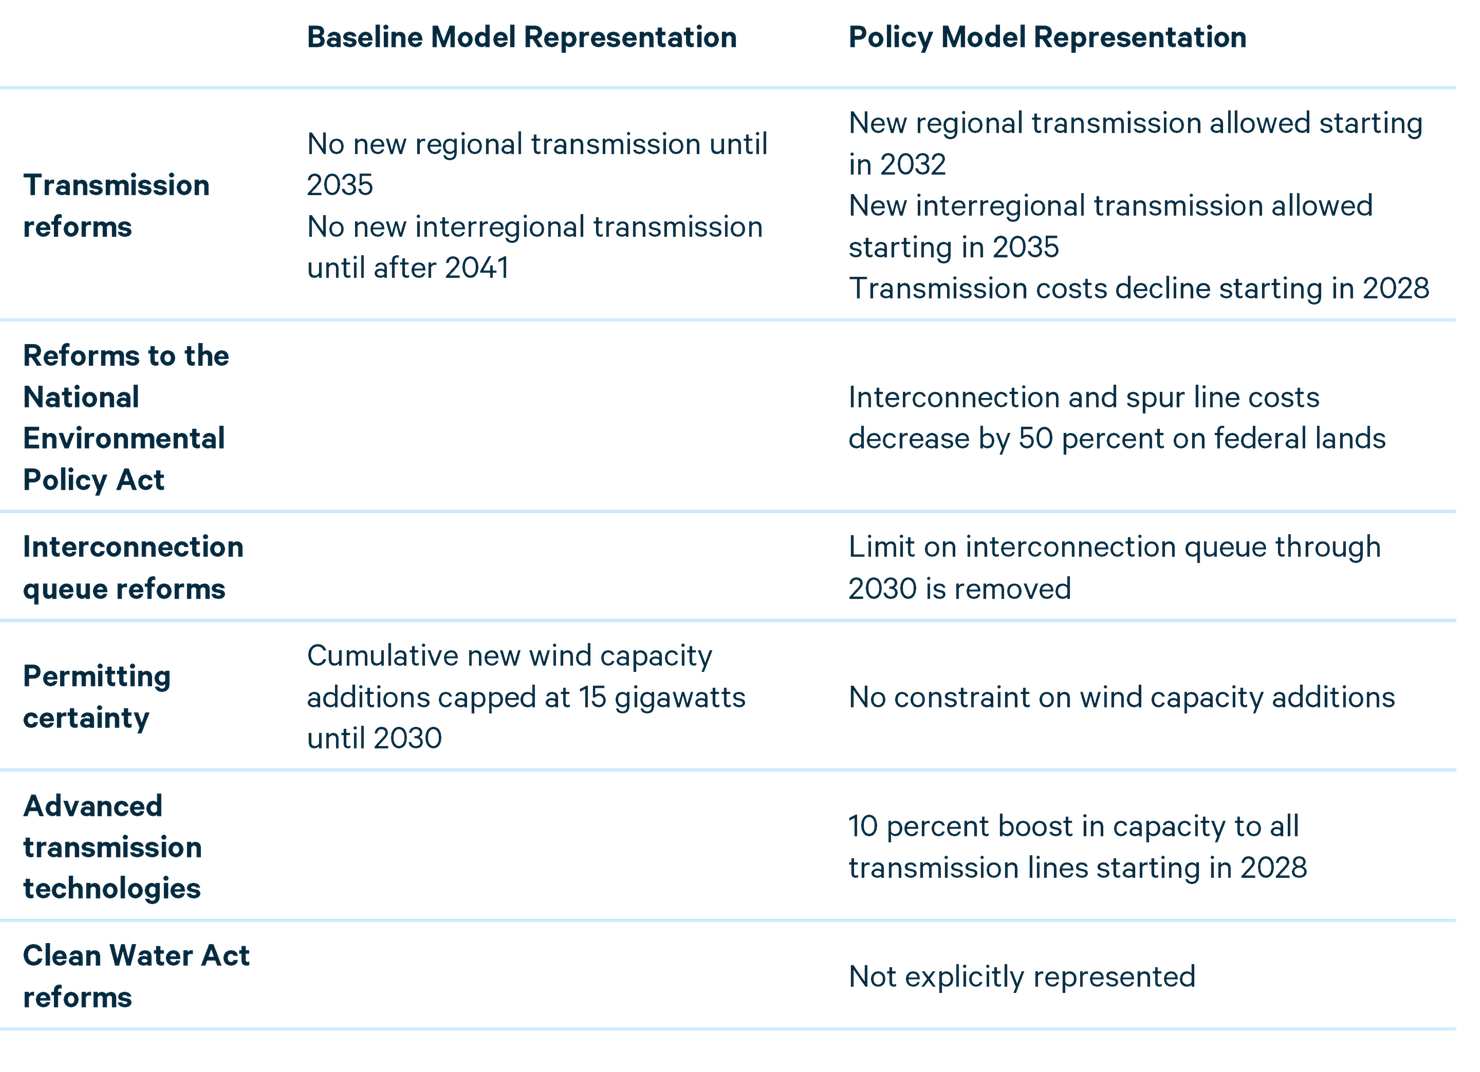
We use the most recent version of ReEDS (forked from commit 43c4732d on July 15, 2026), which includes updates to reflect the repeal of Inflation Reduction Act tax credits for wind and solar in the One Big Beautiful Bill Act. We also include the rescission of the US Environmental Protection Agency’s greenhouse gas regulations for electric power plants. The technology costs, based on NLR’s 2024 Annual Technology Baseline (ATB) Moderate scenario, do not reflect any near-term increases in costs due to tariffs or supply-chain constraints. We use a high electricity demand scenario provided with ReEDS (referred to as “EER2025_100by2050” in the ReEDS documentation) to represent electricity demand from data centers. This scenario has a compound annual growth rate in electricity demand of 2.7 percent.
We note that our representation of the permitting certainty provisions of BAAJA (Sections 1401–1403 of the released bill text) reflects the stated intent of those provisions to ensure durability of federal permits and preclude future disparate treatment of energy technologies through potential executive branch actions. Whether these provisions, as introduced, could have consequences beyond their stated intent remains the subject of active discussion. Our representation does not capture such potential consequences.
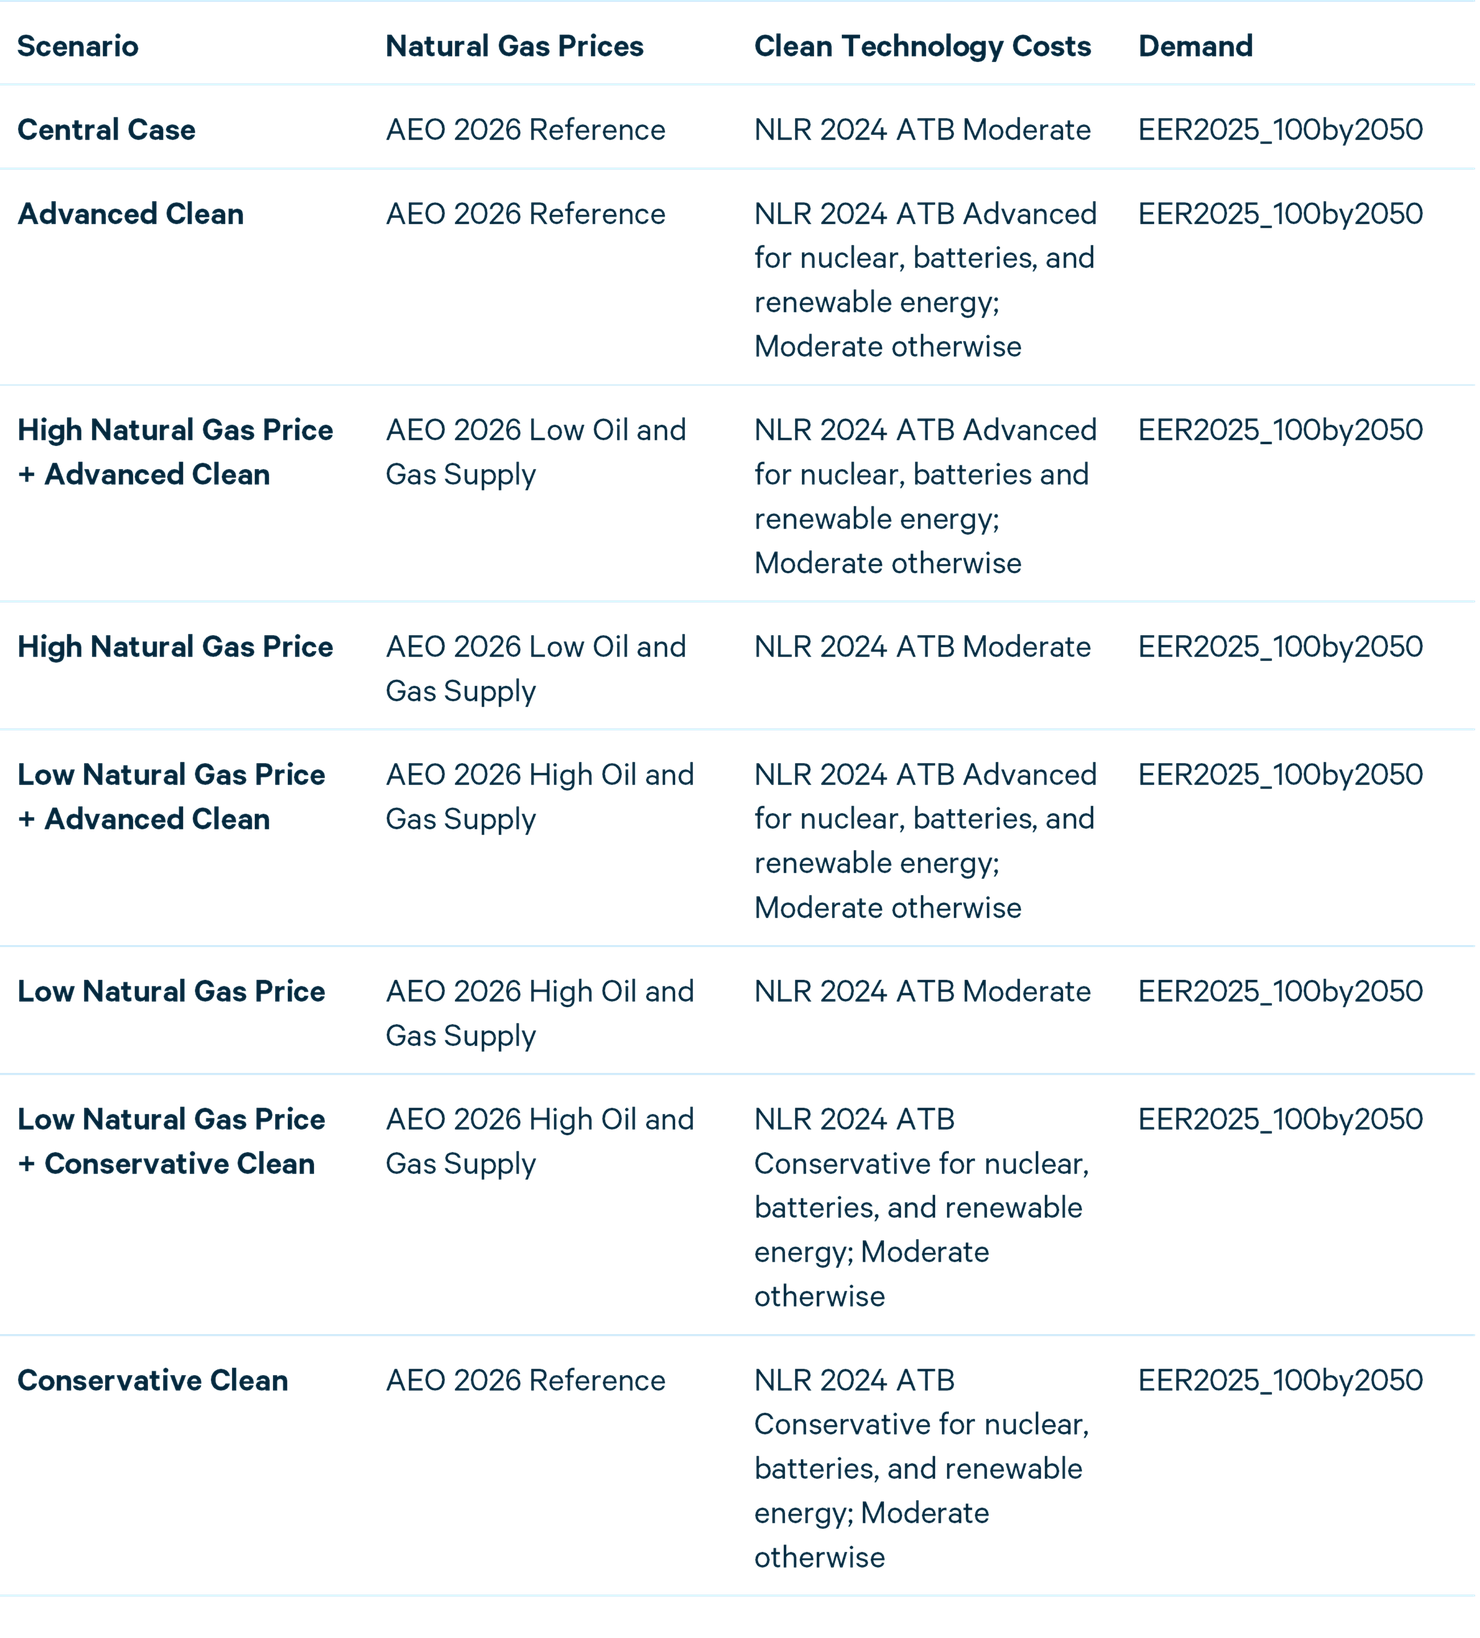
Table A2 details the full set of scenarios modeled. For more details on specific inputs, please see the ReEDS documentation. Note that the advanced scenarios from the NLR ATB have the lowest technology costs, while the conservative scenarios have the highest costs. In addition, the natural gas prices are determined endogenously based on elasticities that are derived from the scenarios in the Energy Information Administration’s Annual Energy Outlook (AEO) given in the table.
Table A2. Detailed Scenario Descriptions
Results from Additional Scenarios
While variation exists across scenarios, particularly with greater amounts of renewable energy deployed in the high natural gas price and advanced clean scenarios and less renewable energy deployed in low natural gas price scenarios with higher cost clean technologies, the overall directionality of the results is unchanged regardless of scenario. Results are shown in Figures A1–A5.
Figure A1. Percent Increase in Interregional Transmission Capacity (All Scenarios Compared to Respective Baseline)
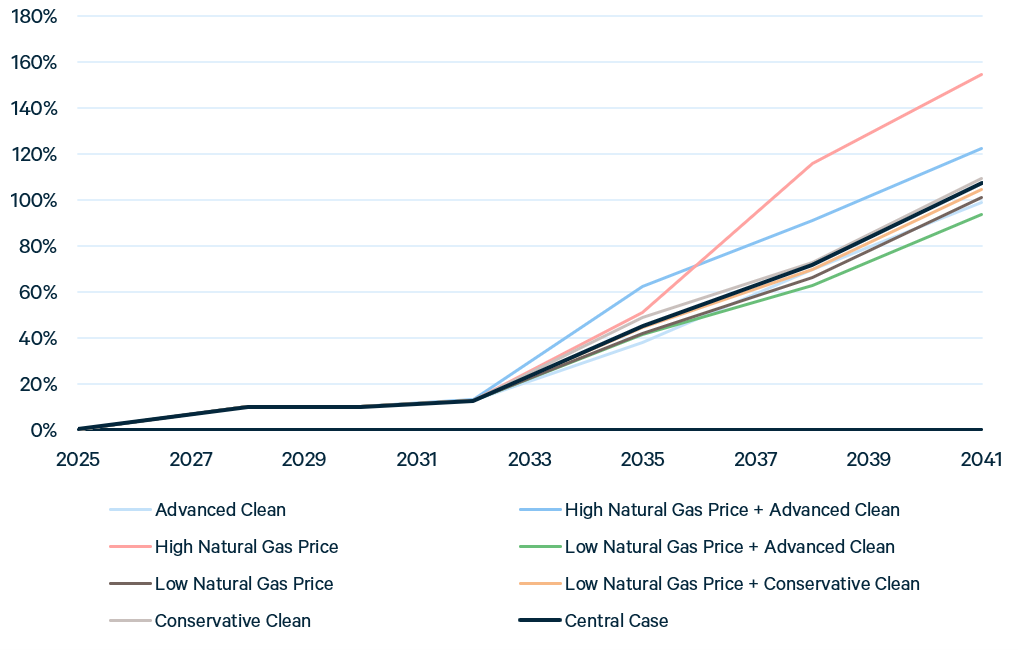
Figure A2. Percent Increase in Overall Transmission Capacity (All Scenarios Compared to Respective Baseline)
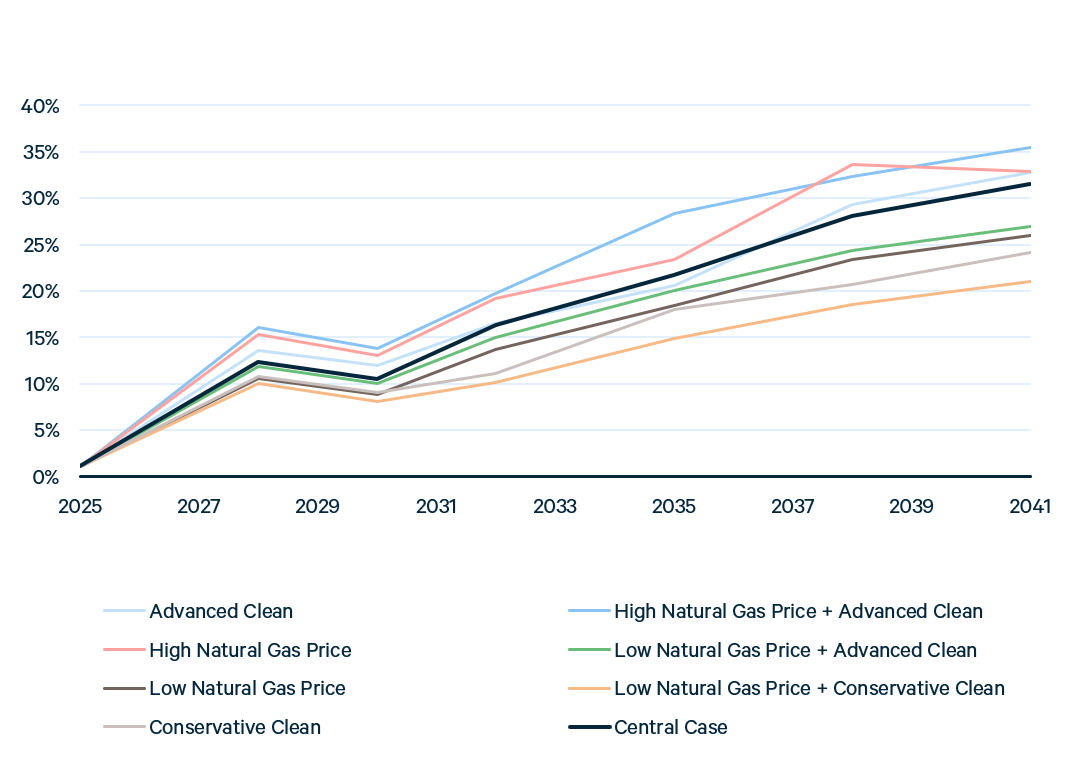
Figure A3. Percent Change in System Cost of Electricity (All Scenarios Compared to Respective Baseline)
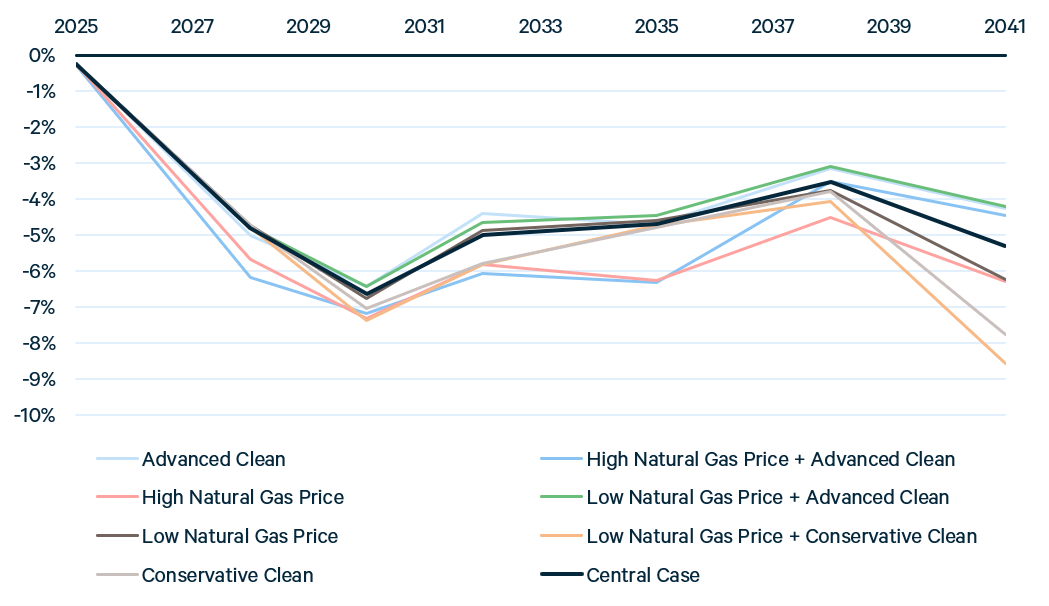
Figure A4. Change in Net Present Value of System Cost of Electricity Through 2050 (All Scenarios Compared to Respective Baseline)
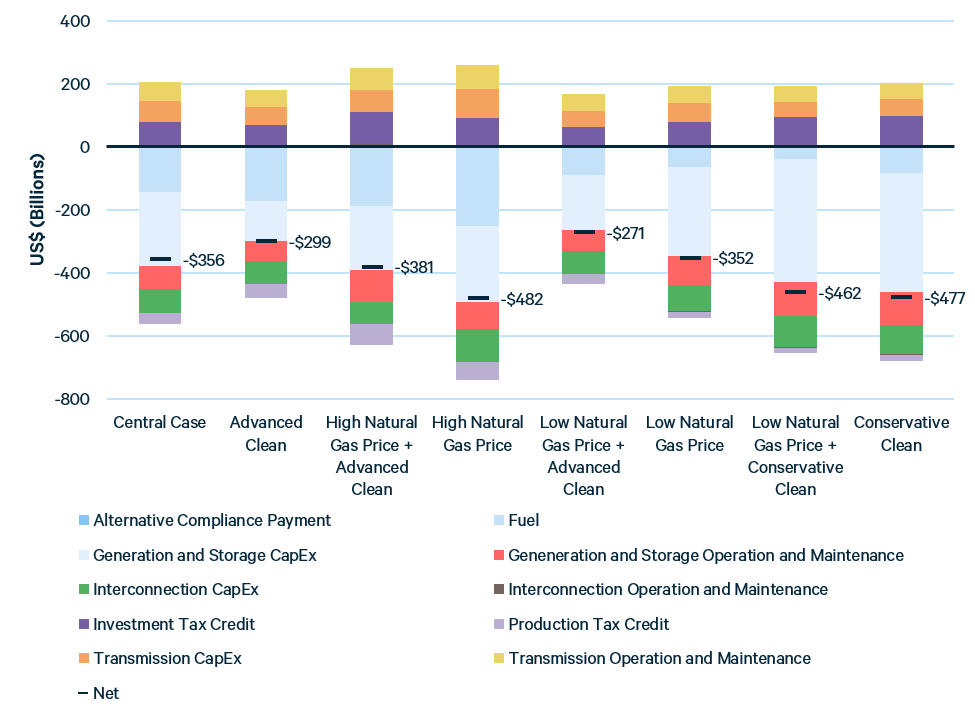
Figure A5. Change in Power Sector Emissions (All Scenarios Compared to Respective Baseline)