State Policy Options to Price Carbon from Electricity in Pennsylvania
In this issue brief, we examine the opportunity to reduce greenhouse gas emissions in the electricity sector in Pennsylvania.
We examine carbon pricing through emissions cap and trade and renewable energy policies. A cap limits emissions and the cap declines over time. Trading of emissions allowances ensures that emissions reductions are achieved where it is least expensive to do so. Policies promoting renewable energy also achieve emissions reductions and can be pursued separately or in combination with cap and trade.
We explore the design of cap and trade by focusing on the important feature of how tradable emissions allowances are initially “allocated.” One option is direct allocation to regulated entities through a method known as output-based allocation (OBA). Another option is to invest allowance proceeds in energy efficiency (EE) or to allocate to local utilities (local distribution companies) for rate relief (LDC). A third option is to make no allocation within the electricity sector, and instead direct allowance proceeds to the General Fund (No AA). We also explore the possibility of linking a cap-and-trade program in Pennsylvania with the multi-state Regional Greenhouse Gas Initiative.
We conduct the analysis using a detailed model of the electricity sector and explore policy scenarios beginning in 2020 and running through 2030. We assume the emissions cap declines by 3% of 2020 levels each year, falling by 30% by 2030. Because what happens in the final year 2030 will be strongly influenced by what is expected to happen in the model after that year, and because that year is so far in the future, we focus our attention on the results for 2026. We present five main findings.
1. Emissions reductions can be achieved at very low cost
Changes in the retail electricity prices are projected to be less than one half of one percent in 2026 relative to business as usual. Figure 1 illustrates that we expect baseline emissions to grow from 93.5 million tons (MT) in 2020 to 116.2 by 2026. This projection is sensitive to assumptions such as future natural gas prices. Three cap-and-trade policy options that are illustrated achieve reductions of over 18 percent compared to 2020 levels and over one-third compared to the expected baseline.
Figure 1. Emissions in 2026 under cap-and-trade scenarios

Cap and trade would achieve cumulative reductions by 2030 of about 209 MT measured from the 2020 emissions level, and 387 MT measured from the projected baseline.
2. Low allowance prices accelerate emission reductions.
We imagine a cap and trade design borrowed from the Regional Greenhouse Gas Initiative (RGGI) with cost control features including an “emissions containment reserve” and a “price floor” as illustrated in Figure 2. These features prescribe minimal prices for sale of some portion of the emissions cap. Ten percent of the allowances will not enter the market at auction prices below the emissions containment reserve price, and no allowances enter at prices below the price floor. These cost management features translate low allowance prices into significant additional emissions reductions.
Figure 2. The allowance supply schedule (2026 prices/2015$)
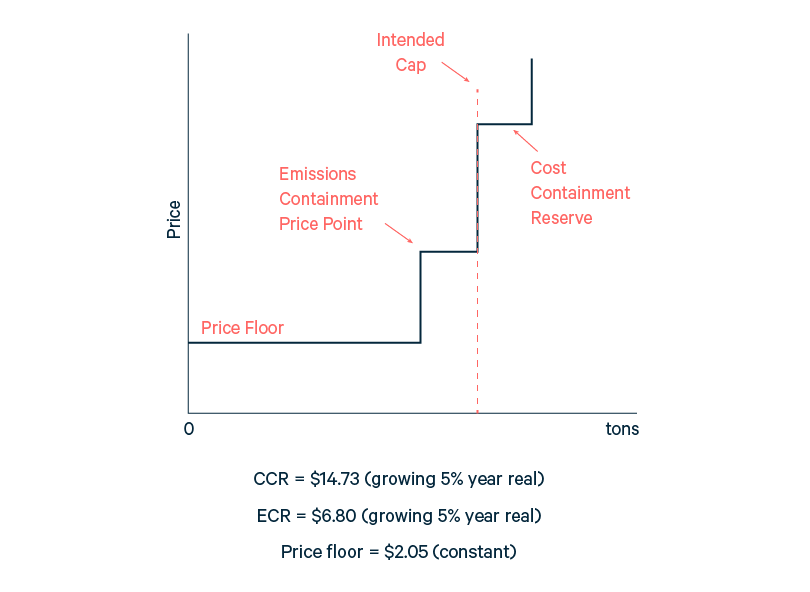
Low prices in Pennsylvania yield 5.1% additional cumulative reductions over the decade, beyond what is required by the cap. The additional reductions are achieved because cost management reduces the number of allowances that enter the market when prices are below the emissions containment reserve price trigger or the price floor.
3. Renewable energy policy achieves emissions reductions at greater cost than cap and trade but also creates clean energy infrastructure.
The renewable energy policy we model requires in-state wind and solar generation to grow by 1% of electricity consumption per year beyond current requirements. By 2026 this policy results in emissions of 113.5 MT, an increase from 2020 levels and a small decrease from the baseline. The renewable policy succeeds in more than doubling the amount of renewable capacity and generation compared to the baseline, and up to 60% more than is achieved under one approach to cap and trade. However, some approaches to cap and trade achieve greater renewable generation. A combination of policies is an option used by many states.
4. The “trade-ready program design” we model could link seamlessly with the Regional Greenhouse Gas Initiative.
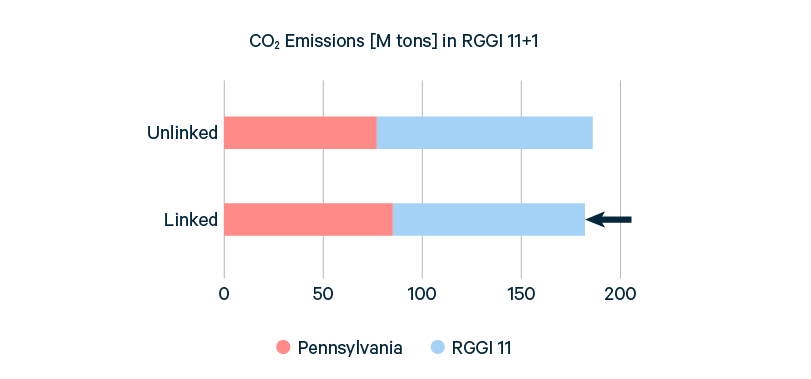
Adopting the RGGI program design makes linking straight forward. Allowance prices in Pennsylvania are similar to prices expected in the eleven state RGGI region (including VA and NJ) so linking results in little shift of emissions, and in fact slightly reduces total emissions in the combined region due to cost management features, as illustrated by Figure 3 for the OBA allocation scenario. Linking provides greater resiliency for the program and stability for allowance prices in face of uncertain weather, fuel prices, etc., while preserving state autonomy and programs.
Figure 3. CO2 emissions fall when the programs are linked.
5. Emissions leakage is moderate.
An increase in emissions from sources not covered by the program could be up to one-third of the reductions in state. Linking reduces leakage, and some design options result in negative leakage (national emissions reductions that are greater than those in Pennsylvania).
For more information read the full study (below).