Will Nations Meet the Paris Agreement’s Emissions and Temperature Goals?
An issue brief calculating the probability of the world meeting the Paris Climate Agreement’s emissions reduction and temperature targets.
1. Context
The Paris Agreement’s first Global Stocktake (GST) is set to conclude at the 28th Conference of the Parties to the United Nations Framework Convention on Climate Change (COP28) in late 2023. The GST is the means by which parties to the Paris Agreement monitor progress towards its goals, including Article 2’s goal of limiting warming to between 1.5 °C and 2 °C above preindustrial levels and Article 4’s goal of peaking greenhouse gas emissions as soon as possible. However, as the UN Environment Programme stresses in the latest Emissions Gap Report, the window to achieving these goals is closing rapidly.
In the vast majority of literature assessing future socioeconomic, energy, and climate systems, projections for emissions scenarios are based on current policies, nationally determined contributions, or hypothetical socioeconomic “pathways”—or are designed to target specific degrees of temperature rise. While these scenarios are informative for policymakers, they do not provide information on their relative likelihoods, which limits their value for assessing the probability of meeting Paris goals.
2. Methods
As part of a broader project estimating the social cost of carbon (SCC), Rennert et al. (2022). Comprehensive Evidence Implies a Higher Social Cost of CO2. Nature. a multi-institution, interdisciplinary team of researchers led by Resources for the Future (RFF) developed the RFF Socioeconomic Projections (RFF-SPs), which include multi-century probabilistic projections of annual global population, income per capita, and greenhouse gas emissions from the present through 2300. Rennert et al. (2021). The Social Cost of Carbon. Brookings Papers on Economic Activity.
They are scientifically derived “best-guess” estimates based on a combination of demographic and econometric models and structured expert judgement surveys, and they reflect implicit expectations and uncertainties about the evolution of global climate policies over time.
The country-level population projections Raftery and Ševčíková (2023). Probabilistic Population Forecasting: Short to Very Long-Term. International Journal of Forecasting. in the RFF-SPs are based on the same fundamental methodology used for the UN World Population Prospects report, which provides historical and forecasted population data from 1950 to 2100. The corresponding country-level GDP per capita trajectories Müller, Stock, and Watson (2022). An Econometric Model of International Growth Dynamics for Long-Horizon Forecasting. Review of Economics and Statistics. are based on a statistical model featuring a global economic growth frontier and projected country-specific deviations therefrom. Probabilistic projections from that statistical model are then weighted using data from an expert elicitation of long-run growth trajectories, the latter of which takes on increasing weight further into the future.
Taking into account those uncertain GDP per capita trajectories, a separate group of experts provided uncertainty ranges for CO2, CH4, and N2O emissions, contingent on future economic conditions. This approach allows the RFF-SPs to characterize uncertainty in emissions jointly with the uncertainty range of economic growth. The group of leading scholars that were surveyed on socioeconomic projections and climate policy encompassed a diverse range of perspectives, including key developers of the Shared Socioeconomic Pathways (SSPs) employed by the Intergovernmental Panel on Climate Change (IPCC).
In addition to emissions sources such as the energy and transportation sectors, the RFF-SPs account for agriculture, forestry, and land use, other natural carbon stocks, and negative emissions technologies. This allows for direct comparison with the commonly used combinations of the IPCC SSPs and the Representative Concentration Pathways (RCPs).
In this submission, we use the RFF-SPs to address the Paris Agreement’s Article 4 goal of peaking emissions as soon as possible by calculating the implied probability of that peak occurring in each future year. We also estimate the likelihood of meeting the long-term temperature goals of the Paris Agreement—given current understanding of a future of evolving climate policy—by using the probabilistic RFF-SPs in combination with the FaIR v1.6.2 climate model.
3. Results
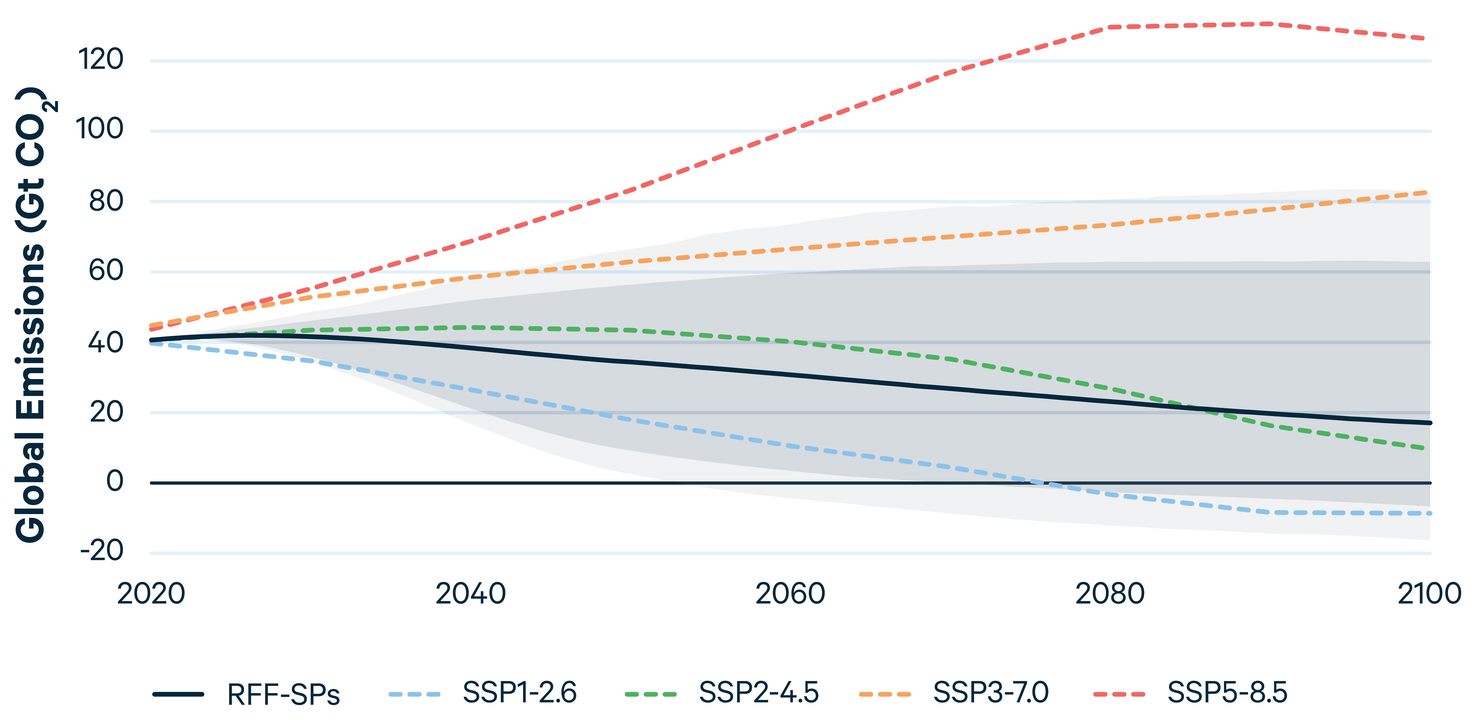
As shown in Figure 1, the RFF-SPs’ emissions trajectories generally span the range of the SSP-RCP combinations, except that SSP5-RCP8.5 is a strong outlier, exceeding the 99th percentile of the RFF-SPs uncertainty range. The median (50th percentile) of the RFF-SPs’ emissions projections aligns most closely with SSP2-RCP4.5 but differs in important ways.
Figure 1. Annual global net CO2 emissions (gigatons CO2) as projected by the RFF-SPs and SSP-RCP combinations
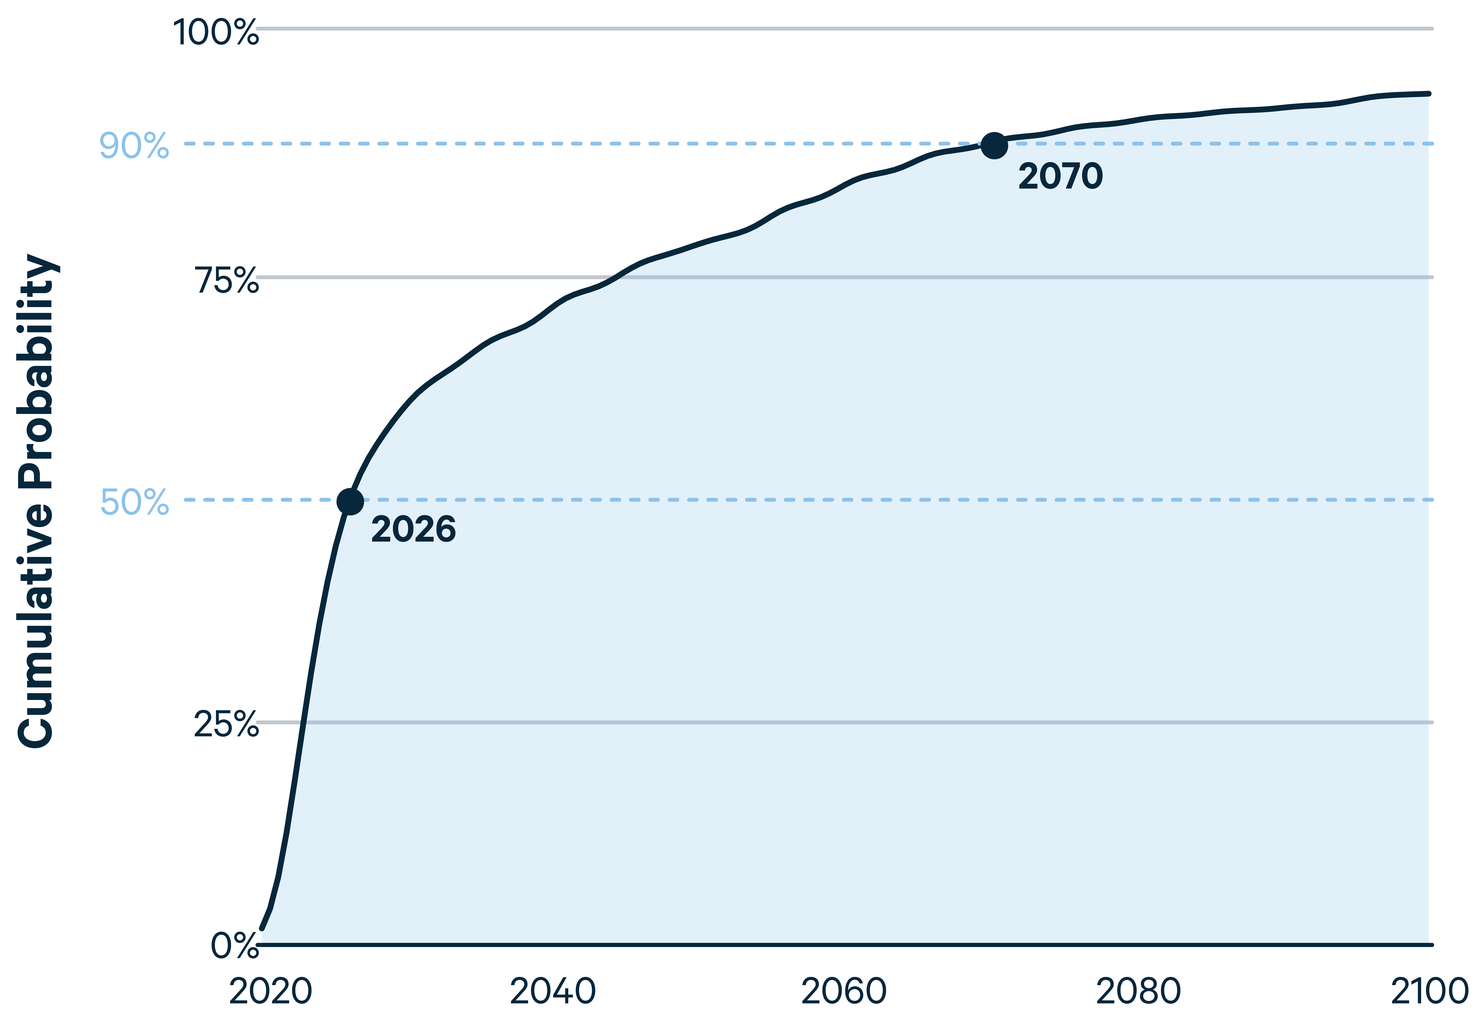
The RFF-SPs imply a 50 percent probability that CO2 emissions peak by 2026, as shown in Figure 2. By comparison, the latest analysis from the International Energy Agency projects global energy-related emissions peaking in 2025 even in its least ambitious “Stated Policies” scenario. International Energy Agency (2022). World Energy Outlook 2022. Nonetheless, the RFF-SPs suggest a substantial probability that peak emissions do not occur until well after 2026, due to the potential for both enhanced and weakened future policy ambition, the potential effects of a range of future economic conditions on emissions, and potential changes in non-energy-related emissions. The projections do not yield 90 percent confidence about emissions beginning to decline until 2070. This outcome, on the more pessimistic end of the broad range of the RFF-SPs, falls far short of the net-zero emissions required in that year in order to have a two-thirds chance of achieving the 2 °C Paris Agreement goal. Intergovernmental Panel on Climate Change (2018). Global Warming of 1.5 °C.
Figure 2. Cumulative probability of CO2 emissions peaking in the RFF-SPs, by year
Including both use of fossil fuels and land-use change, about 2,500 gigatons of CO2 have been emitted worldwide since the beginning of the Industrial Revolution. Friedlingstein et al. (2022). Global Carbon Budget 2022. Because future temperatures are closely related to cumulative emissions, Leduc et al. (2016). Regional estimates of the transient climate response to cumulative CO2 emissions. Nature Climate Change. it can be illustrative to compare cumulative emissions projections to carbon budgets corresponding to particular levels of temperature increase. Figure 3 shows future cumulative emissions derived from the RFF-SPs, with dashed horizontal lines corresponding to the levels of cumulative emissions that the IPCC Sixth Assessment Report (AR6) associates with 50% probabilities of exceeding 1.5 °C and 2 °C temperature thresholds (adjusted for different starting years). These results suggest that keeping temperatures below the 2 °C threshold will require emissions reductions on the more optimistic side of our experts’ predictions, and that overshooting the 1.5 °C threshold is highly likely.
Figure 3. Cumulative global net CO2 emissions (gigatons CO2) as projected by the RFF-SPs, compared to AR6 carbon budgets for 1.5 °C and 2 °C temperature thresholds

With respect to temperature projections, Figure 4 shows the median and uncertainty ranges for global mean surface temperature produced by the FaIR v1.6.2 climate model driven by the RFF-SP emissions trajectories. Again, the temperature trajectories generally span the SSP-RCP combinations, with the median most closely matching SSP2-4.5 and with SSP5-RCP8.5 as an outlier. These trajectories suggest that the question of surpassing a 1.5 °C increase is more one of “when” than of “whether”.
Figure 4. Annual global surface temperature change (˚C) relative to pre-industrial levels (1850-1900 average) as projected by the RFF-SPs and SSP-RCP combinations

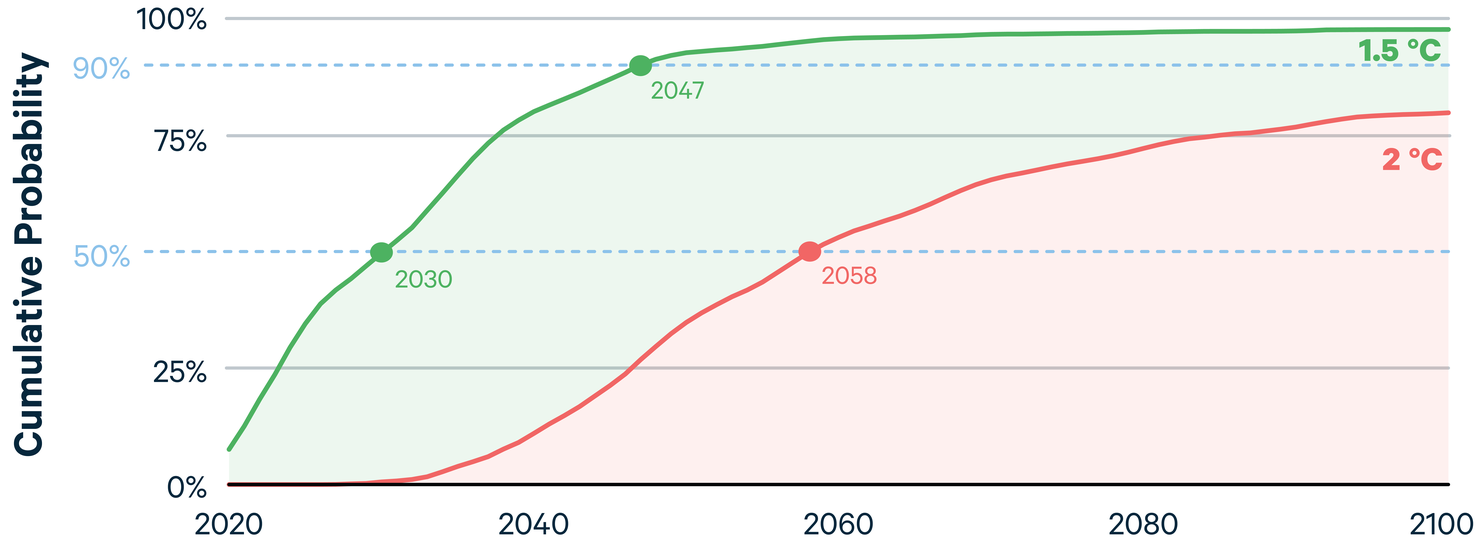
Accounting for uncertainties in the RFF-SP emissions projections and the climate system represented within FaIR, we find a 50 percent probability that global temperature increases will exceed 1.5 °C by 2030, as shown in Figure 5. This result is comparable to the recent estimate by the World Meteorological Organization of a 50 percent probability of crossing the 1.5 °C threshold by 2026. World Meteorological Organization (2022). 50:50 Chance of Global Temperature Temporarily Reaching 1.5 °C Threshold in Next Five Years. Because FaIR reflects long-term trends, rather than interannual fluctuations, the 90 percent probability of exceeding a 1.5 °C increase by 2047 indicated by the RFF-SPs should be interpreted as crossing that threshold on a sustained, multi-year basis. However, the RFF-SPs do not rule out the possibility that negative emissions could bring temperature increases below 1.5 °C again in the future.
The projections indicate a 50 percent probability of remaining below the 2 °C threshold through 2058. The fact that we do not reach a 90 percent probability of crossing over the 2 °C threshold before 2100, along with the multi-decadal uncertainty ranges associated with all of the projections we present here, provides hope that nations may still prevent the worst impacts of climate change through actions of sufficient speed and scale.
Figure 5. Cumulative probability of exceeding 1.5 and 2 °C temperature thresholds, based on the RFF-SPs and the FaIR v1.6.2 climate model, by year