Shaping Land Use Patterns in the Wildland-Urban Interface: The Role of State and Local Governments in Reducing Exposure to Wildfire Risks
This report reviews the policies, funding mechanisms, and planning efforts that influence land use in wildfire-prone wildland-urban interface areas, arguing that current approaches inadequately address wildfire exposure.
Abstract
Development in the wildland-urban interface is increasing exposure to wildfire risks in the western United States. Yet, among the components of risk—hazard, vulnerability, and exposure—mitigating exposure has arguably been most difficult. In this report, we describe the set of interconnected state and local policies that affect development and risk exposure, including local land use planning and zoning, state policies governing insurance, building codes, and infrastructure spending, as well as the role of states as intermediaries between the federal government and localities. We discuss various plans that local governments develop, including Comprehensive Plans, Hazard Mitigation and Community Wildfire Protection Plans, and Comprehensive Economic Development Strategies, and we argue that in most communities, these plans do not adequately address the exposure component of the wildfire risk problem or provide potential resilience solutions that address exposure. We suggest a number of policy directions, including changes to planning requirements, creative zoning options like wildfire resilience overlays, and incentives that states and the federal government may be able to use to direct growth toward lower risk areas.
1. Introduction
Wildfire costs are on the rise in the United States, and increasing exposure from population growth in high-hazard areas is a significant contributor. The number of people living in the wildland-urban interface (WUI), the area where developed lands meet forests and other natural lands, roughly doubled between 1990 and 2010 and grew by 160 percent in areas with the highest wildfire hazard (Rao et al. 2022). Although WUI growth appears to have slowed in recent years, an estimated 40 percent of US homes in the interior West and the Southeast are in the WUI (Radeloff et al. 2023). In a recent study that looked at growth in jobs and wage income, Joiner et al. (2025) found that job growth in the western United States over the 1990–2020 time period was highest in the highest wildfire risk areas.
Reducing exposure to wildfire risks is critical for containing wildfire costs, but exposure is arguably the most challenging part of the wildfire problem. Multiple factors affect where people choose to live, and disentangling them in a way that provides guidance for policy is difficult. In addition, local governments play a central role in managing land use but are often disinclined to use the tools at their disposal—namely zoning codes—to curtail development or shift development patterns for several reasons. First, they rely heavily on property tax revenues to pay for public services and are concerned about stagnating or falling revenues if development is restricted. Second, they worry about being exposed to taking lawsuits from development restrictions. Third, a housing affordability crisis has many communities looking for ways to increase housing supply however they can. Finally, even when these problems can be overcome, it is hard for communities to know when their land use rules are striking the right balance between management of risks and other important aspects of quality of life.
While state policy also influences development patterns, it does so indirectly. States regulate insurance, make decisions about infrastructure spending, provide funding to communities for hazard mitigation, approve local hazard mitigation plans, and sometimes establish building codes and home risk disclosure requirements. They also play important intermediary roles between the federal government and localities. All these things matter in ways large and small for housing demand and supply and the extent of exposure to risk, but fully understanding the impacts is challenging and research in this area is scarce.
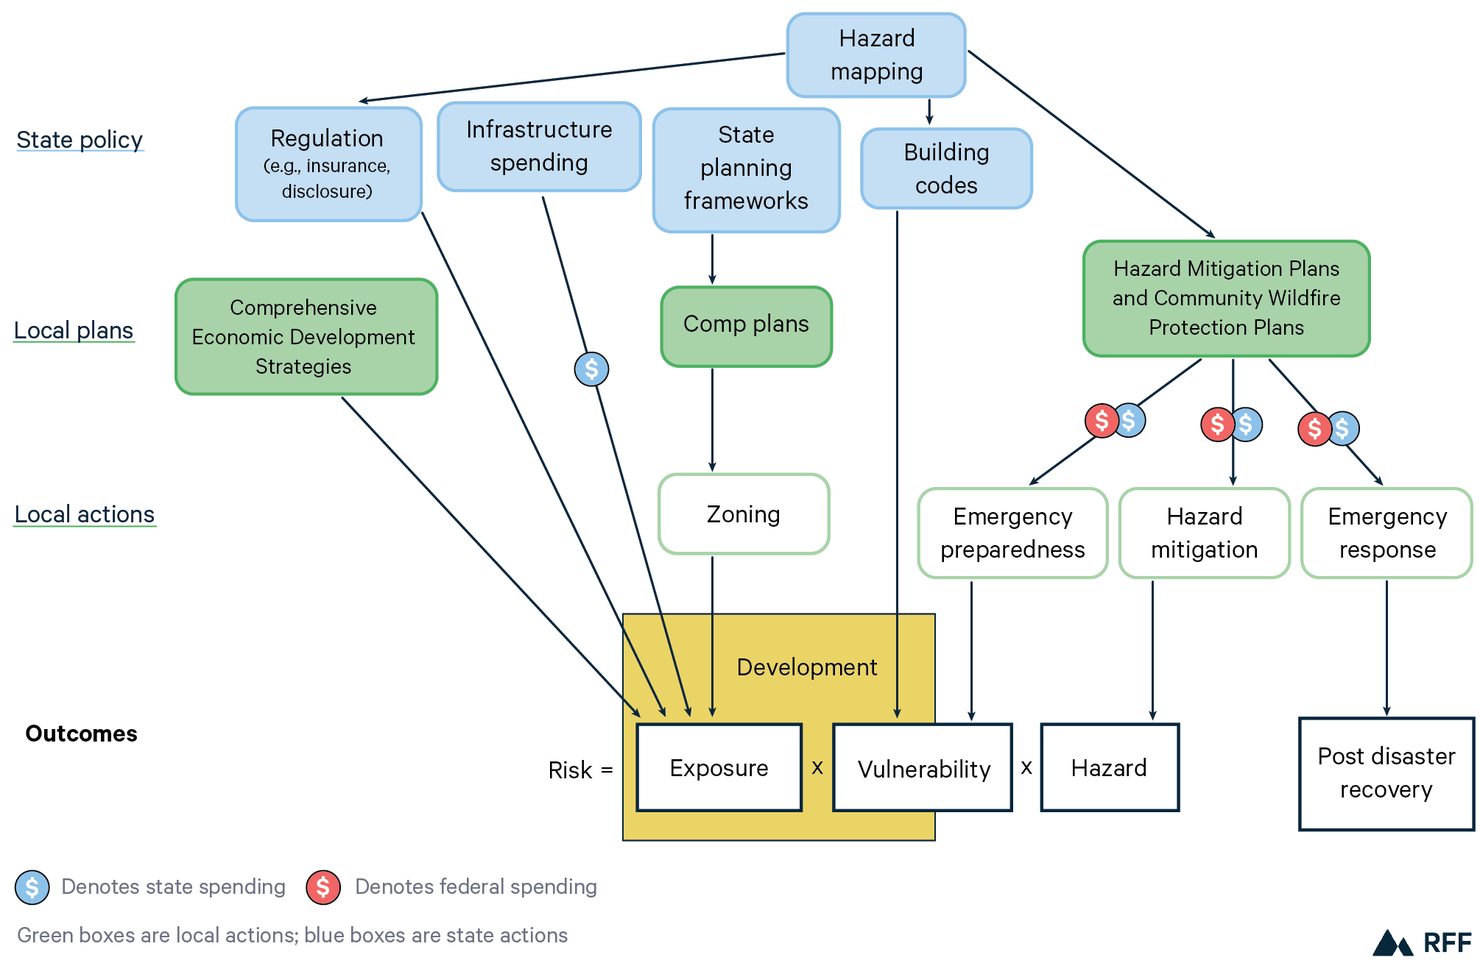
In this report, we review the complex system of state and local policies and programs, funding streams, and local actions that directly and indirectly affect land use in high wildfire hazard areas. This system is illustrated in Figure 1. Arrows show how federal, state and local policies, plans, and actions affect risk through three channels: hazard—the likelihood of a wildfire occurring; exposure—the degree to which people and property are in harm’s way; and vulnerability—the tendency of people and the built environment to sustain harm. State policies (shown in blue boxes) include various regulations, such as wildfire hazard disclosure mandates and insurance requirements, infrastructure spending, and building codes, and state planning frameworks that guide local comprehensive plans. Local governments are responsible for developing comprehensive plans, Hazard Mitigation Plans (HMPs), Community Wildfire Protection Plans (CWPPs), and, sometimes, in conjunction with regional planning groups, Comprehensive Economic Development Strategies (CEDS). Those plans provide the foundation for various local programs and regulations. Comprehensive plans provide a vision that guides zoning regulations, which determine exposure. CEDS guide business and job growth, also a factor in exposure. HMPs and CWPPs are the foundations for local hazard mitigation and emergency preparedness activities and are prerequisites for several state and federal funding programs, depicted by the blue and red dollar signs in the diagram. These plans and funding streams affect hazard and vulnerability. The plans and funding also go toward emergency response programs, which impact post-disaster recovery. We use this figure as a guide for our study and discuss the elements of it in more detail in the following sections.
Figure 1. Connections Between State and Local Policies and Wildfire Risk
Our report highlights the ways in which policies and programs currently fall short in addressing risk exposure and offer some changes that could potentially address the problem. We review local options for shifting development patterns in communities, encouraging relatively more development in low-risk areas and less in high-risk ones, and we discuss leverage points that state governments and the federal government can use to encourage action at the local level. We also identify gaps in knowledge and suggest further analysis that could help move these changes forward.
Population growth in high-risk areas creates a compounding problem for communities. In addition to increasing ignitions and structure-to-structure fire spread, population growth raises the cost of fire suppression and has ripple effects in housing and insurance markets. Our report emphasizes the importance of this piece of the wildfire risk puzzle, discusses how it has received less attention in the policy world than hazard mitigation, and offers some ways to improve current policies and programs.
2. Wildfire Risks and the Wildland-Urban Interface
In recent decades, wildfire hazards have increased due to the combined effects of climate change (Abatzoglou & Williams 2016), increases in human-caused ignitions (Balch et al. 2017), and, in some regions, heavy fuel loads resulting from decades of fire exclusion (see e.g. Taylor et al. 2016, Wu et al. 2023). More and larger fires in the western United States have led to a roughly threefold increase in annual area burned over a 20-year period—from a median of just under 1 million acres per year between 1984 and 1998 to approximately 3.5 million acres per year between 2005 and 2018 (Iglesias et al. 2022).
These trends have occurred against the backdrop of an expanding wildland-urban interface that has increased exposure. Wildfire hazard is not a definitional feature of the WUI; however, in regions where wildlands are characterized by regular or intermittent wildfires, the WUI is where people and property face the most imminent threat. Both WUI area and the number of homes in the WUI have increased over the past four decades. A 2023 Forest Service report shows that between 1990 and 2020, the WUI area grew by 31 percent, and the number of homes in the WUI grew by 47 percent (Mockrin et al. 2023).
2.1. Why Do People Live in the WUI?
Understanding the factors that affect population growth and housing development in the WUI is challenging. In general, people make decisions about where to live based on housing costs, income, preferences, and access to jobs. They may have preferences for amenities that are correlated with wildfire risk, such as proximity to public lands and views of forested landscapes. Many economic studies have found that proximity to open space, parks, and public lands is highly valuable (McConnell and Walls 2005; Walls et al. 2015), affects where people live (Walsh 2007), and contributes to measures of quality of life (Akhundjanov and Jakus 2023).
In areas with natural hazards, households typically weigh these locational attractions against risks. Only a few studies have analyzed these tradeoffs in systematic, data-informed ways. Bakkensen and Ma do this in a residential sorting model of flood risks (Bakkensen and Ma 2020), and Ma et al. (2024b) take a similar approach in a model of wildfire risks. Using data from California, they find that households are averse to wildfire risks when choosing where to live—i.e., higher risks reduce a household’s willingness to pay for a house in a particular location, all else equal—and that high-income households are more responsive to risks than are low-income households, which hints at some potential equity concerns.
2.2. Contribution of Population Growth to Wildfire Costs
The growth of the WUI has likely contributed to heavy losses from recent wildfires. Nine of the top ten most destructive wildfires in US history have occurred since 2017. This statistic is as of January 2024 and is based on data from the Insurance Information Institute (available at https://www.iii.org/fact-statistic/facts-statistics-wildfires) and an estimate that the 2023 wildfire in Lahaina, Hawaii caused insured losses of $3.2 billion. It does not include the catastrophic fires in Los Angeles in January 2025. In California, home to most of these catastrophic fires, the average annual value of structure losses rose from $30 million per year on average in the 1979–1989 period to nearly $1 billion per year on average in 2009–2018 (Buechi et al. 2018).
Studies differ over how much of the increase in losses owes to increases in the size and intensity of wildfires and how much is due to increased exposure to risk due to expansion of the WUI. Higuera et al. (2022) find that the number of structures destroyed per unit area burned increased by 160 percent between 1999–2010 and 2010–2020, suggestive of increasing encroachment of development into hazardous areas or increasing fire intensity (or both). Radeloff et al. (2023) estimate that out of the 84,000 additional homes that were within wildfire perimeters in the 2010s as compared to the 1990s, 47 percent were due to housing growth, while 53 percent were due to expansion of wildfire activity. In contrast, Modaresi Rad et al. (2023) find that most (93 percent) of the growth in population exposure to wildfire from 2000 to 2019 was due to increasing wildfire activity. Growth of the WUI slowed down in the 2010s; therefore, some of the differences in findings across studies could be due to the differing time periods. However, the studies also use different population datasets, so the source of differences is unclear. Radeloff et al. (2023) use block-level Census data, whereas Modaresi Rad et al. (2023) use 100 m gridded population data from the WorldPop Global Project.
2.3. Externalities from Development in High Wildfire Hazard Areas
The expansion of development in wildfire hazard areas can impose costs on those living elsewhere. Four types of externalities can be at play. First, humans are a leading source of wildfire ignitions, and studies have shown that increased development within high hazard areas increases the likelihood of fire ignitions (Balch et al. 2018; Chen and Jin 2022). Second, air pollution from wildfire smoke can affect people living hundreds, even thousands, of miles from the source of a wildfire ignition (Gellman and Wibbenmeyer, 2025). Third, increasing development in high hazard areas induces federal and state fire protection agencies to spend larger and larger sums of money on fire suppression (Baylis and Boomhower 2023). Last, in part due to insurance regulations that make it harder to raise rates in some states, the costs of insuring households in high-risk states are partially borne by households in lower risk states (Oh, Sen, and Tenekedjieva 2022). This cross-subsidization can also play out within a state; recent research finds evidence of cross subsidies in California, which has annual limits on the amount that insurance companies can increase rates (Boomhower et al. 2023; Taylor et al. 2023).
2.4. Potential Future Wildfire Costs
If unabated, development within high wildfire hazard areas will continue to increase property damage and other costs associated with wildfires. Box 1 presents a simple analysis, similar to those by Radeloff et al. (2023) and Modaresi Rad et al. (2023), which illustrates potential future wildfire impacts if populations in western states grow as projected in official forecasts. Our analysis asks how many people would be impacted by the same wildfires that occurred over the 2015–2021 period if the fires were to occur in 2050 and populations were to grow as forecasted by state agencies.
According to our calculations, the fires would be approximately 15 percent more damaging, i.e., they would affect 15 percent more people than they did in the years they occurred. Importantly, our 2050 county projections assume new people are geographically distributed within counties proportional to their distribution when the past fires occurred, i.e., the same share of a county’s future population falls inside the fire perimeters. If relatively more people locate in high-risk areas, the numbers could be higher. But importantly, if policies encourage growth in less risky areas and discourage it in more risky areas, the numbers could be lower.
Box 1. Number of People Impacted by 2015–2021 Wildfires
According to the Monitoring Trends in Burn Severity (MTBS), 1,962 wildfires occurred in the 9 states in the western continental United States over the 7-year period between 2015 and 2021. We overlaid geospatial fire perimeter data from MTBS with Census block group population data to estimate the number of people affected by these fires.
To estimate how many people could potentially be affected in the future with these same fires, we used county population forecasts for 2050 for 8 of the 9 states (we could not find county population forecasts for Idaho).* We assumed the same fraction of total county population would be located within the fire perimeters as were located there when these historical fires occurred to yield a forecast of population affected in 2050. The graph below shows results for each state.
In total, across all states, 4.7 million people were affected by these 1,962 wildfires; if the same fires occur in 2050, approximately 5.3 million people would be affected. Clearly, the magnitude of the problem in California dwarfs that in other states, both when the fires occurred and with future population projections. But the percentage increase in population affected is higher in other states: Utah, Arizona, and Colorado see increases of people affected by fires of 86%, 39%, and 36%, respectively, compared to 9% for California.
*County population forecasts are from official government sources; references available from the authors upon request.
Figure 2. Number of People Impacted by 2015–2021 Wildfires, by State

3. Local Planning and Zoning
Local governments play a direct role in determining community land use patterns through planning and zoning. Virtually every local government in the United States produces a comprehensive plan. These plans provide a snapshot of current community land use, housing, transportation, and the environment, and a vision for the future under population and economic growth projections. The frequency with which comprehensive plans are updated varies across communities, as does the level of detail they contain and the extent of community engagement in developing the plan. Comprehensive plans provide the conceptual underpinning for local zoning ordinances, which establish the rules and regulations for development: how much, what type, and where.
3.1. Comprehensive Plans
All states have laws that enable or require development of local comprehensive plans (American Planning Association 2022). However, states vary to a significant degree in their engagement with the development of these plans and what requirements they place on localities. States also vary in the degree to which they require local jurisdictions’ zoning rules to be consistent with their own plans; among western states, six have this requirement (California, Oregon, Washington, Idaho, and Arizona; American Planning Association, 2022). A handful of states require that local comprehensive plans be consistent with a statewide planning law; among western states, only Washington and Oregon have this feature. Some states set guidelines for what comprehensive plans should include or require plans to contain specific “elements”— sections of the plan that deal with a particular topic.
States’ requirements for comprehensive plans can have important implications for whether and how communities consider natural hazards in their planning and zoning decisions. For example, in Colorado, local comprehensive plans are required to include recommendations regarding land development within wildfire hazard areas (Colorado Revised Statutes [CRS] § 31-23-206). However, a 1974 law, known as “1041 regulations,” explicitly grants local governments the authority to make planning decisions that affect issues of “statewide interest,” including wildfire hazard. See https://dlg.colorado.gov/1041-regulations-in-colorado. The law’s intention is to allow local governments to maintain their control over development projects even where development has statewide impacts. It thus gives significant license to communities to plan for wildfire hazards however they see fit, and as a result, planning approaches across localities vary throughout the state (Mowery and Punchard, 2021).
Standards for comprehensive planning in California and Oregon are more rigorous. In those states, cities and counties are required to address fire hazards in their comprehensive plans if the jurisdiction contains designated hazard zones (Mowery and Punchard, 2021). Practically speaking, this means they are required to consider information about fire hazard within their boundaries and to create a set of goals, policies, and implementation measures for protecting the community from wildfire hazards. Nevertheless, even these states are reluctant to be overly prescriptive with respect to local land use planning processes. In Oregon, for example, there is a review process through which the state can suggest amendments to local plans, but there are no specific requirements for communities to successfully address wildfire hazard in their comprehensive plans.
3.2. Zoning
A comprehensive plan lays out a vision of land use in a community, but the proverbial rubber meets the road with local zoning ordinances. The ordinances set allowable uses of land—e.g., commercial, residential, industrial, agricultural—for different areas of a community. For residential zones, the uses also include specific types of residential development such as single-family or multi-family dwellings, the intensity of development (e.g., number of dwelling units per acre or, equivalently, minimum lot sizes) and other requirements such as setbacks, lot lengths and widths, and building height limitations. Commercial building intensity of use is usually set on a floor-area ratio basis (i.e., square footage of interior space as a fraction of the lot size).
3.2.1. Zoning History and Single-family Homes
The delegation of zoning to local governments dates to the 1920s. The federal government published the Standard State Zoning Enabling Act in 1926, providing a model for states to define the parameters of local government powers over zoning (U.S. Department of Commerce, 1926). In subsequent years, numerous states adopted zoning enabling laws that incorporated much of the language from the federal model code (Hirt, 2015). The federal model lists policy goals that zoning is intended to achieve, including to “lessen congestion . . . secure safety from fire, panic, and other dangers . . . and avoid undue concentration of population” (U.S. Department of Commerce, 1926). It also set out some of the basic provisions that still make up the framework of local zoning codes today: dividing localities into zones or districts, specifying the types of land uses and structures permitted in each district, and regulating the physical dimensions of structures, usually as a fraction of land area (Schuetz 2023).
Zoning codes can be quite complex and often include multiple requirements for and restrictions on development. They can also vary significantly across jurisdictions. However, residential-only zones and minimum lot size requirements are ubiquitous; virtually every local government in the United States uses them. This distinguishes US cities from European ones, where single-use residential districts and minimum lot size requirements are uncommon (Hirt 2013). Some communities will have only a few minimum lot size categories, and some will have several. In outlying areas, including WUI areas, these zones may sometimes have quite large minimum lot sizes (e.g., 10 or 15 acres or even larger).
Long-standing concerns over urban sprawl and loss of open space have led to criticisms of these types of zones and establishment of clustering and subdivision open space requirements in some localities. In these cases, the average minimum lot size for a development may stay the same, but houses are required to be placed closer together. Whether clustered subdivisions increase or decrease wildfire risks is unclear and tends to depend on the configuration, topography, and vegetation features of the subdivision. On the one hand, higher density development can increase structure-to-structure ignitions; on the other, the land buffers between clustered subdivisions can reduce risk (FEMA 2023; Braziunas et al. 2021).
In addition to concerns over sprawl, single-family zoning has long been described as exclusionary, effectively barring low-income households and racial minorities from some neighborhoods (see e.g. Gyourko and Molloy, 2015; Whittemore 2021), and, in recent years, it has come under criticism for contributing to a housing affordability crisis. Many scholarly studies find that more restrictive zoning is associated with higher house prices, but establishing a causal link is difficult because regulations are endogenous to a host of local economic factors (Albouy and Ehrlich 2018; Gyourko and Krimmel 2021). In addition, affordability is not just about prices but prices relative to income, which has received less attention (Molloy 2020). We mention these issues here because of the growing push to increase housing supply, which could be at odds with efforts to reduce exposure to wildfire risks in the WUI. We return to this issue in Section V.
3.2.2. Natural Hazards and Zoning
Natural hazards can sometimes be addressed in zoning codes through zoning “overlays.” These are add-ons to baseline zoning that establish additional requirements where the overlay applies. They are often used for floodplains, setting requirements such as first-floor building elevation. The use of “resilience overlays” is on the rise, especially in cities subject to coastal flooding. The city of Norfolk, Virginia, which has the highest rate of sea level rise on the East Coast, adopted a resilience overlay ordinance in 2018 that has some creative elements (see Box 2), including incentives to transfer development from more risky to less risky areas.
Box 2. Norfolk, Virginia, Resilience Overlay
Norfolk’s resilience overlay ordinance* created two zones: a high flood-risk “coastal resilience overlay (CRO) zone” and a lower-risk “upland resilience overlay (URO) zone.” All development across the city has to meet a “resilience quotient,” a score based on a point-based system that covers three resilience elements: risk reduction, storm water management, and energy resilience. Development in the CRO zone is required to have a higher resilience score, which can be fulfilled via a range of options such as structural elevation, wind-resistant building features, and nature-based drainage systems. It can also be met by extinguishing development rights in the CRO through direct purchase of land or conservation easements in that zone. Thus, the point-based system allows for flexibility as developers can choose the most cost-effective options for attaining greater resilience rather than having to meet strict standards for individual items.
* See https://www.norfolk.gov/DocumentCenter/View/35581/Adopted-Zoning-Ordinance?bidId=.
Wallowa County, Oregon, adopted a Wildfire Hazard Overlay (WHO) Zone in 2017. See https://www.co.wallowa.or.us/media/2576 and https://www.co.wallowa.or.us/media/3036. At the same time, the county also amended the Natural Disaster and Hazards component of its Comprehensive Plan to include wildfire hazards. The WHO Zone is delineated based on proximity to public lands and on wildfire hazard as laid out in the county’s CWPP. New structures built in “high” or “extreme” wildfire risk areas in the WHO Zone are subject to specific requirements related to building standards (e.g., roof materials), emergency access, and fuel breaks. There are no limits or restrictions on the amount of development in the WHO Zone.
Douglas County, Colorado, also designates areas of the county determined to have high fire hazard as part of a Wildfire Hazard Overlay District. See https://www.douglas.co.us/building-division/wildfire-mitigation/. Similar to Wallowa County, new buildings in the Douglas County Overlay District must meet several fire-resistant construction standards, emergency access requirements, defensible space investments, and vegetation management requirements based on zones around the structure. As in Wallowa County, there are no density limits or development restrictions based on the overlay, nor incentives to transfer development from inside the Overlay District to outside of it.
3.2.3. The Role of States in Local Planning/Zoning
Scholars disagree over the degree to which states can effectively influence local zoning regulations. This question has come to a head in recent years mainly around the housing affordability crisis and conflicts between state and local governments over zoning rules. Stahl (2021) concludes that states have a great deal of latitude. Even in states that follow Home Rule—i.e., have state constitutions or laws that allocate significant autonomy to local governments—courts have typically ruled that states retain supremacy, leaning on the “statewide interest” finding in many cases around state laws and policies. Home Rule states contrast with Dillon Rule states, which follow the principle that local governments can only exercise powers expressly granted to them by the state. Many scholars have argued, however, that the distinction between these two broad characterizations of state policy is not germane to land use policies and zoning because Dillon Rule states still delegate most authority to local governments, and many Home Rule states (Oregon is a prime example) exercise a good deal of authority over local land use (Richardson et al. 2003; Stahl 2021). Schuetz (2023), on the other hand, argues that local governments often have many ways to circumvent new state laws incentivizing increased housing supply or mandating development features (e.g., accessory dwelling units, mixed-use development, higher density).
In two states, the state government has long played an important role in local land use regulations. Oregon and Maryland have a set of “smart growth” policies that incentivize denser development in urban centers and preservation of open space in outlying areas. Box 3 describes the approaches taken in the two states, one of which (Oregon) is more command-and-control oriented and the other (Maryland) more incentive-based. The box describes findings in the literature about the outcomes the policies have brought about.
Box 3. State Land Use Laws: Oregon and Maryland
Oregon enacted Senate Bill 100 in 1973, which laid out a vision for the state in which agricultural and natural lands would be preserved, and development contained, by urban growth boundaries (UGBs). Under the law, cities are required to submit proposed UGBs to the state Department of Land Conservation and Development, justifying them according to 19 statewide planning goals, which include preservation of agricultural and forested lands and creation of cities with transit, affordable housing, and multi-use zones. UGBs are adjusted every five years and are required to maintain a 20-year supply of land that can be developed.
Maryland passed a package of legislation in 1997 collectively known as the state’s “smart growth” legislation. The Priority Funding Areas Act directs state funding for growth-related infrastructure to Priority Funding Areas (PFAs), defined as municipalities, areas inside the Baltimore and Washington DC Beltways, and other developed areas based on density and water and sewer availability. Another law created the Rural Legacy Program, which provides funding for land and easement purchases to preserve agricultural, forestry, and natural lands.
Oregon and Maryland have similar goals but have taken two different approaches. Oregon’s approach is based on mandated limits on where localities can allow development, while Maryland’s approach is more incentive-based, with state dollars used as “carrots” for localities to direct development to town centers.
Several studies have evaluated the effectiveness of the policies and their unintended consequences. Oregon’s UGBs have been found to be effective in steering development to areas inside the boundaries (Dempsey and Plantinga 2013), but spillover effects to outlying areas have been identified, and studies have found some relatively large lot development inside UGBs (Kim 2013; Lewis and Parker 2021). Most studies find that Maryland’s PFAs and Rural Legacy designations have shifted development, water infrastructure, and jobs to PFAs, though results vary by region (Shen and Zhang 2007; Howland and Sohn 2007; Hanlon et al. 2012). Lewis et al. (2009), however, argue that the effects are small because the size of Maryland state infrastructure spending at stake is a relatively minor factor in development decisions.
3.3. Additional Planning Documents
Municipal, county, and state governments—as well as regional planning authorities—use a variety of planning documents for purposes beyond land use planning. In the context of wildfire risk management, three such relevant plan types are Hazard Mitigation Plans (HMPs), Community Wildfire Protection Plans (CWPPs), and Comprehensive Economic Development Strategies (CEDS). Each of these planning documents addresses different subject matter and is required by federal agencies for access to certain federal funds. The extent to which these plans are integrated and consistent with one another and with comprehensive plans varies across communities. Features of these various plans are summarized in Table 1.
3.3.1. Hazard Mitigation Plans
Since 2000, the Stafford Act, the federal law that governs disaster mitigation and recovery and provides the statutory authority for most FEMA programs, has required communities to have HMPs to access FEMA non-emergency funding. As a result, HMPs are ubiquitous across the United States. HMPs address hazards broadly and include strategies to mitigate damage that may include structural measures (e.g., flood barriers) and infrastructure improvements, natural resource management, public awareness campaigns, or regulatory measures (e.g., changes in zoning laws). However, HMPs are not required to address land use and exposure to hazards, and land use is not a typical component of recommendations. Burnstein and Rogin (2022) review state HMPs and other state plans around flooding and find them lacking, serving mainly as a summary of activities rather than as a strategic planning document.
Table 1. Summary of Other Relevant Planning Documents

3.3.2. Community Wildfire Protection Plans
CWPPs are focused specifically on addressing wildfire hazards and are required to make recommendations for hazardous fuel treatment locations and measures to reduce ignitability of structures in the community; CWPPs are not required to address land use. Adoption of a CWPP is required for communities to apply for Community Wildfire Defense Grants from the US Forest Service, or to be prioritized in the allocation of other federal hazard mitigation funding. As a result, these are growing in prevalence across the western United States; as of 2022, 803 communities had a CWPP. See https://fireadapted.org/cwpp-database/.
3.3.3. Comprehensive Economic Development Strategies
CEDS are strategic planning documents that outline a region’s economic development goals and strategies. By guiding growth and infrastructure investments, CEDS can influence hazards and exposure to wildfire risk by shaping how and where new development occurs, including commercial development. These documents must include a SWOT analysis—an assessment of strengths, weaknesses, opportunities, and threats to economic growth in the region. The SWOT analysis—the outline of threats, in particular—is a natural place to incorporate concerns over climate change and natural hazards. In recent years, calls have increased to incorporate climate impacts and resilience into CEDS and have CEDS be coordinated with HMPs (FEMA 2022; Pesek et al. 2023). CEDS are frequently developed by regional planning agencies to gain access to grants from the US Economic Development Administration. However, while a few CEDS acknowledge climate change threats and outline plans for resilience, CEDS are neither required by the EDA to address climate threats broadly, nor to address land use and exposure to hazards.
3.4. Local Fiscal Policy
Planning and zoning have the most direct effect on the amount, types, and spatial distribution of development in a community, but local fiscal policy can also impact development. Local governments rely heavily on property taxes to fund local public services. A long-standing conceptual finding in the economics literature is that the standard property tax, which taxes land and capital (i.e., building structures) at the same rate, leads to less dense development and contributes to urban sprawl (e.g., Brueckner and Kim 2003). Empirical evidence for this finding is very limited, however. Song and Yan (2006) estimate a cross-city model and find the opposite effect: increases in the property tax reduce sprawl.
Some jurisdictions assess property tax surcharges in selected neighborhoods or areas (sometimes jurisdiction-wide) to pay for services that benefit those areas. Marin County, California, has a tax on all parcels of 10 cents per building square foot ($75 per multifamily unit), approved by voters in 2020 for a ten-year period, that is used to pay for the Marin Wildfire Prevention Authority. The Authority uses the funds for fuels reduction programs, public wildfire education, defensible space evaluations, and other activities. See https://www.novatofire.org/prevention/wildfire-mitigation-measure-c. Some communities establish “special districts,” special-purpose governmental units that have independent taxing authority and collect taxes or fee revenues to pay for a specific service. Special districts are used for parks, conservation, solid waste services, water supply, fire protection and more. The Sandbridge Special Service District, near the city of Virginia Beach, Virginia, uses a special property tax assessment to pay for beach nourishment and shoreline management and restoration. See http://virginiabeach.elaws.us/code/coor_ch35.1.
Alternatively, some communities have a local sales tax surcharge (applied on top of the state sales tax) for specific programs and services. Voters in Boulder County, Colorado, approved a 0.1 percent sales tax in 2022 to use for wildfire hazard mitigation projects. See https://bouldercounty.gov/disasters/wildfires/mitigation/wildfire-mitigation-sales-tax-1a-programs/.
4. State-level Policies
While micro-level land use decisions are generally the province of local governments and individual landowners, states can nevertheless have significant influence on the context of these decisions and thus affect the decisions themselves. Several areas of state policy provide leverage points through which states can directly or indirectly affect incentives for development and inform local planning. This section discusses four of these areas: (1) wildfire hazard mapping, (2) insurance regulation, (3) infrastructure spending, and (4) bridging engagement between localities and the federal government.
4.1. Wildfire Hazard Mapping
Unlike FEMA’s Special Flood Hazard Areas, there exist no official federally designated wildfire hazard areas. However, some states have invested in hazard mapping efforts primarily undertaken by state forestry departments. Resulting hazard maps can define areas where the state may apply regulatory requirements, such as disclosure laws or building codes, and can fill an information gap, which can aid local planning efforts.
California is a leader in developing statewide hazard maps. The California Department of Forestry and Fire Protection (CAL FIRE) was first directed by law to map hazard in 1981. Originally, the maps were used to designate state “Fire Hazard Severity Zones,” or FHSZs, within state responsibility areas—those areas within which the state has financial responsibility for managing fires. Later, the state also instructed CAL FIRE to map very high FHSZs within local responsibility areas, though it left authority for officially adopting recommended FHSZs to local communities. California has used FHSZs to define areas within which a number of regulations targeted at wildfire risk apply, including building codes, defensible space rules, and hazard disclosure requirements upon sale of a property.
While no state regulations applying within FHSZs have been targeted at restricting land use, these regulations shape the environment within which homebuyers make purchasing decisions, and they may affect demand for homes in high hazard areas (see e.g., Ma et al. 2024, 2024a). Several states are now following California’s lead in mapping fire hazards. Oregon released a statewide wildfire risk map in July 2022 that was met with strong opposition from property owners, especially in the southern part of the state (Mohr 2023). A revised version is currently being developed. A May 2023 law in Colorado established a wildfire resiliency code board tasked with defining designated wildland-urban interface areas. In both states, wildfire maps are expected to ultimately form the foundation for building codes and other requirements, similar to how they are used in California.
4.2. Insurance Regulation
Insurance regulations may also influence demand for properties in high hazard areas through their effects on costs of living in these places. Following a series of catastrophic wildfire events, the last several years have been tumultuous for the California’s homeowners’ insurance market. Insurer-initiated non-renewals have increased, forcing increasing numbers of homeowners to purchase expensive policies from the California FAIR plan, the state’s insurer of last resort (Liao et al. 2022). Several insurers have declared that they would stop writing new policies in the state altogether. While the problems are most pronounced in California, other western states are beginning to face similar challenges. See https://www.usnews.com/news/business/articles/2024-04-29/growing-wildfire-risk-leaves-states-grappling-with-how-to-keep-property-insurers-from-fleeing.
While factors driving insurers’ withdrawal from the California market are likely complex—in addition to increasing hazard, insurers have cited inflation and high reinsurance prices—insurance market regulation may be a contributing factor. In California, state insurance regulations until recently forbid the use of catastrophe models in rate-setting and require insurers go through a costly public rate hearing when requesting to raise rates by more than 7 percent in one year. Catastrophe models allow insurers to simulate catastrophic disaster events and implications for their insurance portfolio, arguably allowing them to set rates that better reflect tail risks and allow for underlying shifts in hazard (for example, due to climate change). These restrictions have likely kept prices in high-hazard areas lower than they need to be to fully reflect risks, and these artificially low prices may have contributed to a growing WUI. Studies have shown that subsidized flood insurance rates under the National Flood Insurance Program have contributed to increasing numbers of homes in high flood risk areas (e.g., Peralta and Scott 2024). No studies have evaluated the role of insurance in location choices in the WUI, but such research would be worthwhile.
4.3. Infrastructure Spending
Federal, state, and local governments spent $416 billion on transportation, drinking water, and wastewater infrastructure in 2014 (Shirley 2017). Roughly 75 percent of that spending was by state and local governments, and transportation accounts for the largest share. Of the transportation spending by state and local governments, states spend more than local governments do, and most state spending goes to highways; local spending is on local streets and roads (Urban Institute 2021).
How and where this infrastructure investment occurs can affect household location incentives and private incentives for land development. For example, road improvements reduce travel times between outlying areas and central cities, and water infrastructure can reduce costs of drinking water and water treatment. Sewer infrastructure allows for more dense development. The effects of these incentives are validated by research. A large body of research has found that transportation infrastructure investments affect the distribution of population and economic development (for a review, see Redding and Turner 2015). Less research has studied effects of water infrastructure; however, Lieske et al. (2015) find that investment development of water infrastructure also leads to growth.
While infrastructure spending is not often discussed as a lever for influencing land use in high fire hazard areas, it has seen some use for limiting development within areas at risk of coastal flooding. The federal Coastal Barrier Resources Act, passed in 1982, prohibits the use of federal funding for infrastructure and disaster relief, as well as access to flood insurance through the National Flood Insurance Program, within designated Coastal Barrier Resources System (CBRS) area boundaries. Druckenmiller et al. (2024) compare designated CBRS “treatment” areas to similar but undesignated “control” areas and find that development is 83 percent lower inside designated areas. They also find that overall flood damage in coastal counties with CBRS lands are lower and property tax revenues higher, even accounting for additional development that occurred in areas adjacent to CBRS lands. The authors are not able to identify which of the three restrictions—infrastructure, disaster aid, or flood insurance—drive the results. However, other experts have suggested that the infrastructure and disaster aid limits are the more important ones and that state and local governments that reinforced the CBRS restrictions by limiting state infrastructure spending saw bigger impacts from the law (Salvesen 2005; Branham et al. 2022).
4.4. Bridging Federal and Local Governance
States play important roles as intermediaries between the federal government and local governments. In the case of federal grant programs, states coordinate funding for localities, set rules for prioritization of funding, approve local government applications (and sometimes help local governments with those applications), and more.
Most federal grant programs send funding to states, and states then redistribute the money to local governments. In the case of FEMA’s Building Resilient Infrastructure and Communities (BRIC) national competitive grant program, for example, a designated state agency (usually the state emergency management agency) submits a single application to FEMA for pre-approved local hazard mitigation projects. If awarded, the money goes to the state, which then awards it to local government “subapplicants.” A smaller part of the BRIC program provides money to states for state hazard mitigation, also through a competitive process. FEMA’s resilience revolving loan fund competitively awards grants to states, and states provide low-interest loans to local governments for resilience projects (Walls 2023). FEMA’s Hazard Mitigation Grant Program (HMGP), including the HMGP Post Fire, also goes to states. This money is post-disaster but is used for hazard mitigation, including development of HMPs. FEMA post-disaster spending dwarfs pre-disaster spending such as BRIC. According to a Government Accountability Office (GAO) report, of the approximately $11 billion spent by FEMA between FY2010 and FY2018, 88 percent went to HMGP and the Public Assistance program, which provides funding to state and local governments for rebuilding after disasters. Only 12 percent went to pre-disaster programs (U.S. GAO 2021). Seong et al. (2022) report that 98 percent of HMGP spending between 1989 and 2018 went to property buyouts. The Forest Service’s Community Wildfire Defense Grant (CWDG) program allows states to opt in or out of the intermediary role. In states that have opted out, the grant money goes directly to local governments. For those that have opted in, CWDG operates more like BRIC with money going to a state agency that redistributes to localities.
The way that states function in these intermediary roles varies widely state to state and can even vary within a state over time, as agency staff and elected officials turn over (Human 2024). For example, some states play a more hands-on role in development of local HMPs and also in federal grant applications, iterating with locals on their proposals. Other states play a more limited role. In the case of the CWDG program, some observers feel that states opting in to the intermediary role could be beneficial in theory but often is not in practice (Pohl 2024). State agencies could provide some of the basic work required in the grant process—for example, relieving a burden on local governments—but instead states have added layers of bureaucracy that increases costs for localities, both in the applications process and in implementation of projects.
5. Discussion and Suggested Policy Directions
In the collection of policies affecting exposure to wildfire risk, local zoning regulations matter the most—i.e., they provide the most direct policy lever to alter the patterns of development in communities. In our view, local governments should be looking to revise zoning codes in ways that shift development patterns, incentivizing new development away from high-risk areas and toward comparatively lower-risk areas.
5.1. Transfer of Development Rights
One of the best ways to create these incentives is through adoption of a wildfire resilience overlay coupled with a transfer of development rights (TDR) or density transfer program (Walls and McConnell 2007; McConnell and Walls 2009; Pruetz 2008; 2021).
TDR and density transfer programs incentivize the shifting of development from one area of a community to another. Areas where property owners are allowed to sell their development rights are typically referred to as “sending” areas, and areas where the rights are used are “receiving” areas. In existing TDR programs, the targeted sending areas are typically open space lands—lands with particular natural resources or amenities that the community would like to preserve from development. The receiving areas are town centers and areas with developed infrastructure. When development rights are transferred, the sending site typically has a conservation easement placed on it, restricting future development, and the rights are used to develop the receiving site more intensively (e.g., more houses per acre) than allowed by baseline zoning. Density transfer programs operate similarly but with the local government acting as an intermediary. Developers pay a fee to develop in a receiving area more intensively than allowed by baseline zoning, and the local government uses the fee revenues to purchase easements on properties in areas it wants to protect.
If a community sets up a natural hazard overlay that identifies the most at-risk areas of the community, land parcels in those areas could comprise the sending sites (as in the Norfolk resilience overlay described above in Box 2). Less risky areas could be the targeted receiving areas.
TDR/density transfer programs have three main strengths. First, they allow for growth. Rather than simply decreasing allowable development, they provide incentives to shift it from one area to another. Second, no government money is required to make the program work; land in sending areas is preserved from development with funding coming from private developers. Two counties in Maryland that used TDRs to protect 45,000 acres (Montgomery County) and 23,000 acres (Calvert County) of agricultural and open space land would have spent an estimated $65 million and $50 million, respectively, to achieve the same results with a program of government purchase of the development rights (Walls and McConnell 2007; Walls 2014). Third, TDRs avert legal takings challenges from property owners that can happen with downzoning and other development restrictions. The TDR program established and operated by the Tahoe Regional Planning Agency (TRPA) helped TRPA win a takings case over building moratoria in Lake Tahoe that went all the way to the Supreme Court. See https://www.law.cornell.edu/supct/pdf/00-1167P.ZS.
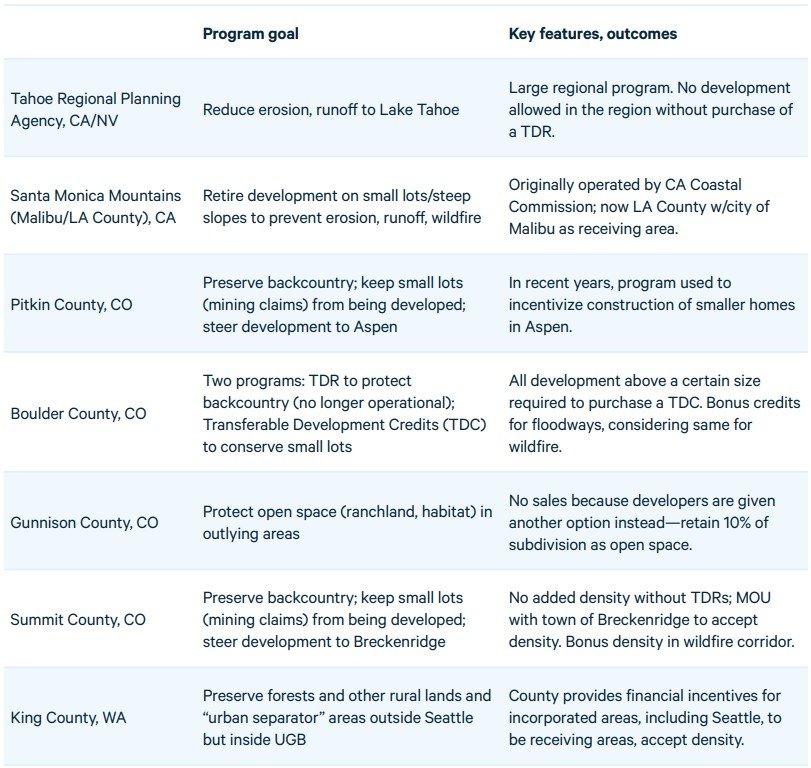
Although no existing TDR programs focus specifically on wildfire hazards, several in western states target preservation of land in the WUI. Others are designed to achieve a combination of environmental and conservation goals that include reductions in flooding, erosion, and wildfire risks. Table 2 lists some selected western communities that have TDR programs and some of the program features.
Table 2. Selected Western Transfer of Development Rights and Density Transfer Programs in Wildfire Hazard Areas
Local governments face significant headwinds in making zoning changes. Reliance on property tax revenues, vested interests from property owners, pressure from developers, and a need to stay consistent with comprehensive plans can make zoning changes difficult. TDRs and similar incentive-based options get around some of these problems—effectively compensating sending area landowners for limiting development on their lands—but the ostensible complexities of the programs and the challenge of introducing a new approach are hurdles to program adoption in many communities.
5.2. The Role of States
Because of these local headwinds, state governments can and, in our view, should look for ways to incentivize local governments to make these changes. There are several ways they can do this. The following are some possibilities:
- Develop model zoning codes that include wildfire resilience overlays and TDR/density transfer programs.
- Offer grants to communities for pilot TDR/density transfer programs and other options that directly incentivize a shift in development patterns.
- When developing legislation to address housing affordability (e.g., with new accessory dwelling unit laws, multi-family requirements, and other measures), as many states are now doing or considering, incorporate a wildfire risk element at the same time (e.g., require resilience overlays).
- Financially reward communities that include exposure reduction in zoning codes by prioritizing those communities for state and federal grant money.
- Financially reward communities that include exposure reduction in zoning codes by providing a state grant supplement to federal grant funding.
There are also legislative and regulatory steps that states can take to address increasing exposure to wildfire risk. First, they can require local governments to include natural hazard elements in their comprehensive plans; Oregon currently has such a requirement. Because acknowledging hazard in a comprehensive plan does not necessarily mean that local governments will follow through with hazard requirements in zoning regulations, states can adopt statutes that require internal consistency between comprehensive plans and zoning rules. Twenty states currently have such requirements; six are western states (American Planning Association, 2022). Lastly, states could require communities to explicitly include considerations of risk exposure, along with hazard and vulnerability, in their HMPs and CWPPs. Communities could be mandated to identify high-risk areas where they are targeting reductions in exposure and show how those goals are backed up by local zoning codes. These strategies are likely to be easier in some states than in others. In Colorado, for example, the state’s 1041 regulations grant local jurisdictions authority over matters affecting wildfire risk; this law would likely need to be changed.
Beyond incentivizing local governments, states play critical roles with disclosure requirements, insurance regulations, and infrastructure spending. In our view, three things are important in these areas. First, states should follow California’s lead and mandate risk disclosure. However, further analysis is needed of whether the California model as it currently stands is doing enough to accurately convey risks and that all households understand those risks. Second, it is important that insurance premiums are actuarially sound, i.e., that in high wildfire risk areas, they reflect risks in ways that ensure revenues are sufficient to cover claims, even in a catastrophic event. Actuarially sound rates are important to maintain solvency of insurers and to send the appropriate signals to homeowners about the full cost of living in risky areas (Liao et al. 2024). Risk-based prices can create affordability challenges for some households, but, in our view, regulators need to find ways to address this challenge without setting rates too low in high-risk areas. We discuss the risk pricing-affordability challenges in more detail in Liao et al. (2024). Bringing insurance companies to the table so that meaningful premium discounts are available for effective mitigation actions is also a key component to any risk-based pricing arrangement. Finally, further analysis of the role of state infrastructure spending in driving development is needed. States face competing goals in the WUI: ensuring that roads provide adequate emergency access and, at the same time, do not encourage excessive development. Understanding how to balance these needs and goals is critical.
5.3. The Role of the Federal Government
An important leverage point frequently used by the federal government to effect change at the state and local level is access to federal funding. Currently, the federal government requires local communities to produce several plans related to wildfire risk management to access various federal funds; however, nowhere does it require these plans to include land management elements. In theory, though, it could. The federal laws that mandate HMPs and CWPPs—namely, the Stafford Act and the Healthy Forests Restoration Act—could be amended to include a land use component. Even without that legislative change, annual funding announcements from federal agencies, such as those for FEMA BRIC and the CWDG, could set prioritization schemes that reward applicants who have a land use/risk exposure component in their plans. They could also award funding to projects that directly work toward reducing exposure, such as changes to zoning codes. Language in the BRIC funding announcements changes year to year, with different features emphasized by FEMA for grant applications. FEMA has a significant amount of latitude in developing this language (Human 2024).
The extent to which federal grant programs can provide sufficient incentives to localities to make these changes is unclear, however. With limited annual funding and individual communities facing low probabilities of winning these competitive grants, changing prioritization schemes may not be enough to effect widespread change. Moreover, if such changes fail to influence local policy, they may have the effect of concentrating funding toward high-capacity, well-resourced communities who have already implemented required changes, thus raising equity concerns (Manuele and Haggerty 2022). Nonetheless, change at the federal level can often send strong signals to states and localities, thus further exploration of how much federal agencies can do is in order.
6. Conclusion
Limiting further increases in exposure to wildfire risk is critical to slowing the growth in wildfire costs, but development in high hazard areas has proceeded thus far because it carries significant benefits in addition to costs. Households enjoy access to forests and other natural areas and may have lower costs of living in rural WUI areas. For households who opt to live in the WUI, these benefits may appear to outweigh the risks.
Development in high hazard areas, however, imposes external costs, i.e., costs borne by residents who live elsewhere. These include wildfire spread to comparatively lower risk areas, insurance rate cross-subsidies, and costs of firefighting and disaster relief that are borne by all taxpayers. Policy design needs to consider these externalities. Our report describes the current programs and policies that address wildfire risks and how they might be revised to better address exposure. Hazard Mitigation Plans and Community Wildfire Protection Plans could be required to explicitly incorporate complementary land use regulations to reduce exposure. Federal funding programs could prioritize communities that address exposure and offer financial rewards to such communities. Both the federal government and states could offer incentives for local pilot programs that advance the use of resilience overlays and TDRs that shift development from high-risk to low-risk areas. States could develop model codes for these land use regulations and facilitate discussion and lessons learned across communities.
Recent wildfires—in Los Angeles in 2025, Lahaina, Maui, in 2023, and Boulder, Colorado, at year’s end in 2021—highlight the devastation that can occur when developed properties are at risk. The Los Angeles fires will undoubtedly be the most costly in US history, in large part because of the large number of structures destroyed and the relatively high value of the properties. Creative policy options are needed to find fair and efficient solutions to the problem of population growth in high-hazard areas.