Global Energy Outlook 2026: How the World Lost the Goal of 1.5°C
RFF’s annual Global Energy Outlook harmonizes a range of long-term energy projections to find key trends in global energy consumption, emissions, and geopolitics.
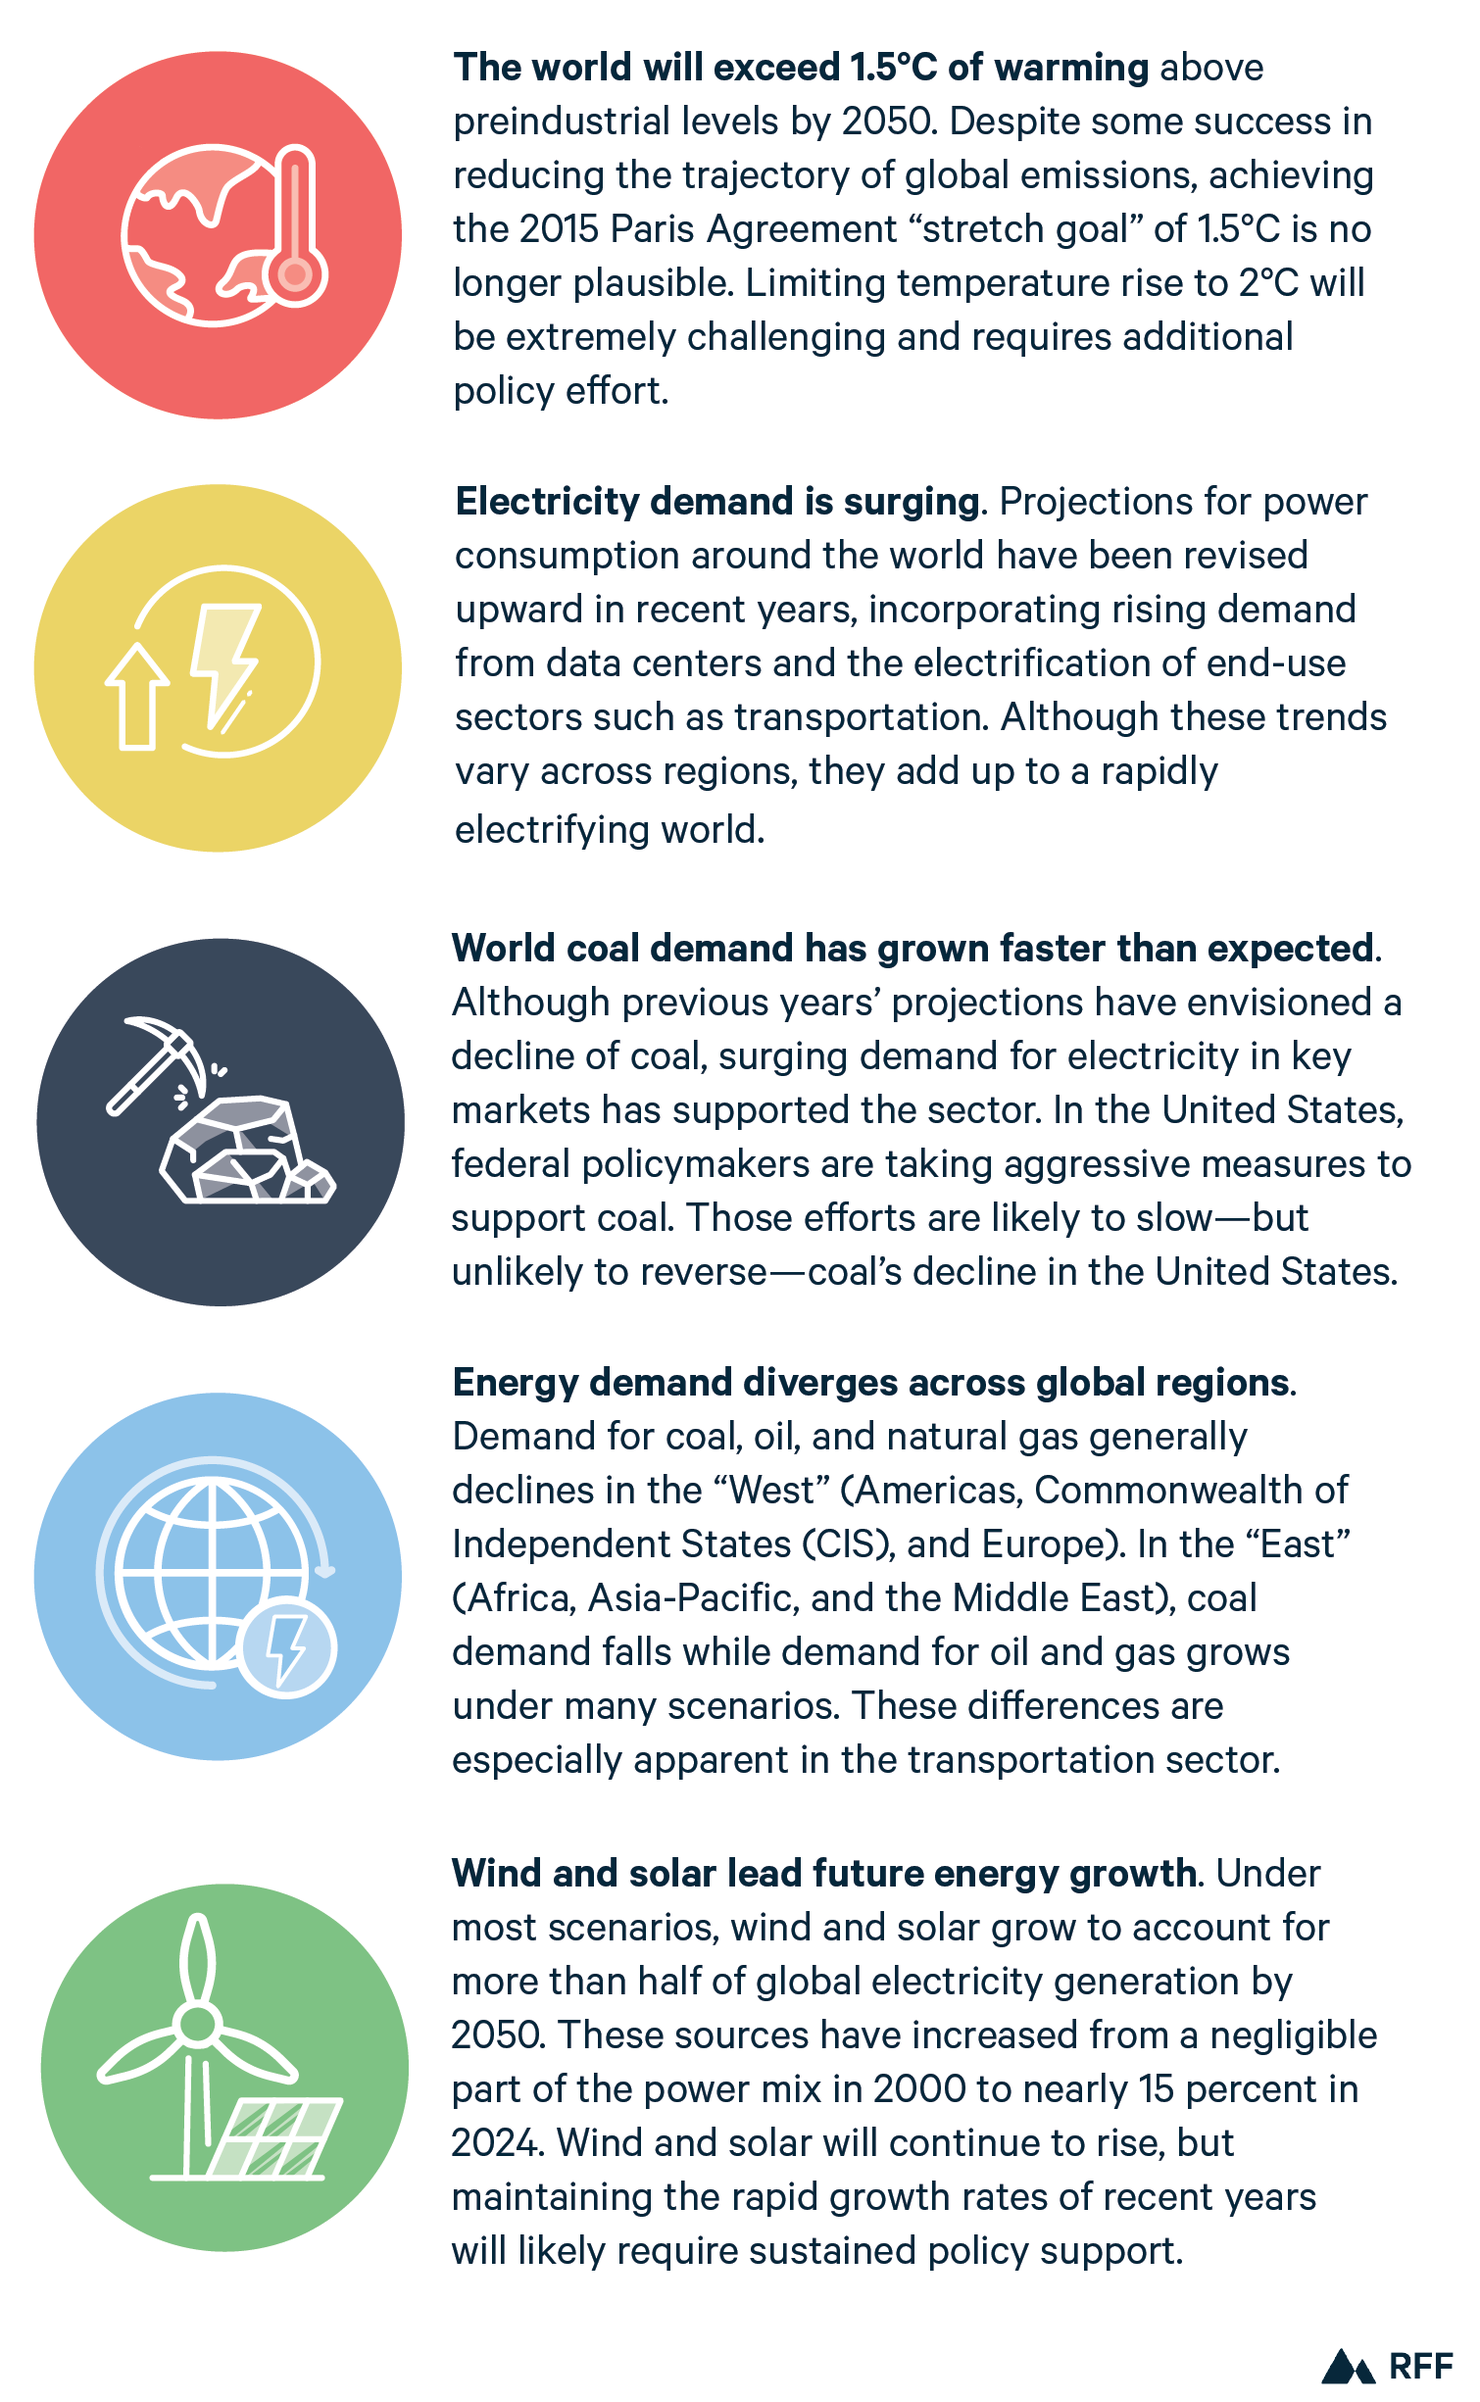
Highlights
1. Introduction
The events of 2025 have shaken the global order. Due largely to changes in rhetoric and policy from the United States, key pillars of international economic and security systems have been called into question. The reports we examine here were prepared well before the United States undertook military activities in Venezuela and Iran. They will undoubtably influence modeling and projections in 2026 but are not reflected here. Global expectations around energy and climate, in turn, have been disrupted. A decade after the 2015 Paris Agreement articulated the “stretch goal” of limiting global temperature rise to 1.5°C above preindustrial levels, it has become clear that achieving this goal is no longer plausible. Global leaders have increasingly focused on energy security and affordability, relegating climate change to a second-tier priority (or lower) in many cases. Still, preventing the worst outcomes of global climate change remains critical, highlighting the importance of continued effort to reduce emissions while ensuring reliable and affordable energy supplies.
One way to consider the future of energy and climate is through annual long-term energy outlooks that articulate different trajectories based on varying assumptions about future policies, technologies, costs, and other factors. Outlooks published in 2025 envision a wide range of possible futures but do not chart a plausible path to achieving the 1.5°C target. Specifically, two of the 1.5°C scenarios published in 2025 (BNEF and Equinor) are reproductions of scenarios prepared in previous years, and the 1.5°C scenario of the International Energy Agency (IEA) exceeds 1.6°C before returning to 1.5°C by 2100. Therefore, we generally exclude these scenarios, focusing instead on scenarios that reflect the realities of the current moment.
The outlooks we include offer useful insight into the future of energy, but they are not easily comparable because of differences in units, assumptions, geographic groupings, and more. Here we harmonize 15 scenarios across eight organizations to produce as close to apples-to-apples estimates as possible. These outlooks and scenarios are shown in Table 1 and discussed in more detail in Section 4.
A brief description of our methodology is provided in Section 4, Data and Methods, with select indicators in Section 5, Statistics. For the full methodology and interactive graphing tools, visit www.rff.org/geo.
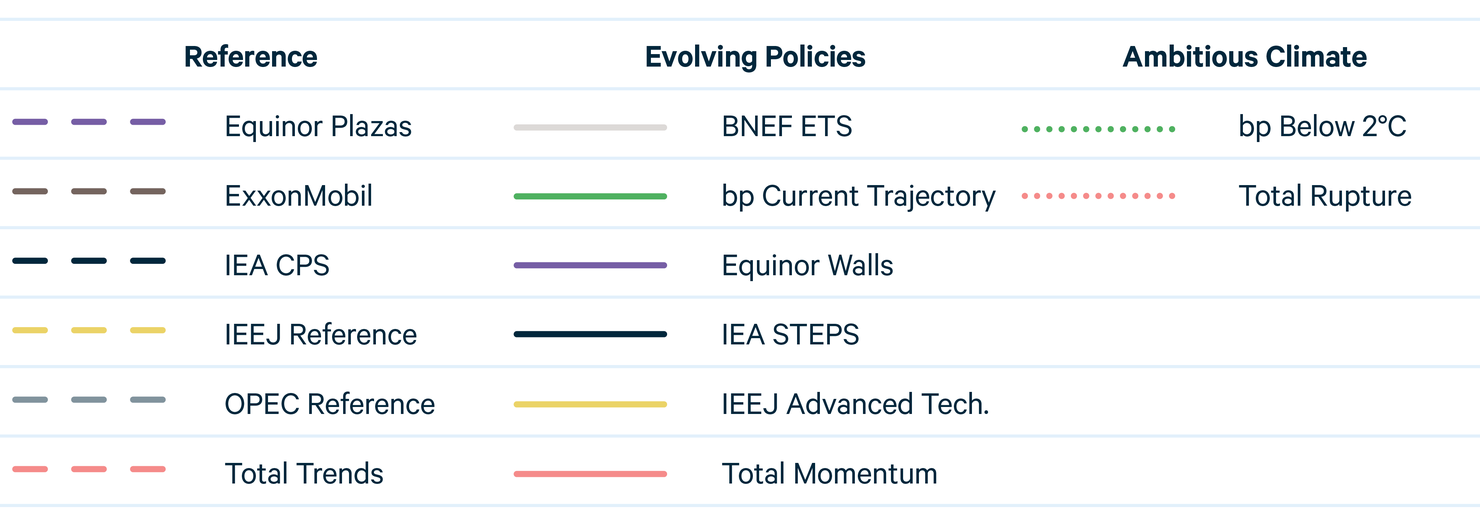
To enhance interpretability, we use consistent symbology in this report’s figures and the online data tool. We group scenarios into three categories based on their underlying assumptions or, in some cases, their trajectory of carbon dioxide (CO2) emissions (Table 2):
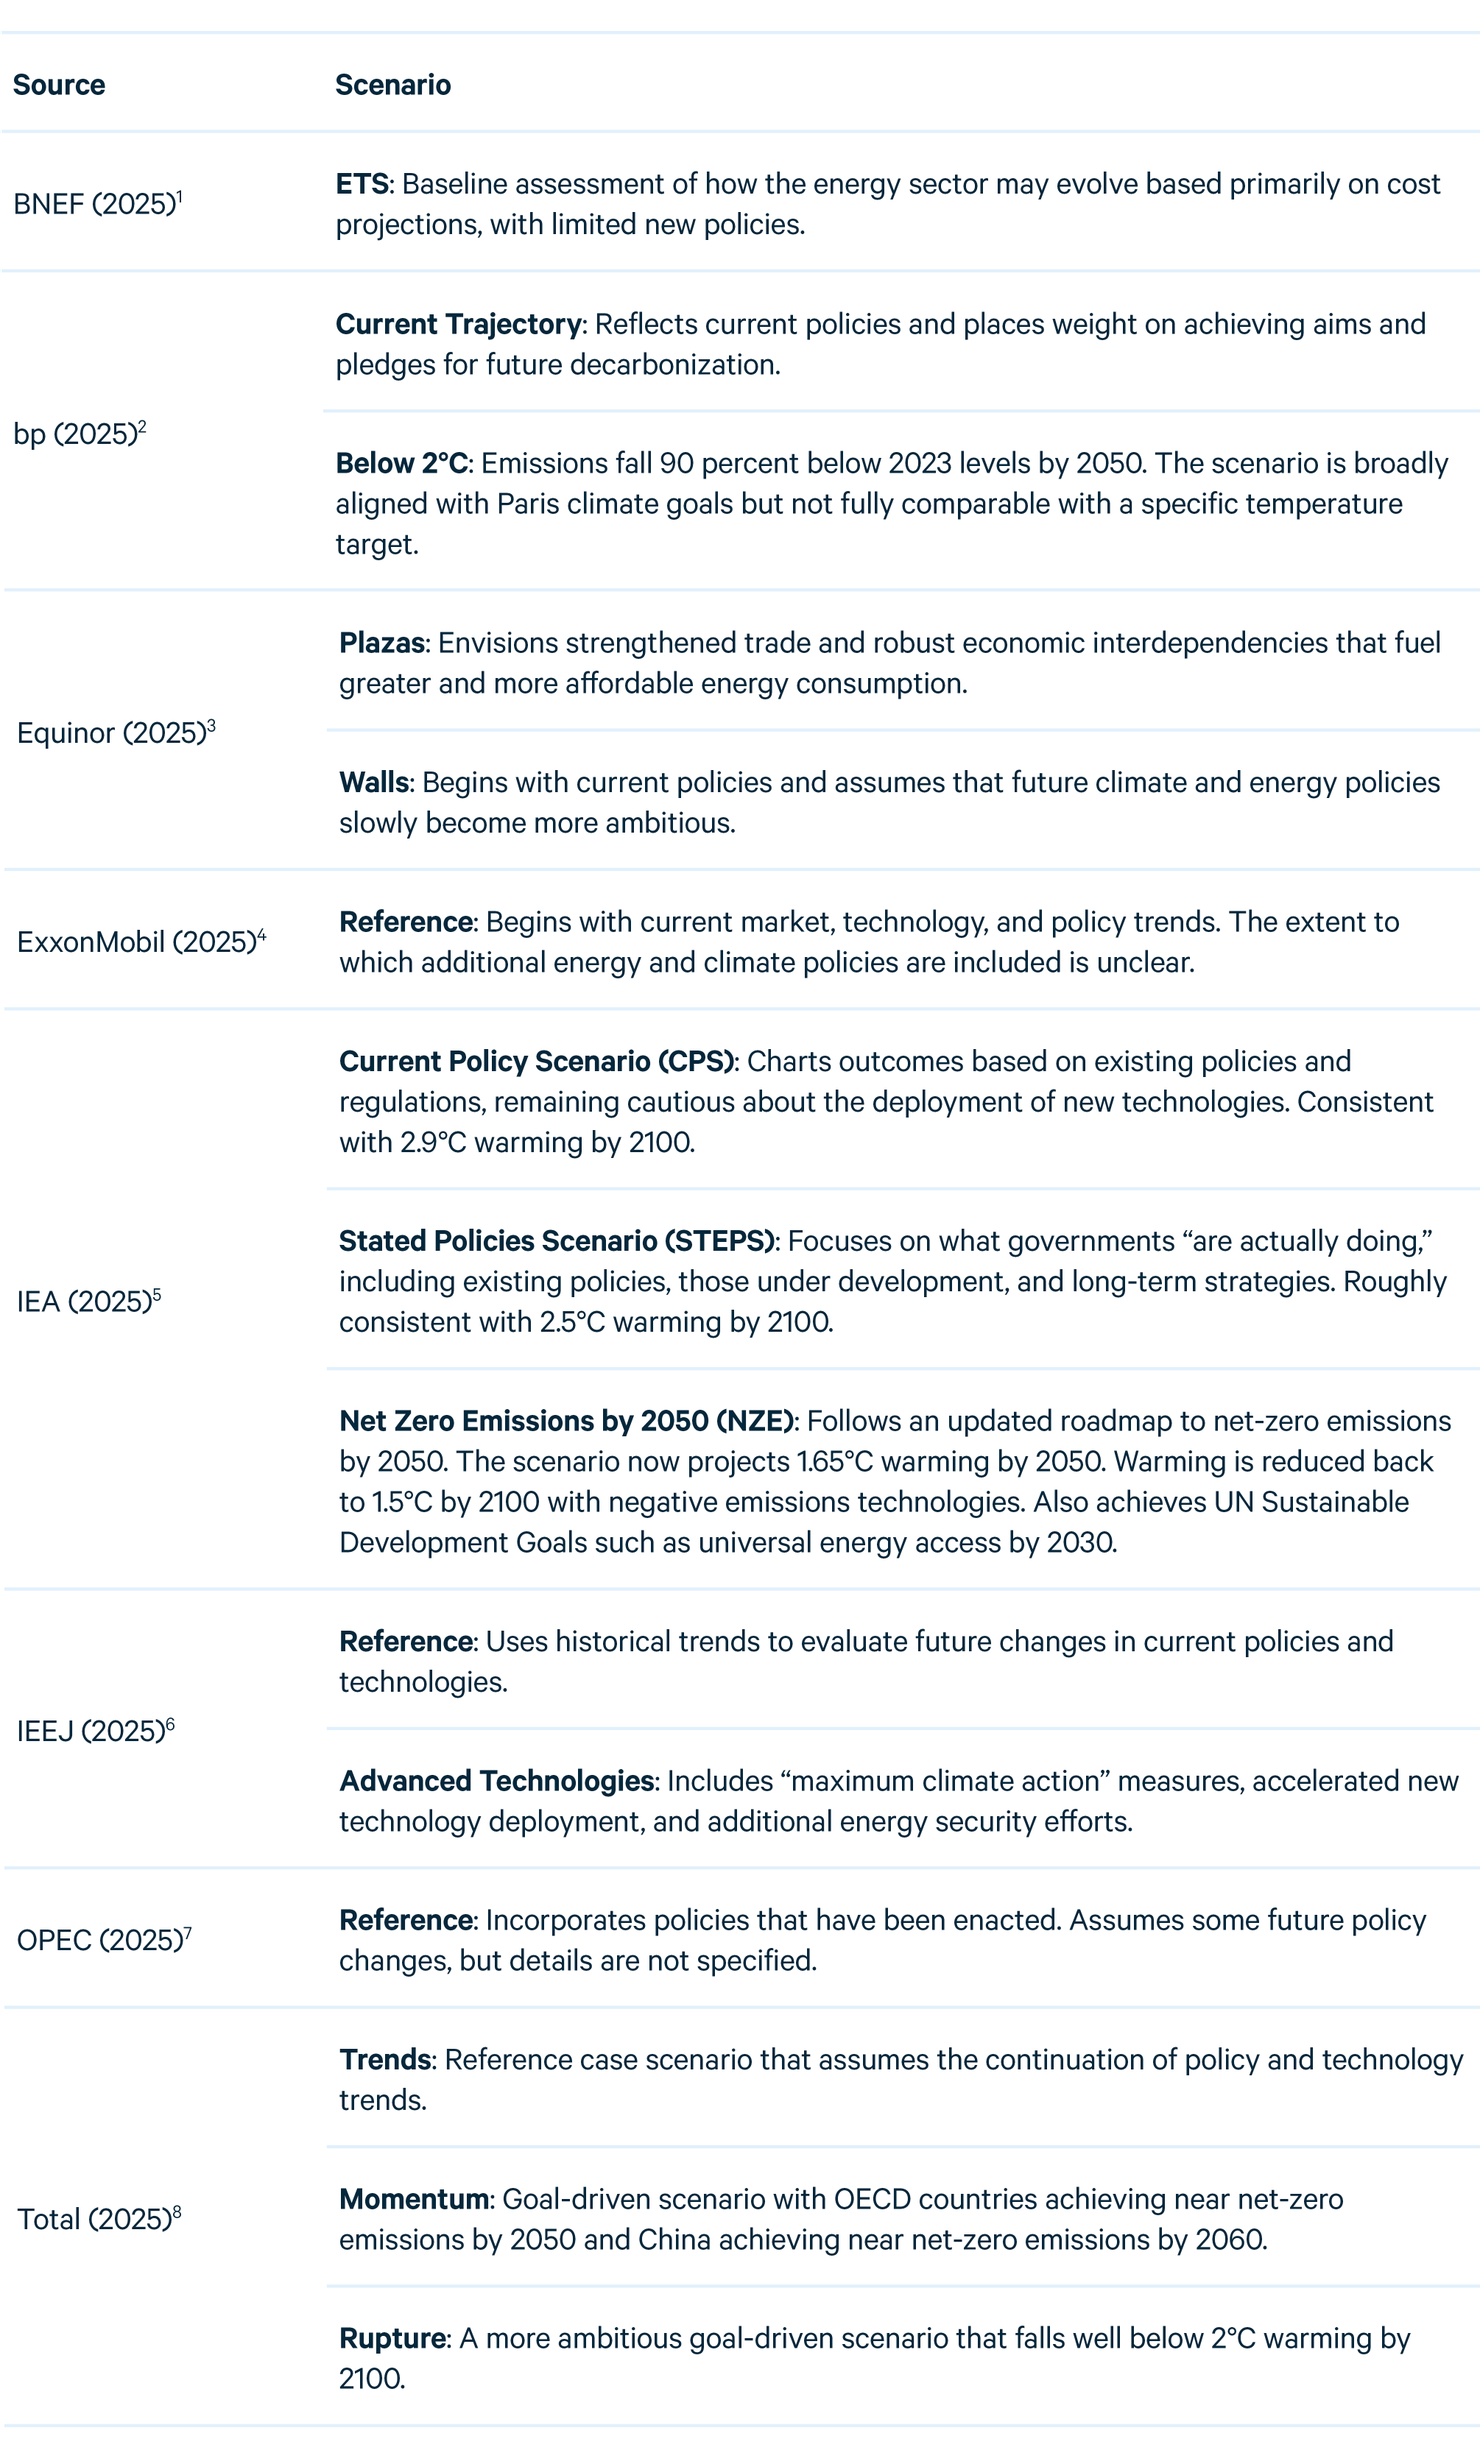
- For reference scenarios, which assume no new policies are enacted by governments or follow similar global emissions trajectories, we use a long-dashed line. This set comprises scenarios from Equinor (Plazas), ExxonMobil, IEA (CPS), IEEJ, OPEC, and Total (Trends).
- For evolving policies scenarios, which assume that policies and technologies develop according to recent trends or the expert views of the team producing the outlook, we use solid lines. This set comprises bp Current Trajectory, BNEF ETS, and IEA STEPS. We also include Equinor Walls, IEEJ Advanced Technologies, and Total Momentum because they follow similar emissions trajectories.
- Ambitious climate scenarios are not designed around policies but instead are structured to achieve specific climate targets. For these scenarios (bp Below 2°C, Total Rupture), we use a dotted line. We exclude 1.5°C scenarios.
Table 1. Outlooks and Scenarios Examined in This Report
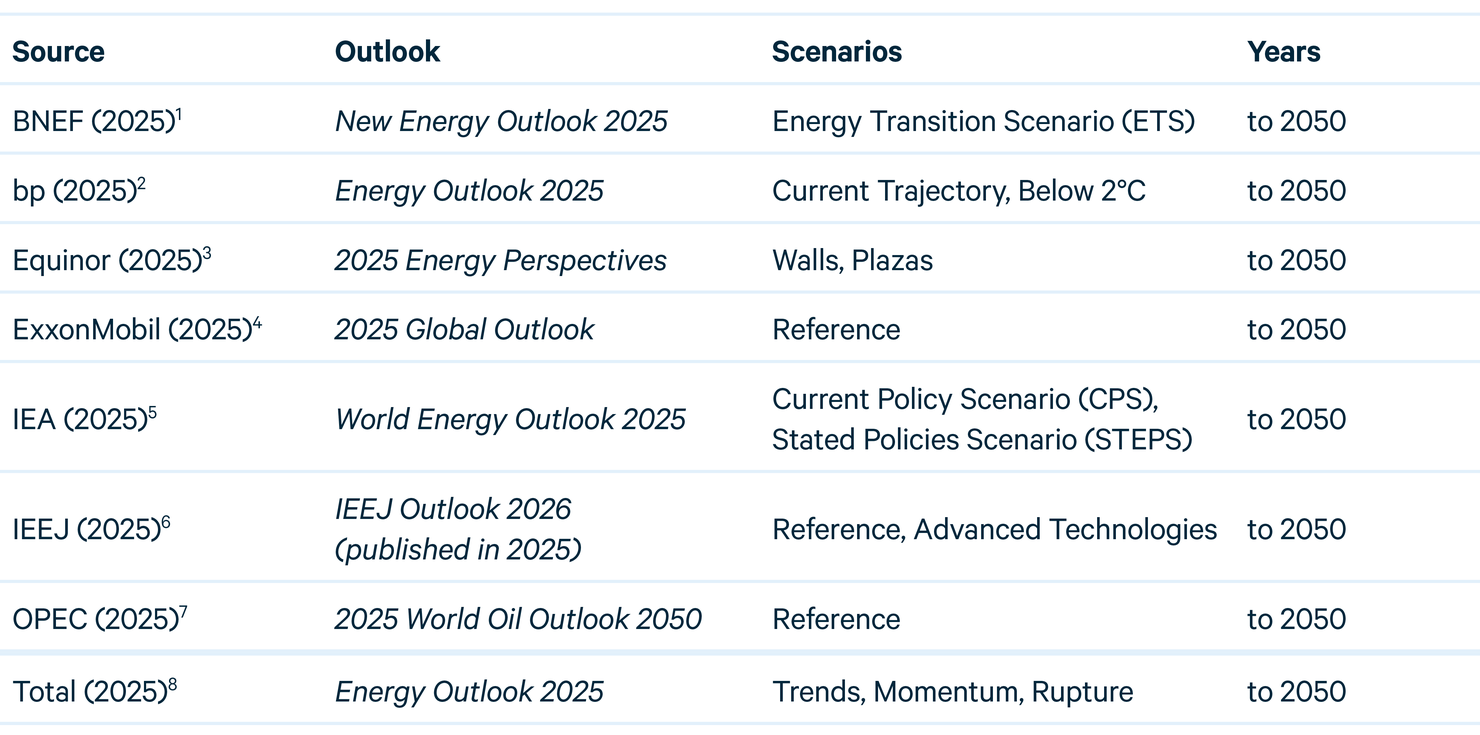
Table 2. Legend for Different Scenario Types
Figures and tables in this report often refer to the “East” and “West” regional groupings. We define “East” as Africa, Asia-Pacific, and the Middle East; and “West” as the Americas, Commonwealth of Independent States (CIS), and Europe.
2. Key Findings
In 2025, it became clear that the goal of limiting warming to 1.5°C is no longer plausible (Section 3.1). Although preventing the worst impacts of climate change remains an essential global task, 1.5°C or net zero by 2050 scenarios now offer little practical guidance. “Overshoot” scenarios where temperatures exceed 1.5°C but then decline are technically possible, and some are consistent with historical growth rates for other technologies.9 Still, the scale of negative emissions deployed in many ambitious climate scenarios raise a host of difficult questions regarding trade-offs in land use, water consumption, and more.10
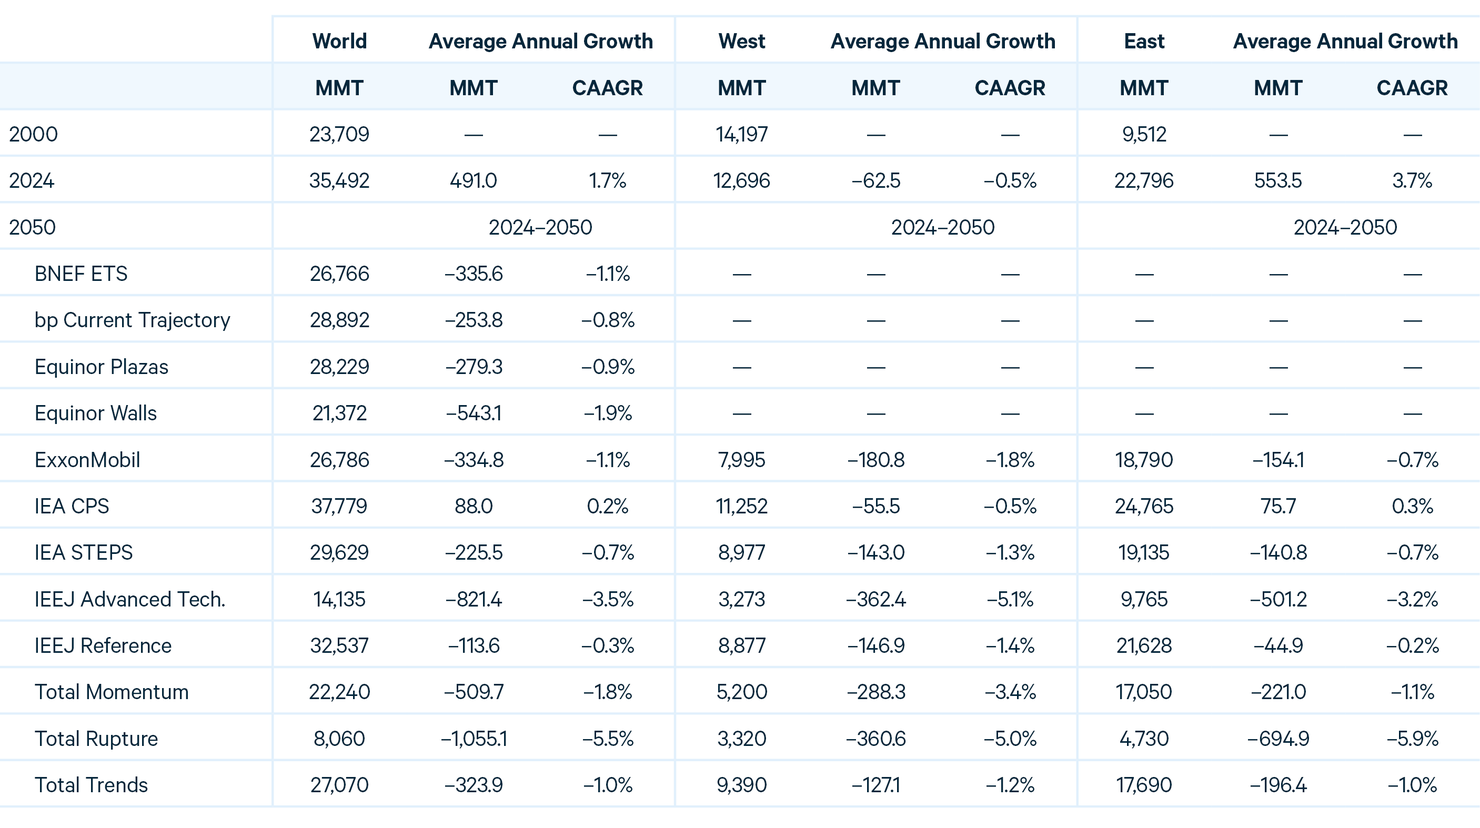
Greenhouse gas (GHG) emissions continue to grow, with global energy-related CO2 emissions exceeding 38,000 million metric tons (MMT) in 2024. Although nearly all scenarios project a peak in emissions between 2030 and 2035, reductions by 2050 vary enormously (Figure 1). IEA’s Net Zero Emissions by 2050 (NZE) scenario diverges dramatically. In that scenario, emissions fall by 13.4 percent annually in compound average annual growth rate (CAAGR) terms through 2050. For reference, the largest global drop in CO2 emissions this century was in 2020, when emissions fell by 5 percent as a result of the COVID-19 pandemic.
Figure 1. World Net CO₂ Emissions
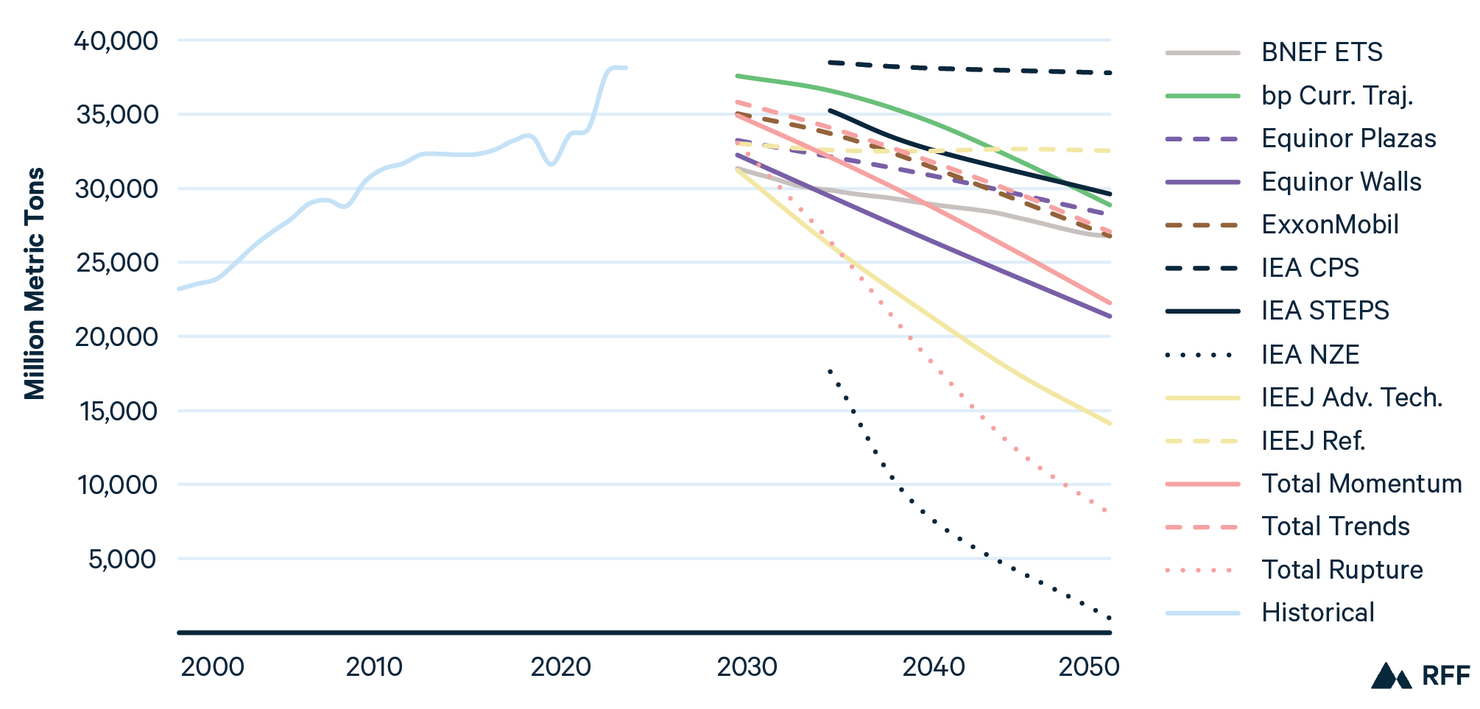
Notes: Historical data from IEA. Complete data for bp’s Below 2°C scenario are not available.
Some reference scenarios, such as IEA CPS and IEEJ Reference, project a rough plateau of emissions through 2050, while reference scenarios from Equinor, ExxonMobil, and Total show emissions falling by 29 percent by 2050. Evolving policies scenarios vary considerably, with emissions reductions by 2050 ranging from just 6 percent (IEA STEPS) to 62 percent (IEEJ Advanced Technologies) compared with 2024 levels.
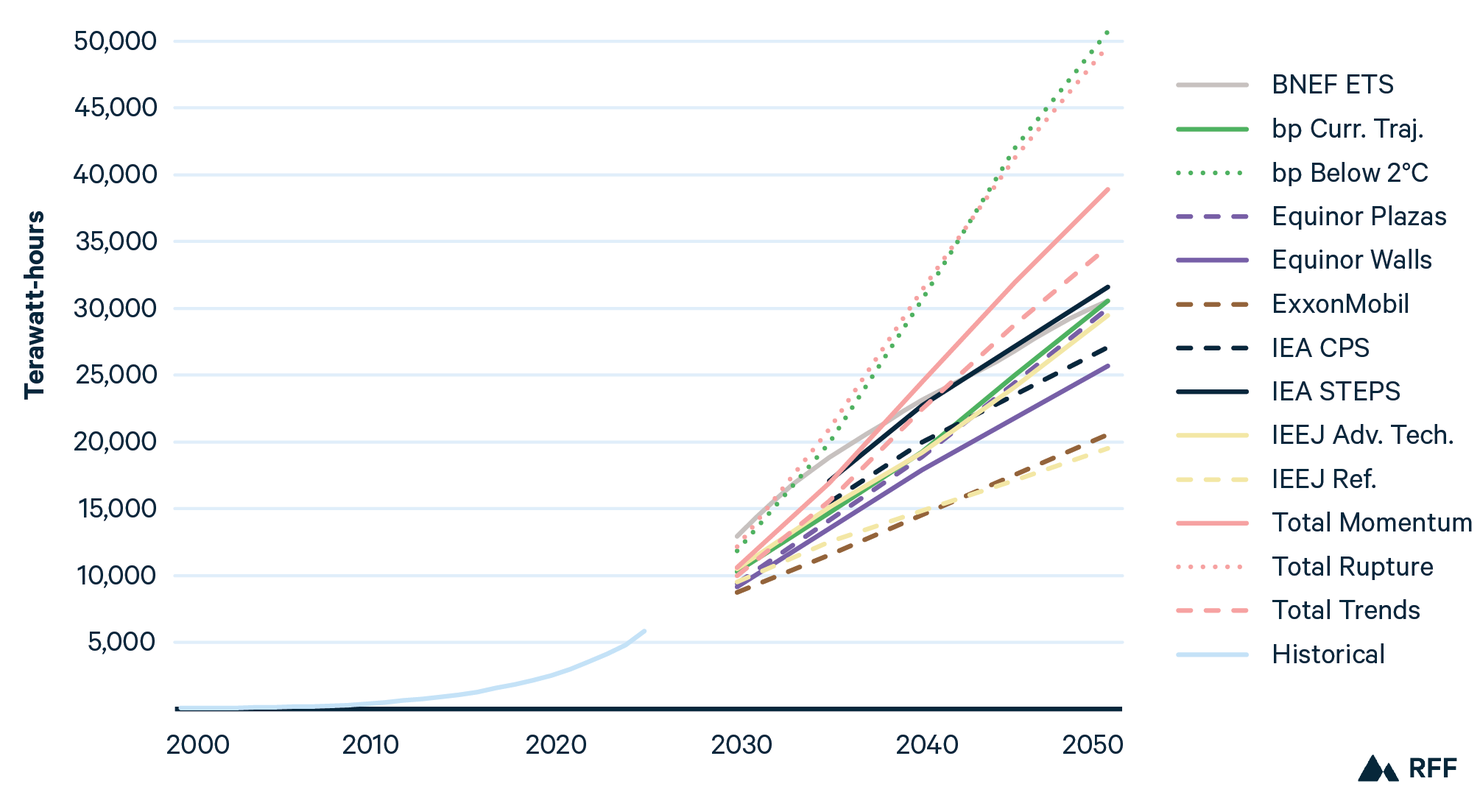
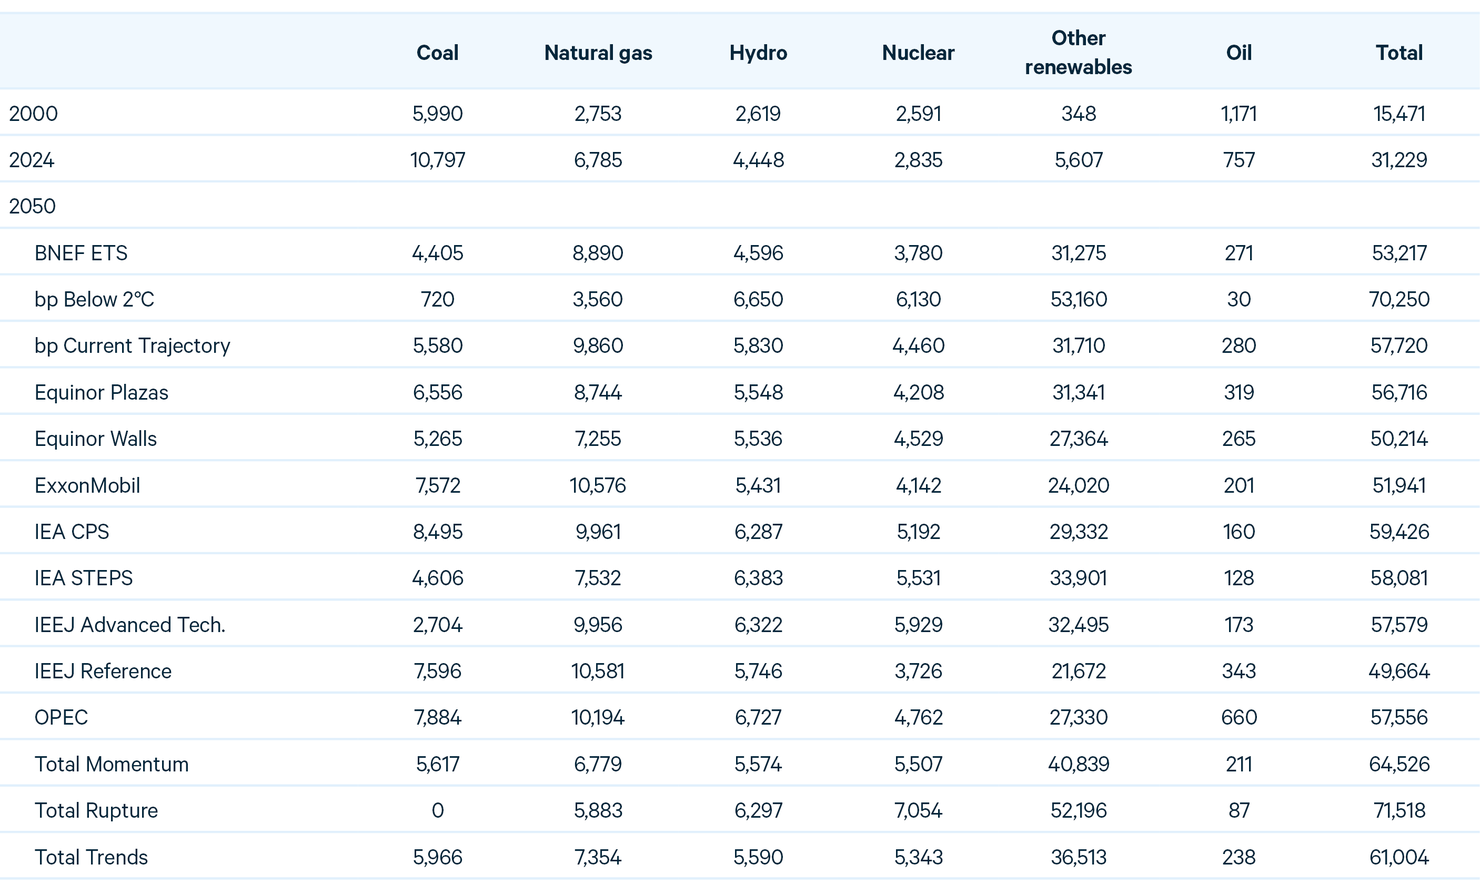
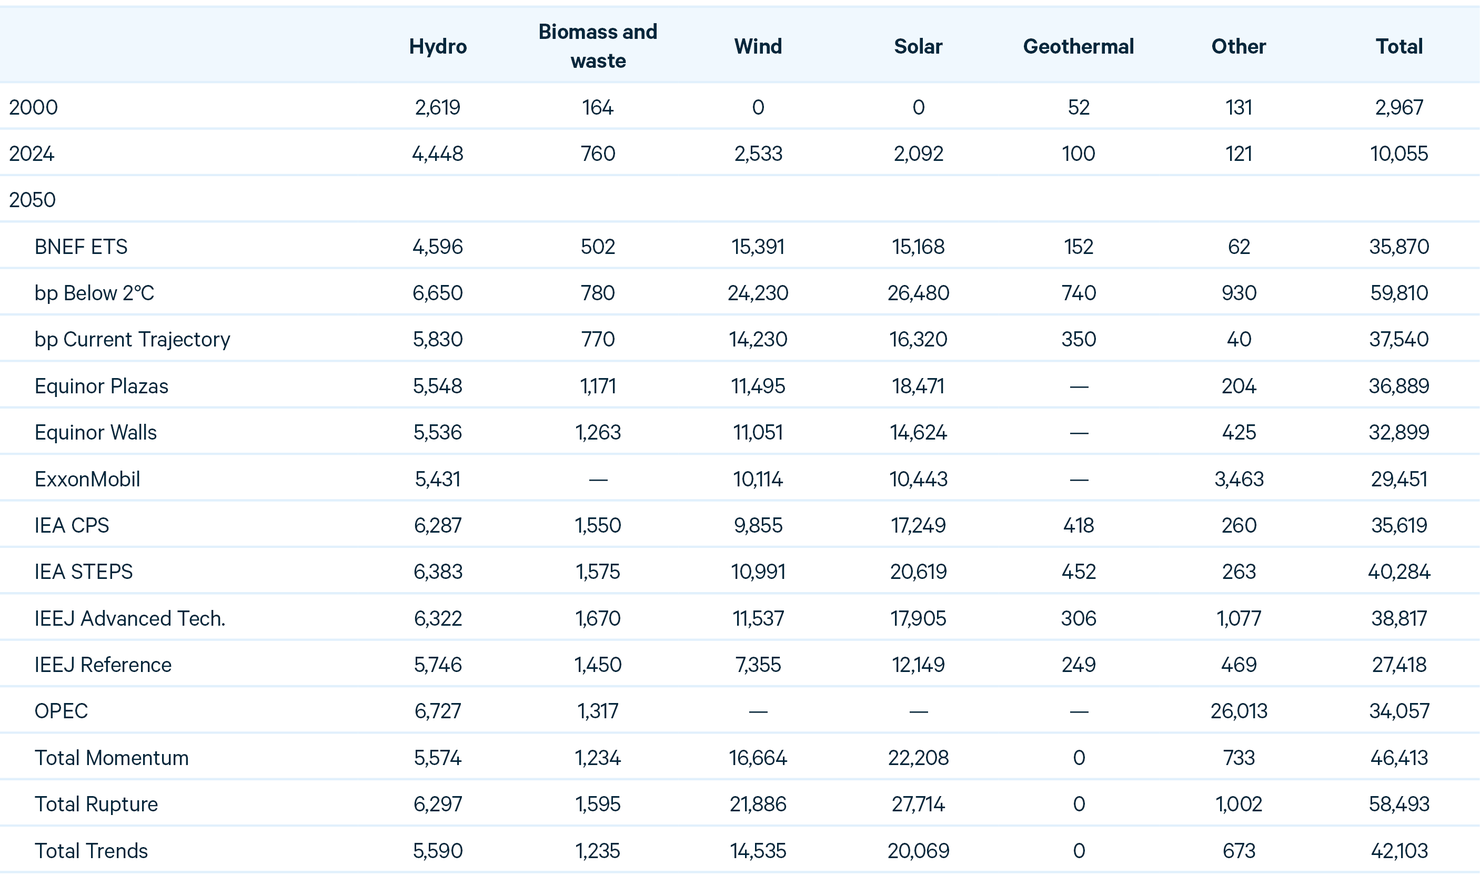
Global electricity demand surges. From 2000 to 2024, world power generation roughly doubled. Over the next 25 years, growth ranges from a low of 59 percent (IEEJ Reference) to more than doubling again under ambitious climate scenarios. Under all scenarios, growth is led by wind and solar (Figure 2).
Figure 2. World Electricity Generation in 2050
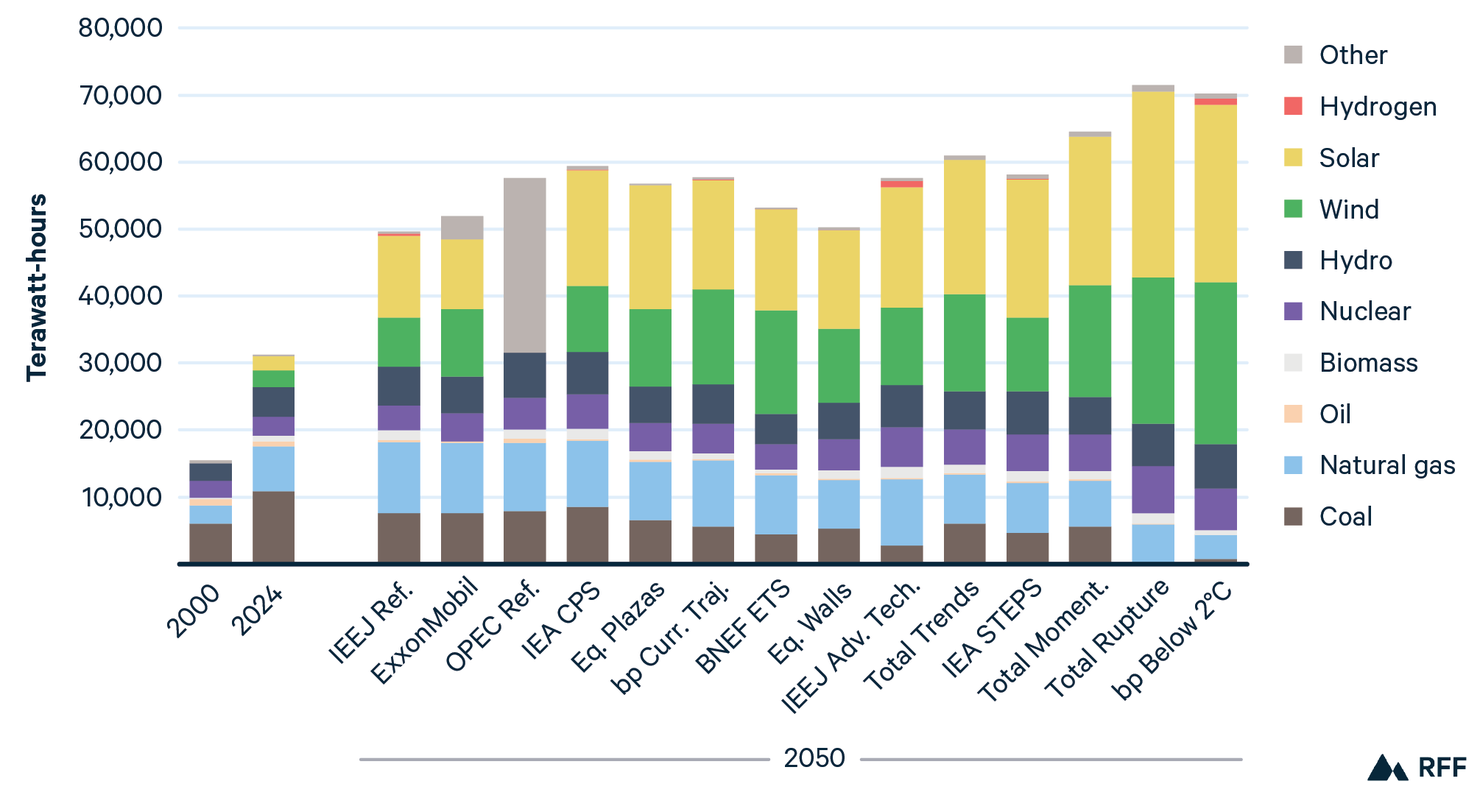
Source: Historical data from IEA.
Note: 2050 scenarios ordered from highest to lowest total levels of fossil fuels. “Other” includes wind and solar for OPEC. IEA includes curtailed electricity generation, while others do not.
Although CO2 emissions are far off track from global goals, renewables are projected to lead world electricity generation. Combined, wind and solar account for 40–72 percent of world electricity generation by 2050. When hydro, biomass, and geothermal are included, renewables rise from 30 percent in 2024 to between 52 and 70 percent under reference and evolving policies scenarios by 2050, and exceed 80 percent under ambitious climate scenarios.
Nuclear energy also grows considerably under all scenarios. Although no scenario envisions a tripling of nuclear energy by 2050, as more than a dozen nations have pledged,11 nuclear grows by 31 percent under the most bearish scenario (IEEJ Reference) and more than doubles under ambitious climate scenarios.
Under all scenarios, coal power declines by 2050, ranging from a fall of 21 percent (IEA CPS) to a complete phaseout under Total’s Rupture, with the median scenario (bp Current Trajectory) showing a decline of 48 percent. Natural gas, on the other hand, increases under all reference and evolving policies scenarios. Under these scenarios, growth ranges from 7–8 percent (Equinor Walls, Total Trends) to 56 percent (IEEJ and ExxonMobil Reference) above 2024 levels by 2050.
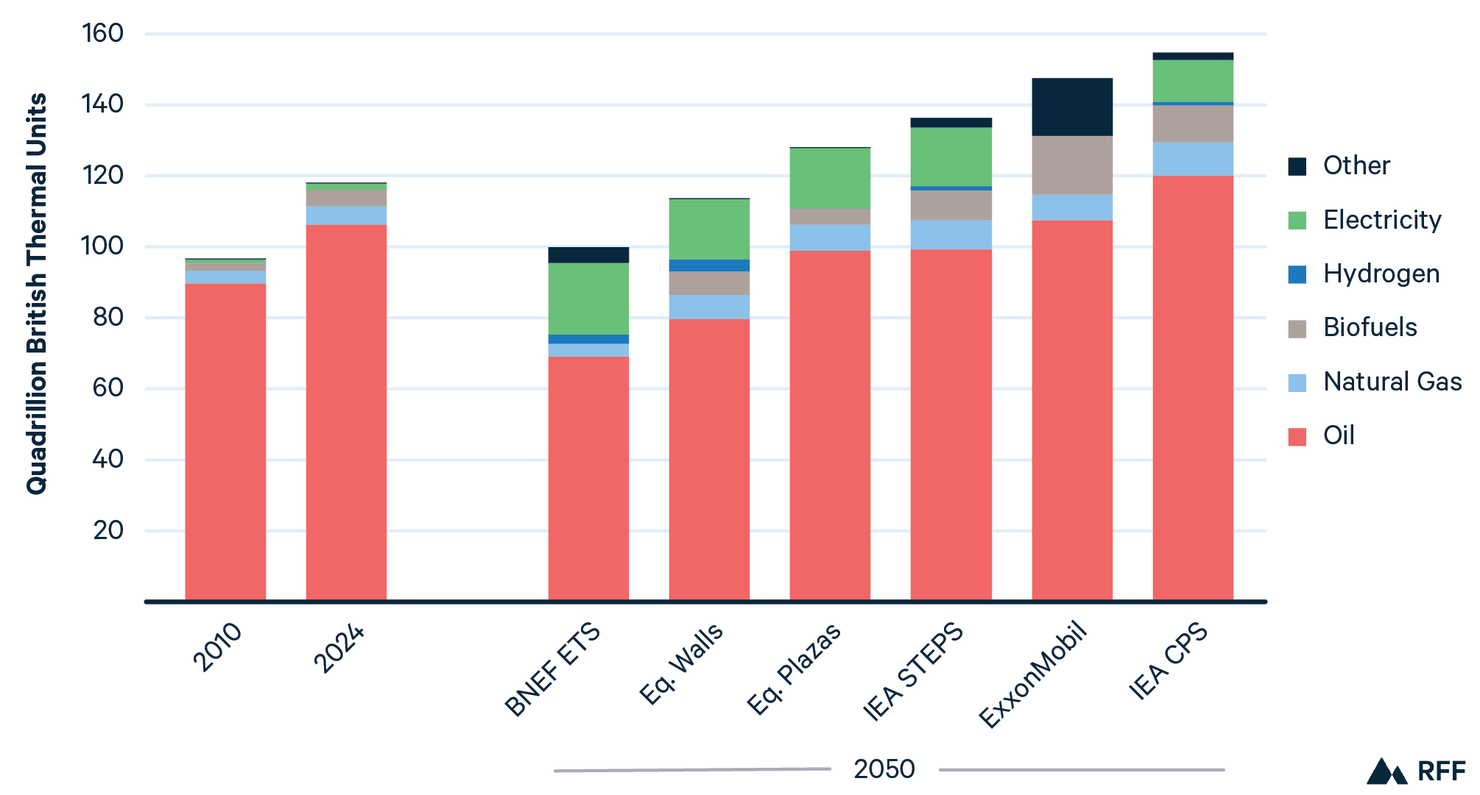
Global primary energy demand grows slowly through 2050. Under all scenarios other than IEA CPS, average annual growth rates are well below 1 percent, and in four scenarios, primary energy demand declines by 2050 (Figure 3).
Figure 3. World Primary Energy Demand in 2050
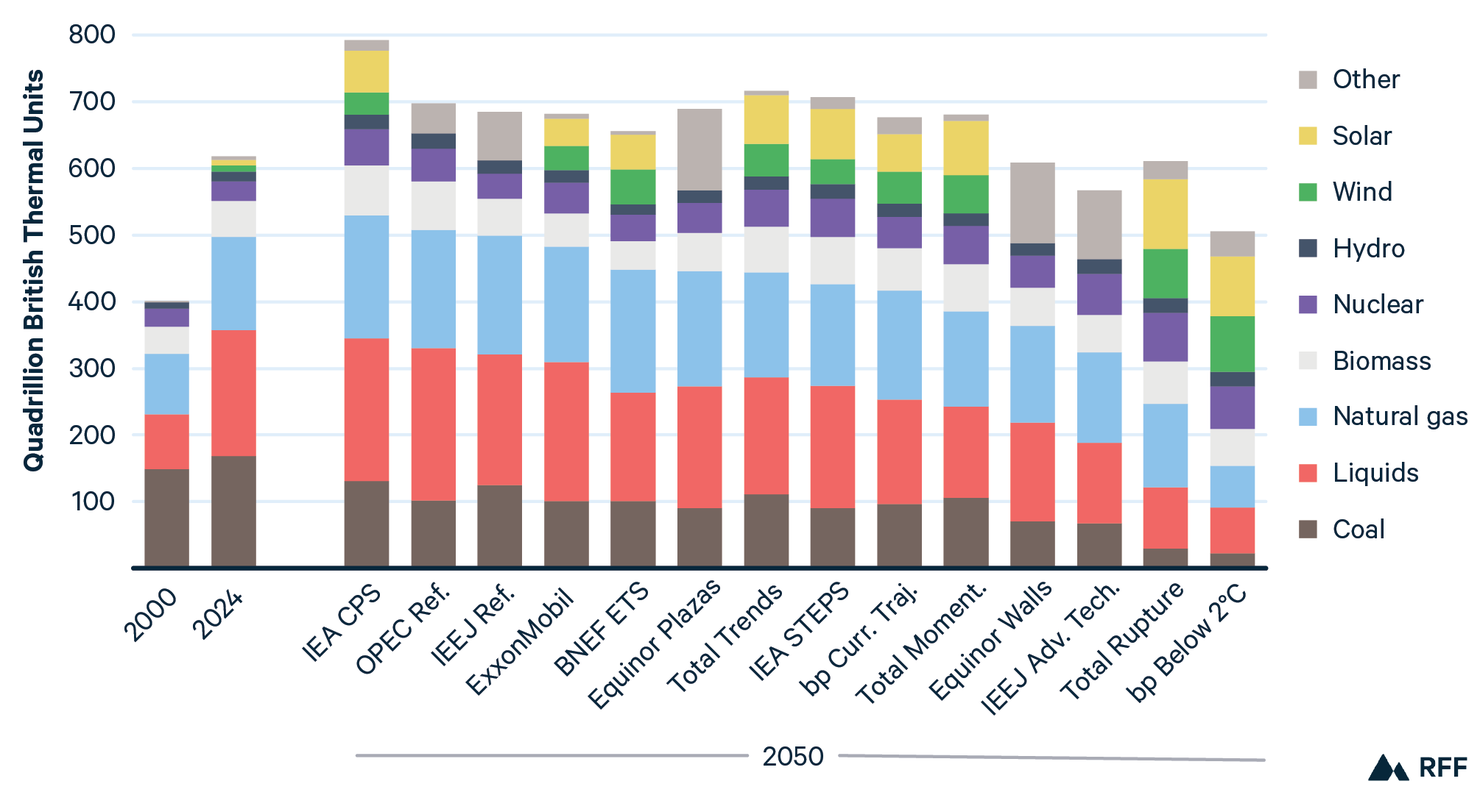
Source: Historical data from IEA.
Note: Projections ordered from highest to lowest demand for fossil fuels. “Biomass” excludes biofuels, which are included in “Liquids.” “Other” includes wind and solar for IEEJ, Equinor, and OPEC and hydro for BNEF.
The primary energy mix changes considerably under all scenarios. Renewables, led by wind and solar, rise from roughly 15 percent of the mix in 2024 to more than 20 percent by 2050, with the median scenario hovering around 30 percent. Although total primary energy grows by 1 percent or less, renewables grow by 1.6 percent in CAAGR terms under the most bearish scenario (OPEC Reference) and by more than 3 percent annually under a majority of scenarios.
Do these gains by renewables represent a global energy transition or further energy additions? The answer is mixed. Under all scenarios, coal declines by 2050, falling by at least 1 percent annually in CAAGR terms. Liquids (primary oil) grow modestly under reference scenarios but decline slowly in evolving policies scenarios, falling by just 0.1 percent annually under IEA STEPS. Natural gas, on the other hand, grows under all but three scenarios, with considerably variation in the growth rate. For example, natural gas accounts for as much as 28 percent of the global energy mix by 2050 under BNEF ETS but plays a smaller role in IEA’s CPS and STEPS scenarios, accounting for 22 and 23 percent, respectively.
While the prospects for coal have improved in the United States under the Trump administration (Section 3.2), global coal demand is—and will continue to be—dominated by the global East. Although the East and West consumed a similar amount of coal at the turn of the century, the East (led by China) used almost six times more by 2024. Coal declines in both regions across all scenarios, but the rates of decline vary widely (Figure 4).
Figure 4. Coal Demand by Region
Source: Historical data from the Energy Institute.¹²
Falling coal demand in the East is driven by China as coal retires amid its build-out of nuclear and renewables. Chinese coal demand falls by 36 percent under the most bullish scenario (IEA CPS) and by 60 percent under IEA STEPS. In India, the region’s second-largest consumer, coal grows strongly but with wide variation, ranging from 28 percent under OPEC and IEA CPS to 77 percent under IEEJ’s Reference. Elsewhere in Asia-Pacific, coal remains roughly flat under reference scenarios but declines under evolving policies scenarios, falling by 20 percent under IEA STEPS.
In the Americas, CIS, and Europe, coal declines considerably under all scenarios by 2050, with the most bullish scenario (IEA CPS) projecting a decline of 36 percent. Under that scenario, US coal demand falls by 43 percent. For all other scenarios, the declines are much more pronounced for the United States, with coal falling by more than 75 percent by 2050. In Europe and CIS, coal falls by roughly one-third under the most bullish scenarios and by 50 percent or more under other outlooks.
World demand for oil is driven increasingly by the East, and that trend continues under reference scenarios, with continued growth in the East and slow declines in the West. Under most evolving policies scenarios, however, oil demand falls modestly in the East and more rapidly in the West, declining by more than 20 percent (Figure 5).
Figure 5. Oil Demand by Region
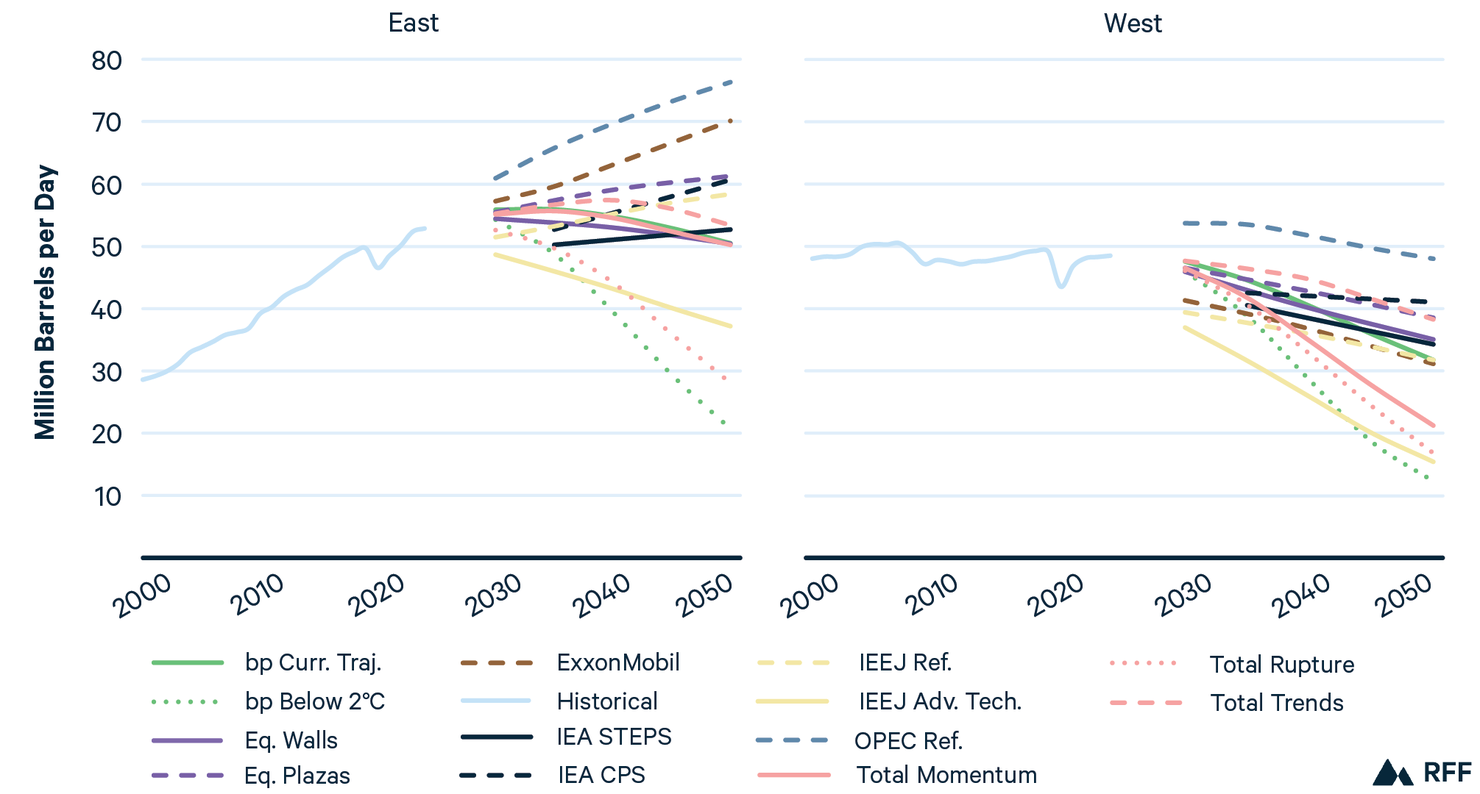
Source: Historical data from the Energy Institute.¹²
Note: All outlooks other than IEA and IEEJ include bunker fuels by region of origin
Although oil demand declines in the West under all scenarios, outlooks envision variation within the region. In 2024, the United States accounted for 41 percent of regional oil demand, a figure that stays roughly flat under IEA’s STEPS and CPS, but falls under most other scenarios. European and CIS demand declines in all scenarios, while Latin America grows under all reference and evolving policies scenarios.
In the East, China accounted for roughly one-third of oil demand in 2024. But Chinese demand falls under all but two scenarios (OPEC Reference and Equinor Plazas) through 2050, declining to roughly one-quarter of regional demand under most scenarios. This decline is driven in large part by China’s rapid electrification of its light-duty and, increasingly, medium- and heavy-duty vehicle fleet. In India, oil demand growth is robust, more than doubling in reference scenarios and rising by 40 to 70 percent under evolving policies scenarios. In high-income Asia-Pacific nations, such as Australia, South Korea, and Japan, oil demand declines steadily in the few scenarios that include relevant data.
In Africa, oil demand grows rapidly, roughly doubling under reference scenarios from ExxonMobil, IEA, and OPEC and rising in the range of 60 to 70 percent under evolving policies scenarios from bp, IEA, and Total. This growth is due largely to a growing population and rapidly rising GDP, which roughly triples by 2050 in projections from IEA and OPEC.
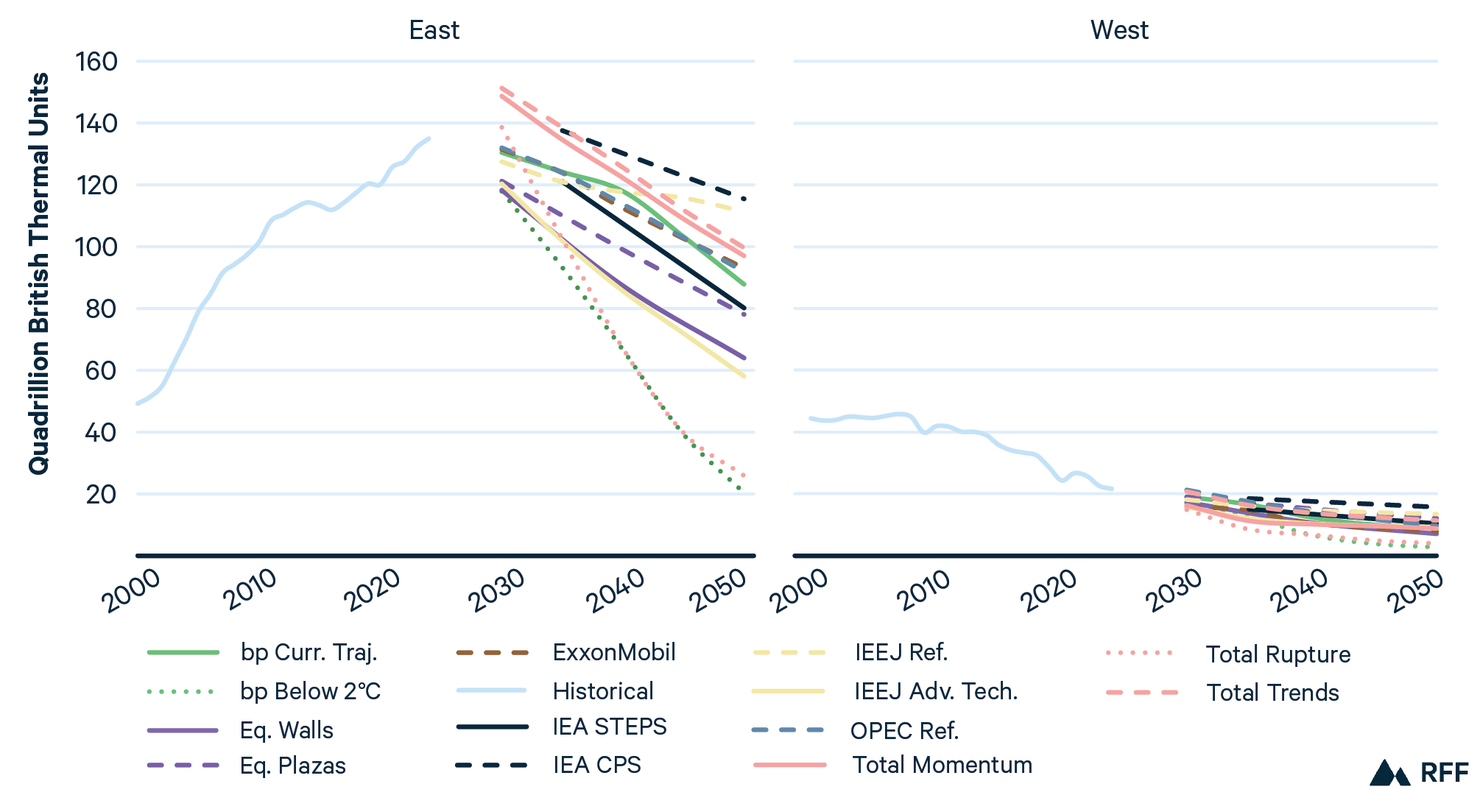
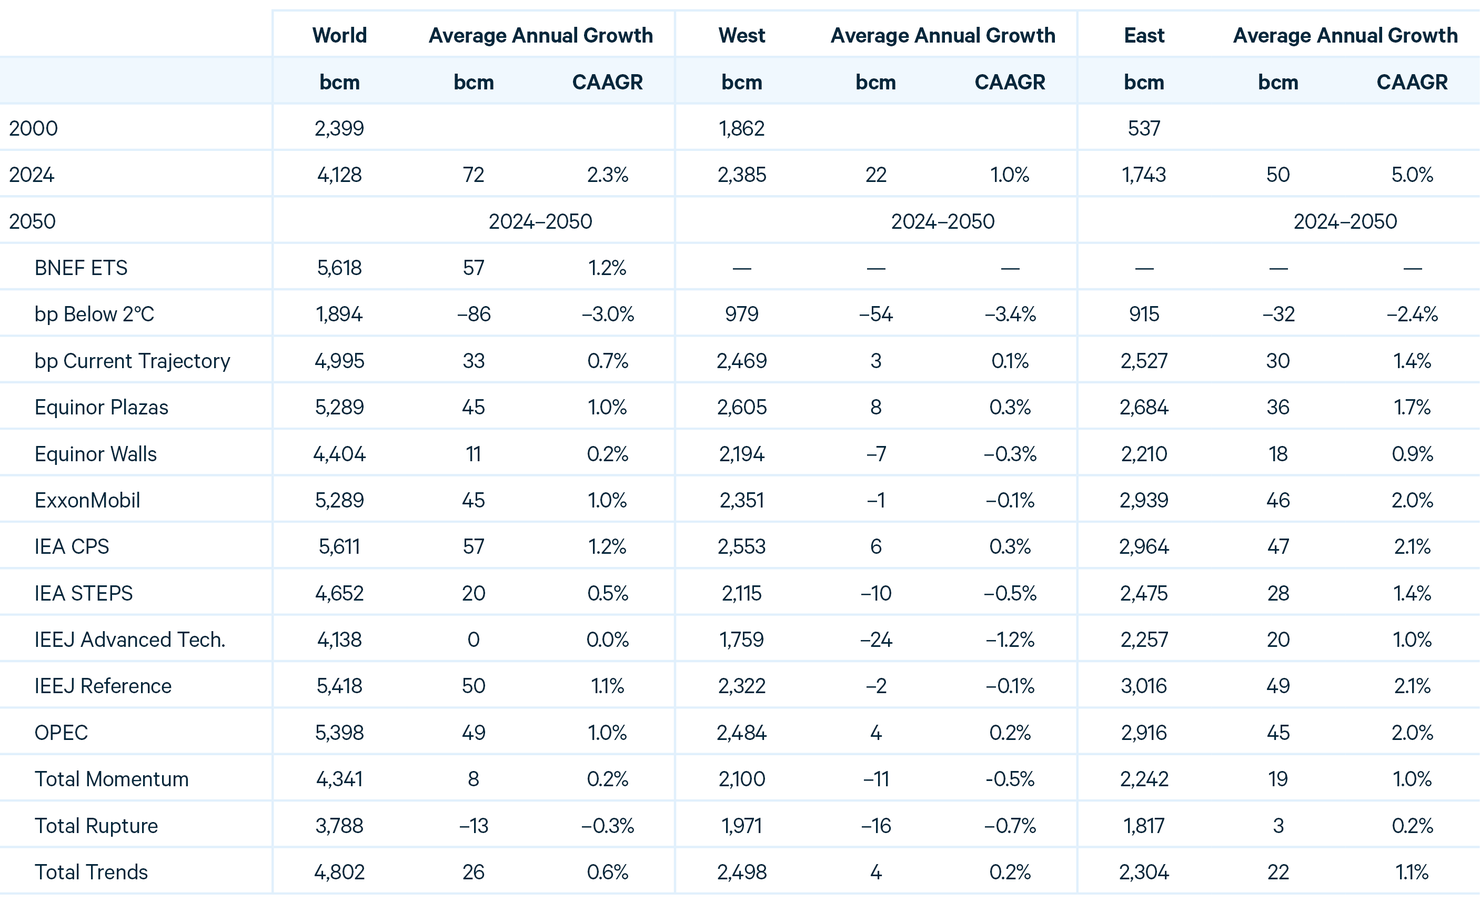
Demand for natural gas grows globally under reference and evolving policies scenarios, with divergence between the East and West. Under evolving policies scenarios, gas demand in the East grows by more than 1 percent annually in CAAGR terms and by roughly 2 percent under reference scenarios. In the West, however, demand is roughly flat in Reference scenarios and declines moderately under evolving policies scenarios.
Figure 6. Natural Gas Demand by Region
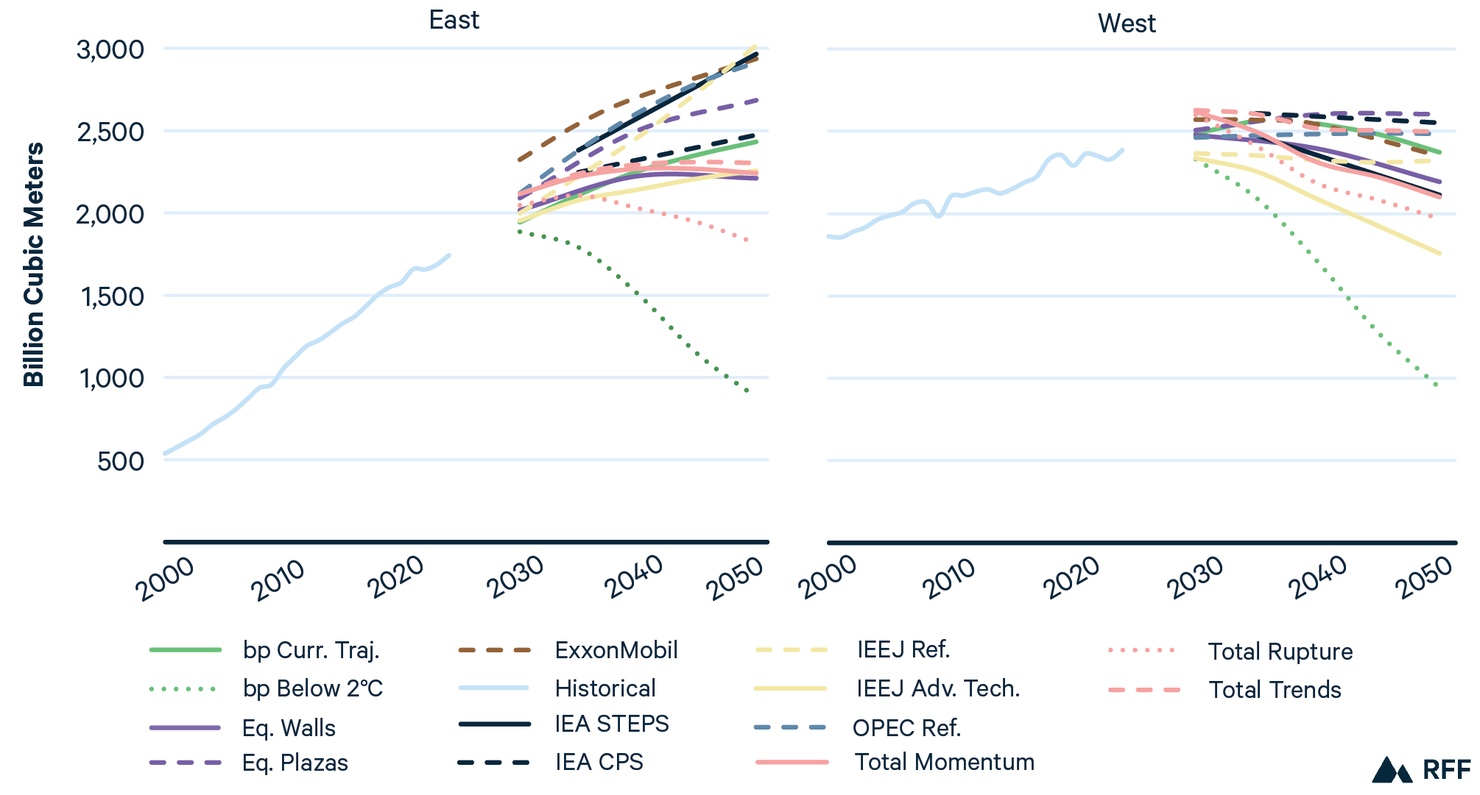
Source: Historical data from the Energy Institute.¹²
Note: ExxonMobil includes flared natural gas.
In the East, China and the Middle East account for roughly 60 percent of gas demand today. In China, central scenarios envision CAAGR of roughly 1–2 percent through 2050, although the IEEJ’s projections are more bearish (CAAGR of 0.4 percent and –3.6 percent under Reference and Advanced Technologies scenarios, respectively). In the Middle East, growth ranges from 1.1 to 2.3 percent in CAAGR terms under reference and evolving policies scenarios. Total’s projections, however, are generally more bearish than other outlooks, with projected growth of 0.7 percent under its Momentum and Trends scenarios.
Although it accounted for just 75 bcm in 2024, demand in India rises by roughly 3–5 percent in CAAGR terms, more than tripling by 2050 under several scenarios. Projections for Africa under evolving policies scenarios range from 1.3–1.9 percent annually, while reference scenarios see growth rates between 2.5 and 3.7 percent.
In the West, demand rises in Latin American but declines in Europe across all scenarios, while holding steady across the CIS. In the United States and North America more broadly, gas demand is flat in reference scenarios but declines slowly under evolving policies scenarios.
Under all scenarios, wind and solar more than double by 2050. However, the rapid pace of recent deployment suggests that many of these projections may be overly bearish. Wind and solar generation grew globally by more than 18 percent annually in CAAGR terms from 2014 to 2024, and increased by 16 percent in 2024. In the most bullish scenario (bp Below 2°C), wind and solar follow a CAAGR of 9 percent through 2050, while annual growth slows to 5 percent in more bearish scenarios from ExxonMobil and IEEJ (Figure 7).
Figure 7. World Wind and Solar Electricity Generation
Source: Historical data from BNEF.
Another way to view the growth of wind and solar is to compare it with overall electricity demand growth. In 2024, global electricity generation increased by 1,254 terawatt-hours (TWh). Over that period, wind and solar increased by 650 TWh, representing more than half of all new global power generation in 2024. By comparison, coal, natural gas, and nuclear generation rose by 110, 155, and 95 TWh, respectively.
At COP28 in 2023, more than 100 nations committed to tripling renewable power generation capacity by 2030.13 In 2024, global renewable capacity grew by 16 percent, with wind and solar accounting for 95 percent of that growth. If renewables continue to grow by 16 percent annually, global capacity will have nearly tripled by 2030. To be sure, maintaining a 16 percent annual growth rate is far from inevitable and will require continued policy support and aggressive investment.
The growth of electricity demand is a central narrative in 2025 energy outlooks. This anticipated growth is largely attributable to the artificial intelligence (AI) boom, the electrification of transportation, and expansion of air-conditioning around the world. As IEA notes in its outlook, electricity demand from data centers is expected to double between 2024 and 2030.5 We can observe the impacts of this dynamic by comparing outlooks produced in 2022 (before the rapid growth of AI-powered tools) with those from 2025 (Figure 8).
Figure 8. Projected Global Electricity Generation, 2022 and 2025
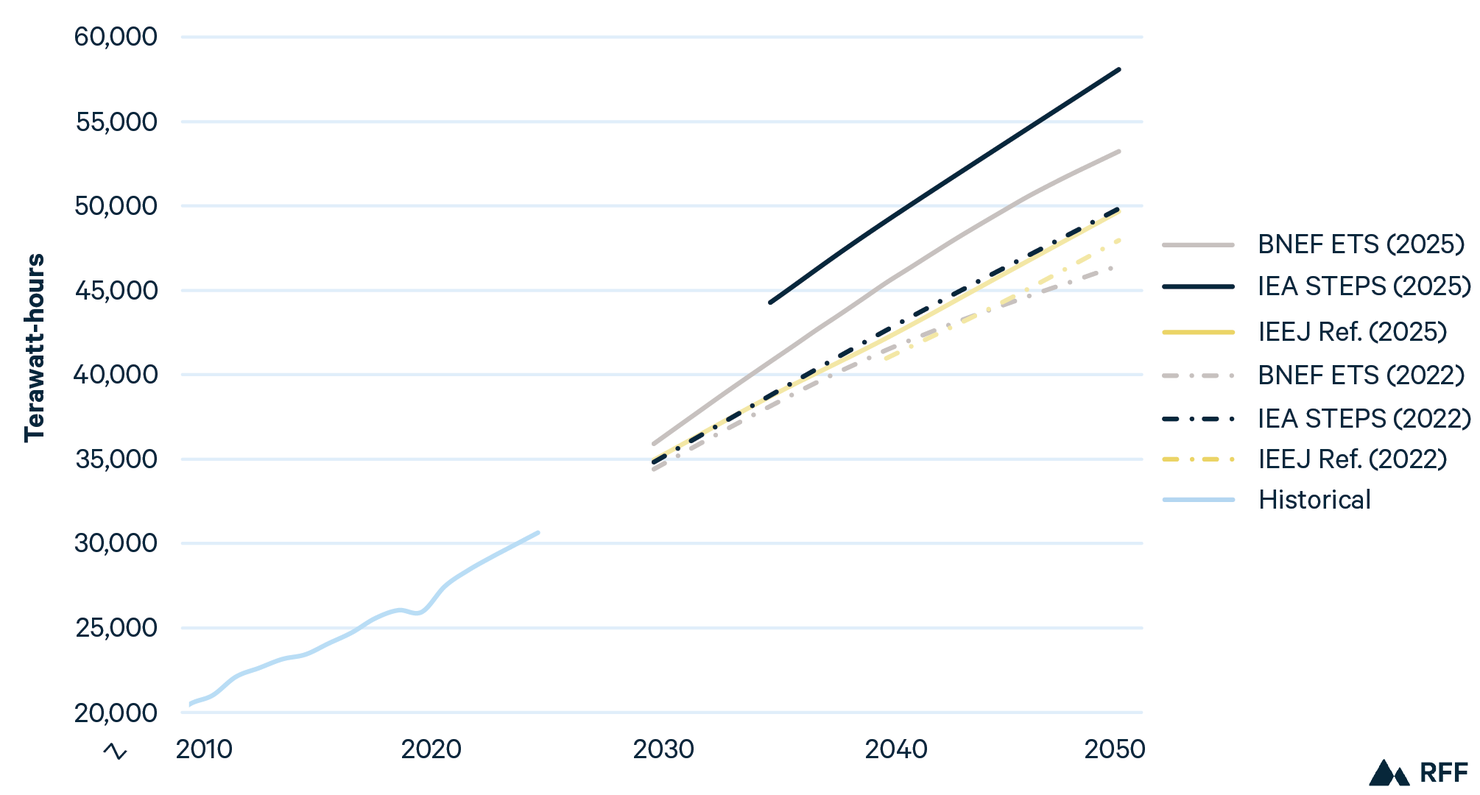
Source: Historical data from BNEF.
Outlooks from BNEF, IEA, and IEEJ have revised their estimates upward, with 2025 scenarios forecasting a CAAGR of at least 2 percent from 2024 to 2050. The 2025 projections for the year 2050 are 7,000–8,000 TWh higher for IEA STEPS and BNEF compared with equivalent scenarios from 2022, although IEEJ’s Reference scenario shows more modest upward revision (2,000 TWh). These adjustments range from a 3.6 percent increase (IEEJ Reference) to a 16.5 percent increase (IEA STEPS) from 2022 estimates. Higher projected demand is satisfied in large part by wind and solar, as we detail in Section 3.3.
Projections for the global transportation sector in 2050 show a more diverse mix of energy sources, while still relying primarily on oil. Oil accounted for 90 percent of global transport energy use in 2024, but oil’s share in 2050 ranges from 69 percent (BNEF ETS) to 78 percent (IEA CPS). Although its shares decrease, the total volume of oil consumed remains fairly stable or increases (IEA CPS) in most scenarios, but declines considerably under scenarios from BNEF and Equinor (Figure 9).
Figure 9. World Transportation End-Use Energy by Fuel
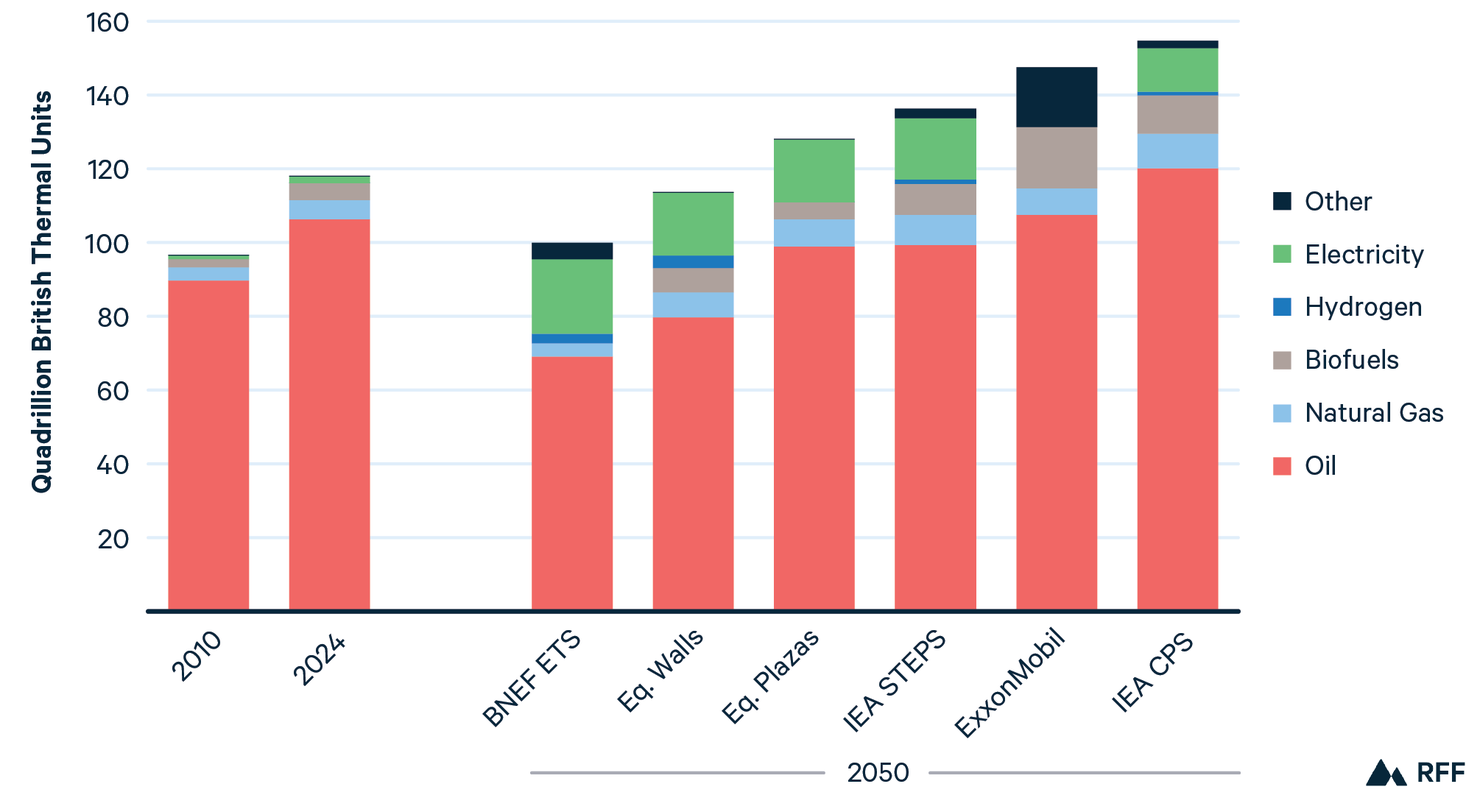
Source: Historical data from IEA.
Note: “Other” includes biofuels and other sources for BNEF and hydrogen, electricity, and other sources for ExxonMobil. Scenarios ordered from lowest to highest level of oil demand in 2050.
Electricity use in transportation grows by a factor of 6 to 10 by 2050, rising to account for as much as 20 percent of the energy mix in BNEF ETS. Biofuels also grow under most scenarios, rising to as much as 11 percent of the fuel mix (17 QBtu) by 2050 under ExxonMobil’s Reference scenario. Hydrogen’s contributions are modest, reaching a high of 2–3 percent (roughly 3 QBtu) in BNEF ETS and Equinor Walls, with most consumption occurring in heavy-duty transportation modes such as long-distance shipping.
Overall energy demand varies widely across these scenarios. These divergences are driven by several factors, including different assumptions around policy development, different views about the speed of technological innovation, and varying assumptions about the rate of fleet turnover. We provide additional data and analysis in Section 3.4.
Although CO2 emissions have been rising steadily, the global economy has become far less carbon intensive and much wealthier (Section 3.5). In the 1970s, the carbon intensity of the median nation was 2.4 tons of CO2 per $1,000 GDP (2021 US$), while median GDP per capita was roughly $5,000. By the 2020s, the median nation’s carbon intensity was just 0.3 tons per $1,000, while median GDP had grown to more than $16,000 per capita (Figure 10).
Figure 10. CO₂ Emissions, GDP per Capita, and CO₂ Intensity for over 100 Nations
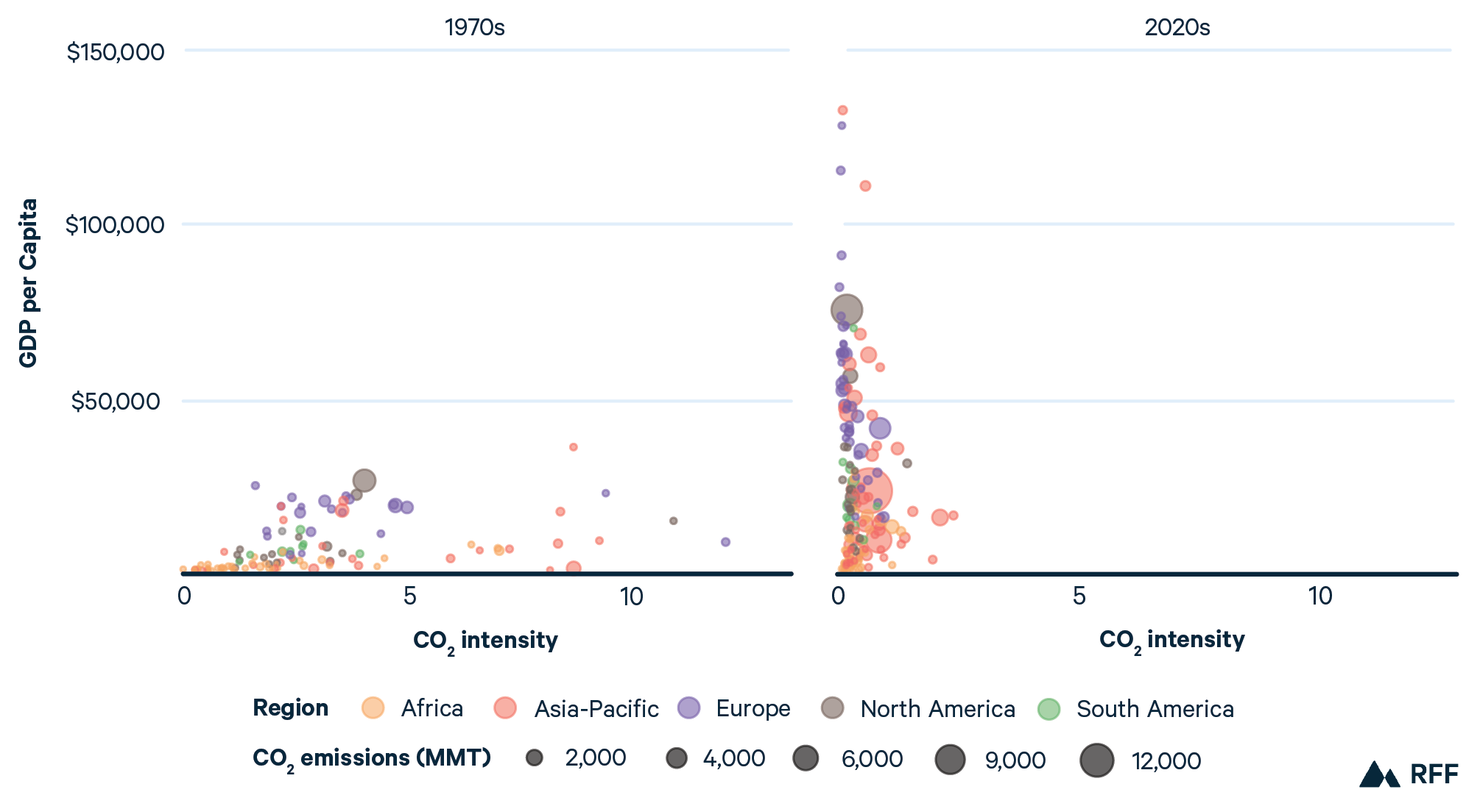
Sources: GDP data from Eurostat, OECD, IMF, and World Bank¹⁴ with minor processing by Our World in Data. Emissions data from the Global Carbon Budget¹⁵ with major processing by Our World in Data.
Note: Two nations (Qatar and the United Arab Emirates) are excluded from the 1970s figure because their values exceeded 20 metric tons per $1,000 GDP, which makes the figure difficult to interpret. The 1970s include the years 1970–1979 inclusive, and the 2020s data includes 2020–2024 inclusive.
Key drivers of these trends include energy efficiency measures enacted in the wake of the oil price shocks of the 1970s, along with the deployment of nuclear, wind, and solar. Climate policies have also played an important role, driving down emissions intensities in developed economies, particularly in Europe. Recent disruptions in global flows of oil and liquified natural gas due to the conflict in the Middle East could spur another wave of investments in energy efficiency and alternative fuels, but this will depend heavily on policy decisions.
Two examples illustrate historical trends. During the 1970s, the UK’s emissions intensity was roughly 5 tons of CO2 per $1,000 of economic output, with per capita GDP of $19,000. Fifty years later, carbon intensity had fallen to just 0.1 tons per $1,000, while GDP had grown to more than $52,000 per person. This evolution is even more pronounced for Singapore, where emissions intensity has fallen from 9.3 to 0.1 tons per $1,000 from the 1970s to the 2020s, while per capita GDP has grown from $9,500 to $132,000.
3. In Focus
3.1. The Road Not Taken: How the World Lost the Goal of 1.5°C
In recent years, as the impacts of climate change have become more apparent, world leaders have increased the ambition of their goals to limit warming, reflected in the Paris Agreement “stretch goal” of 1.5°C. But despite this increased ambition, consumption of coal, oil, and natural gas has continued to grow, reflecting the challenges of rapidly transforming the energy system.
In the last three years, global temperatures averaged between 1.44°C and 1.55°C above preindustrial levels.16 Although average temperatures could temporarily recede due to natural fluctuations in Earth systems, it is clear that the world cannot meet its 1.5°C goal. In this section, we look back at ambitious climate scenarios from previous years to understand the road not taken, then describe the largely implausible current scenarios that lead to net zero emissions by 2050.
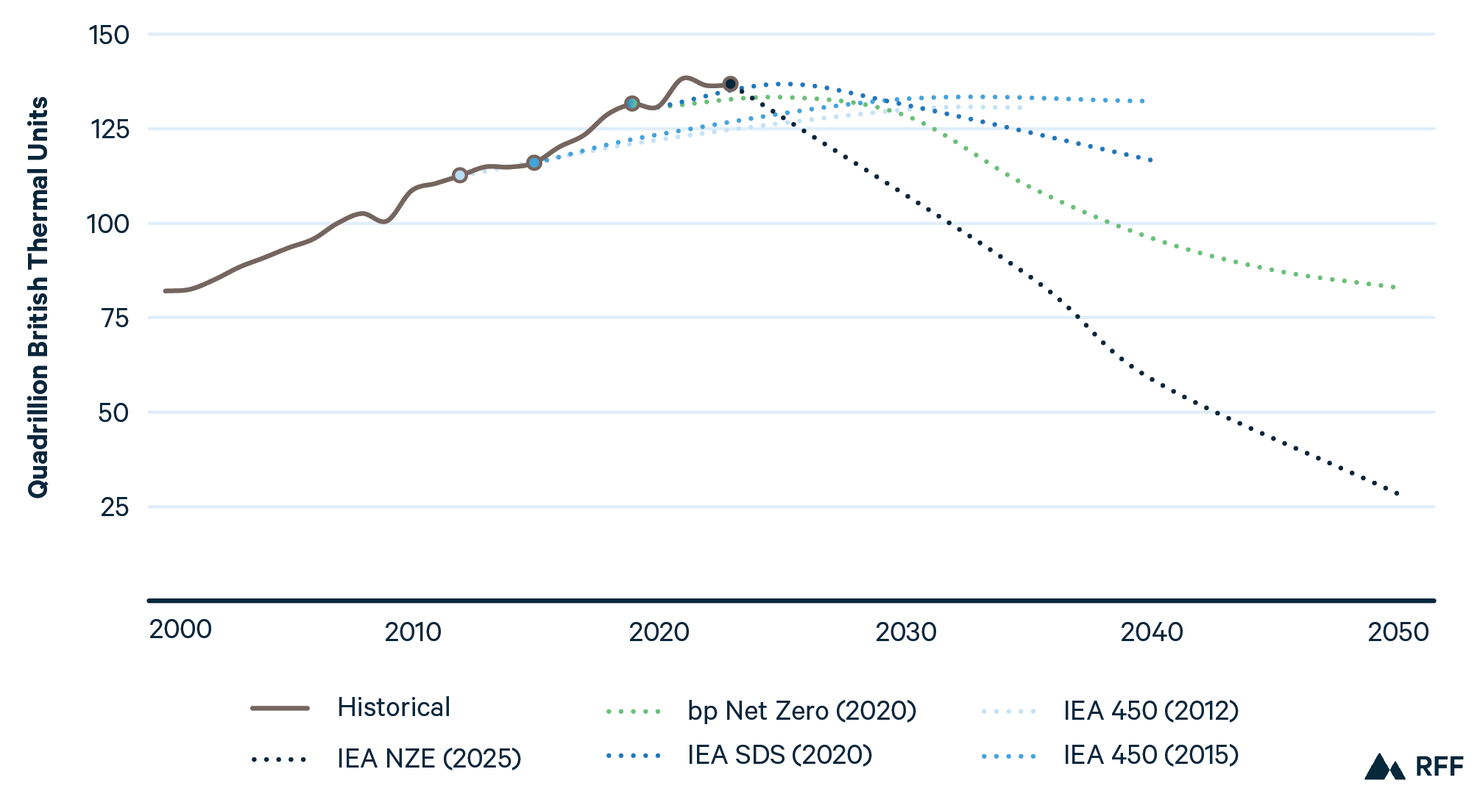
3.1.1. Coal
After roughly a decade of stagnation, global coal demand has surged again. Between 2000 and 2013, coal demand rose by 4.1 percent annually, then hovered around 150 QBtu until 2021, when its global rebound began. Since 2020, coal demand has risen by 3.2 percent annually, reaching a historic peak of 169 QBtu in 2024. (All percentage figures in this section are in CAAGR terms unless otherwise noted.)
In the early 2010s, the reductions in coal demand required to achieve international climate goals were relatively modest. In 2012 and 2015, IEA’s 450 scenario showed coal falling by roughly 2 percent annually. (The 450 scenario is designed to keep warming below 2°C, not 1.5°C, by 2100, and it does not reach net-zero emissions by 2050.)
But because emissions have continued to rise globally, the rate at which coal would need to decline to achieve 1.5°C is simply unrealistic. By 2020, IEA’s Sustainable Development scenario, which also limits warming to 2°C by 2100, envisioned coal falling by more than 5 percent annually. Net zero by 2050 scenarios from bp (in 2020) and IEA (in 2025) stray even further from historical trends, envisioning annual average declines of more than 8 percent (Figure 11). For reference, the largest annual declines in coal consumption this Century have been 3 percent (in 2015, 2016, and 2020).
Figure 11. World Coal Demand History and Projections
Source: Historical data from IEA.¹⁷
3.1.2. Oil
The story for oil is much the same. In the early 2010s, IEA’s 450 scenario envisioned slow and steady declines in global oil consumption, falling by just 0.6 and 1.0 percent per year in the 2012 and 2015 scenarios, respectively. But net zero scenarios from bp (2020) and IEA (2025) envisioned annual average declines of roughly 5 percent. Given recent trends in global oil demand, geopolitics, and domestic political priorities, such a decline appears implausible.
For example, IEA’s most recent medium-term outlook estimates global oil demand will rise by 2.5 million barrels per day from 2024 to 2030, and OPEC’s most recent medium-term projection is even more bullish.7,18 Although IEA’s analysis does envision a peak of global oil demand before 2030, the subsequent decline looks much more like a plateau than a peak followed by the rapid declines envisioned in Net Zero scenarios (Figure 12).
Of course, global geopolitics could upend these expectations. If recent disruptions in oil flows through the Middle East continue or become more pronounced in the coming months and years, the resulting high prices could destroy demand and encourage policymakers to seek alternatives. Much as the high oil prices of the 1970s led to a wave of investments in energy efficiency and alternative fuels, today’s oil market disruptions could plausibly have similar results, reducing future oil demand.
Figure 12. World Oil Demand History and Projections
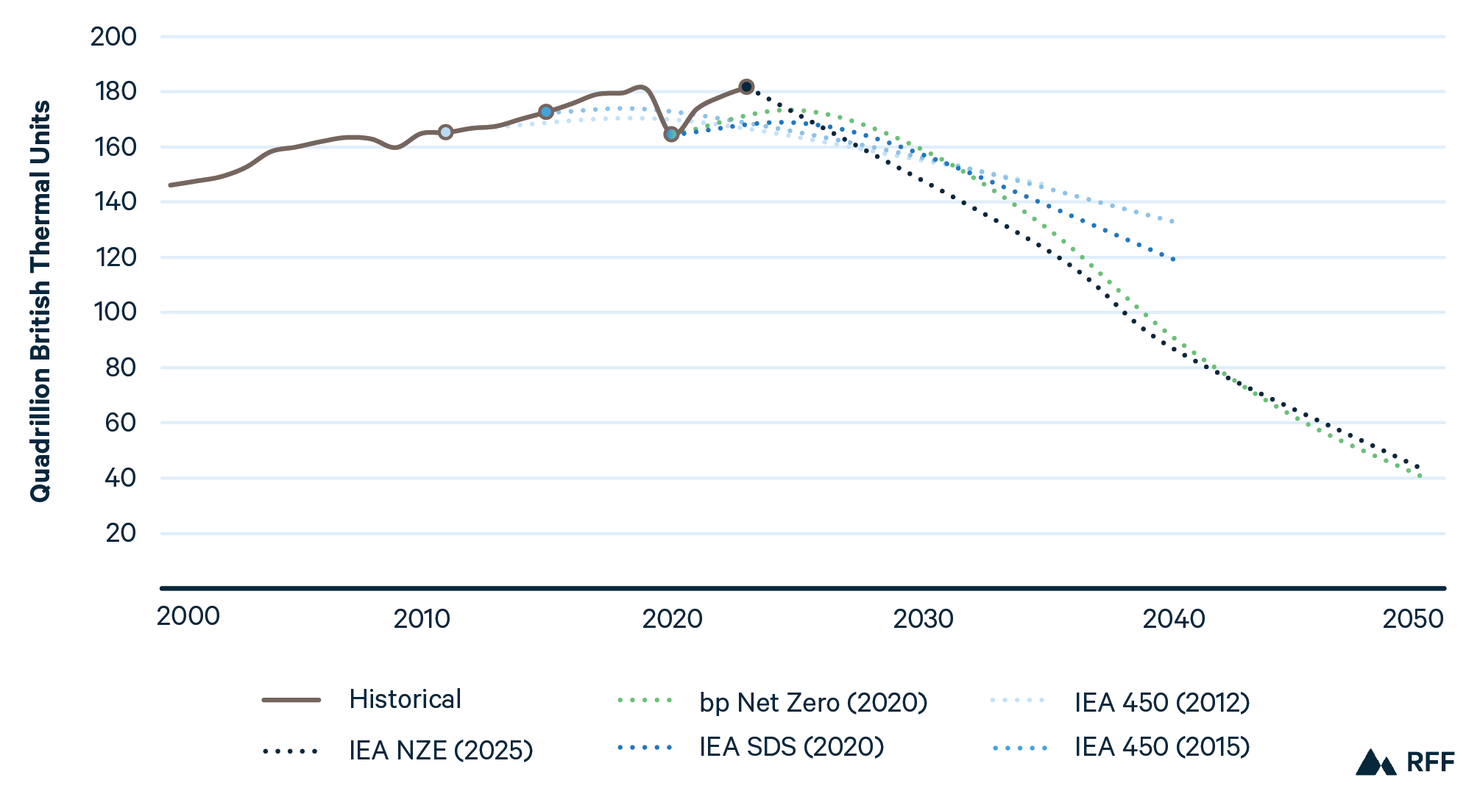
Source: Historical data from IEA.¹⁷
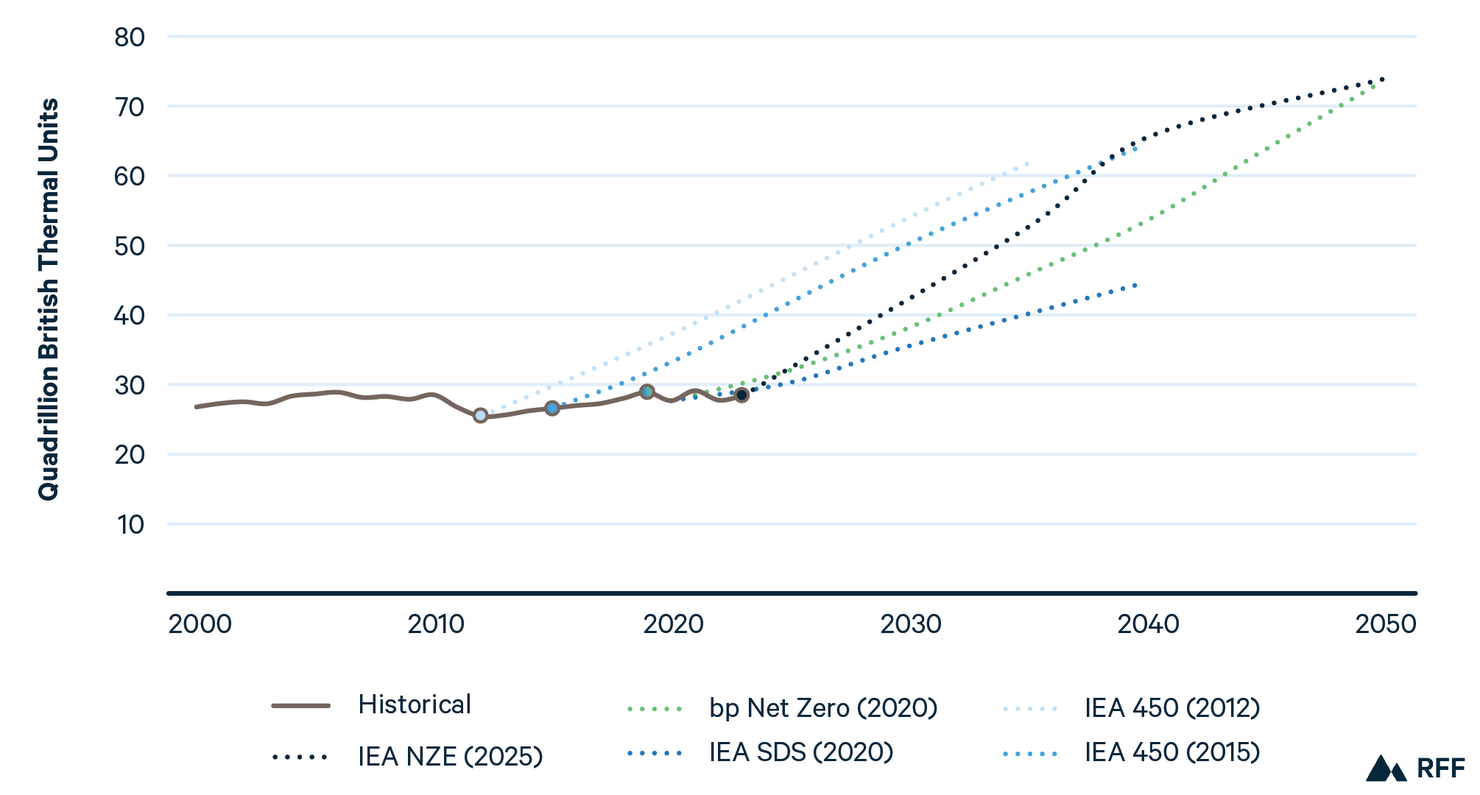
3.1.3. Natural Gas
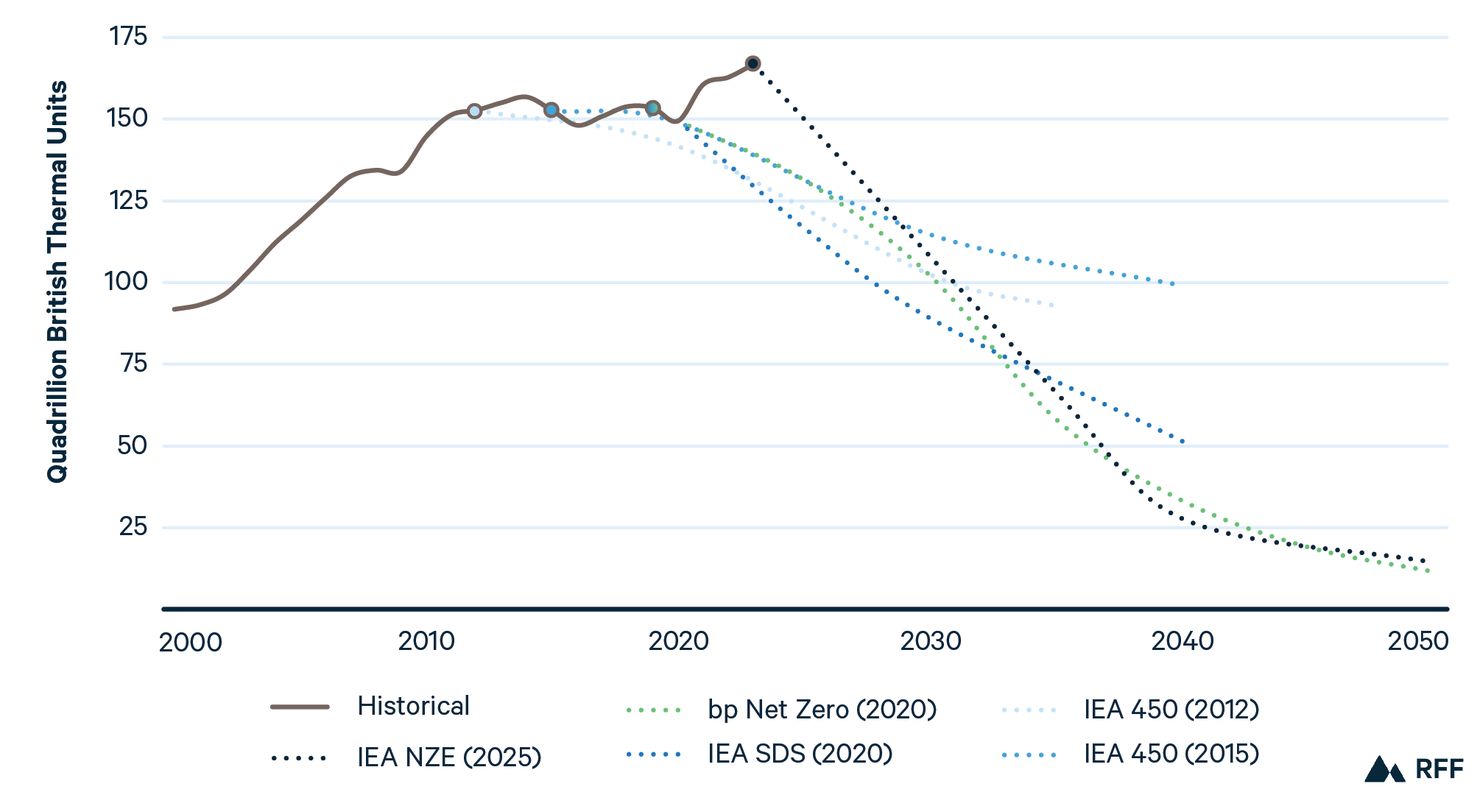
The divergence between ambitious climate scenarios from the 2010s and today is even more pronounced for natural gas. In 2012 and 2015, global gas demand had space to rise, albeit slowly, under IEA’s 450 scenario. By 2020, however, IEA’s Sustainable Development Scenario envisioned global demand falling by 0.6 percent annually through the projection period. Today net-zero scenarios show implausibly rapid declines.
For example, IEA’s 2025 Net Zero scenario shows reductions of more than 5 percent annually through 2050 (Figure 13). Global markets reflect no such decline in demand, with a surge of new liquefied natural gas (LNG) projects coming online and robust demand. Medium-term outlooks from a variety of organizations project that global demand will grow steadily in the coming years, rising by more than 1 percent annually from 2024 through 2030.7,19,20 As discussed in Section 3.1.2, disruptions in LNG flows through the Middle East could alter this trajectory, but assessing the likelihood of such an outcome is extremely difficult at this time.
Figure 13. World Natural Gas Demand History and Projections
Source: Historical data from IEA.¹⁷
3.1.4. Nuclear
Nuclear energy plays an important role in achieving global climate targets under most long-term outlooks. Projections have reflected this view for more than a decade. In 2012, IEA’s 450 scenario envisioned nuclear more than doubling between 2012 and 2035, with similar projections in 2015. Although IEA’s 2020 450 scenario involved slower nuclear growth, net zero scenarios from bp and IEA show growth rates not seen since the 1970s, when the commercial nuclear energy industry first emerged.
With the exception of IEA’s 2020 450 scenario, each of these scenarios envisions nuclear energy growing by more than 3 percent in CAAGR terms through 2050. Although dozens of nations have committed to tripling nuclear energy capacity by 2050, none of these scenarios reach that level, suggesting that this goal is unlikely to be achieved under current economic and technological conditions (Figure 14).
Figure 14. World Nuclear Demand History and Projections
Source: Historical data from IEA.¹⁷
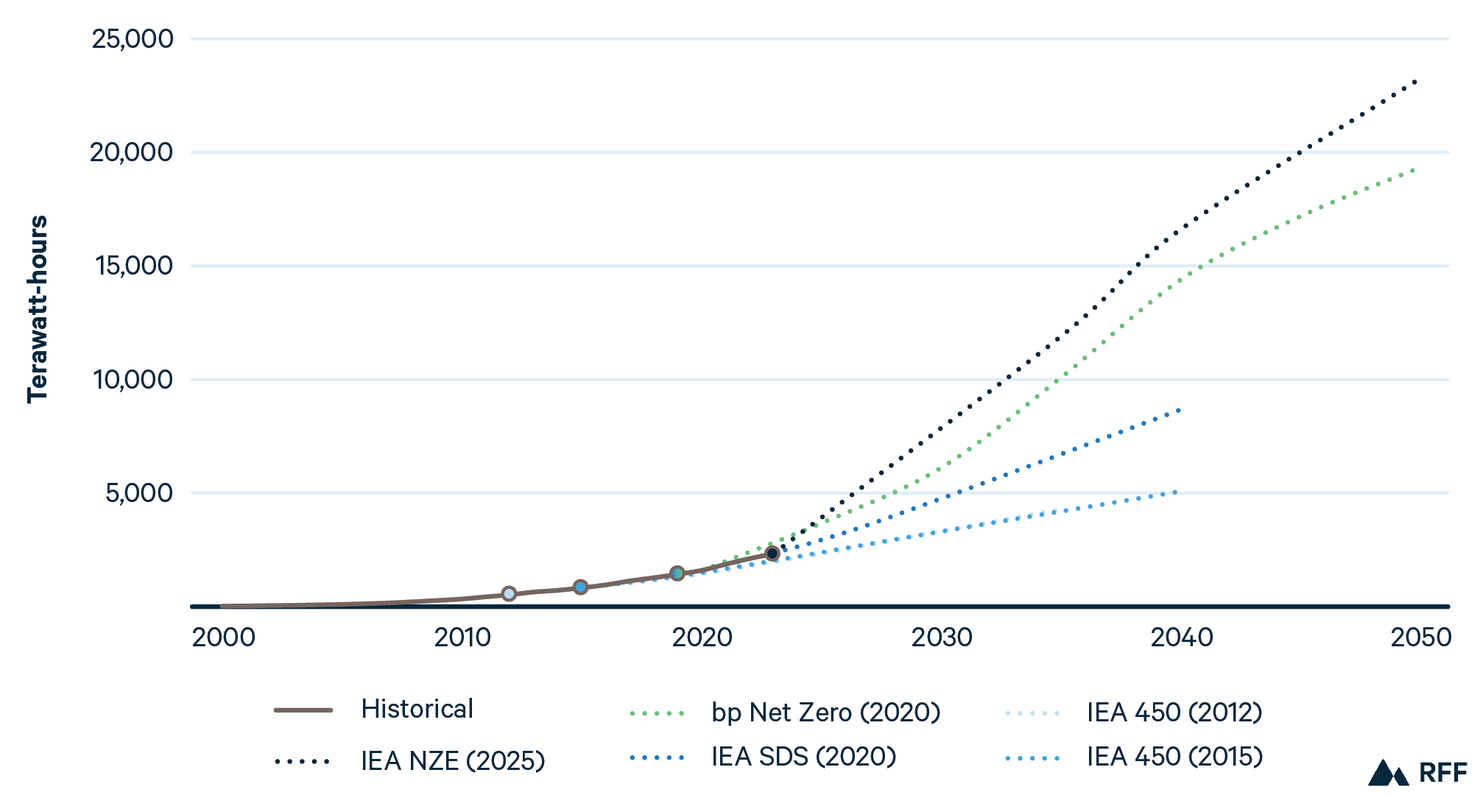
3.1.5. Solar
Amid the challenges described in the previous subsections, there is one very bright exception: solar. As many have written, the costs of deploying solar energy have fallen much more rapidly than envisioned by long-term energy outlooks, leading to growth rates that exceed even the most ambitious climate scenarios. World solar electricity generation has grown by four orders of magnitude over the last 20 years, rising by more than 35 percent annually and far outpacing even the most ambitious projections.
For example, IEA’s 450 scenario in 2012 envisioned solar growing by 14 percent annually, reaching 2,200 TWh by 2035. In 2024, solar generated 2,100 TWh globally. Under IEA’s 2025 Net Zero scenario, solar continues its exponential growth, rising by more than 12 percent annually through 2050. Whether it can continue to outpace expectations remains to be seen, but solar will clearly play a major role in the future of energy, regardless of climate policies (Figure 15).
Figure 15. World Solar Electricity Generation History and Projections
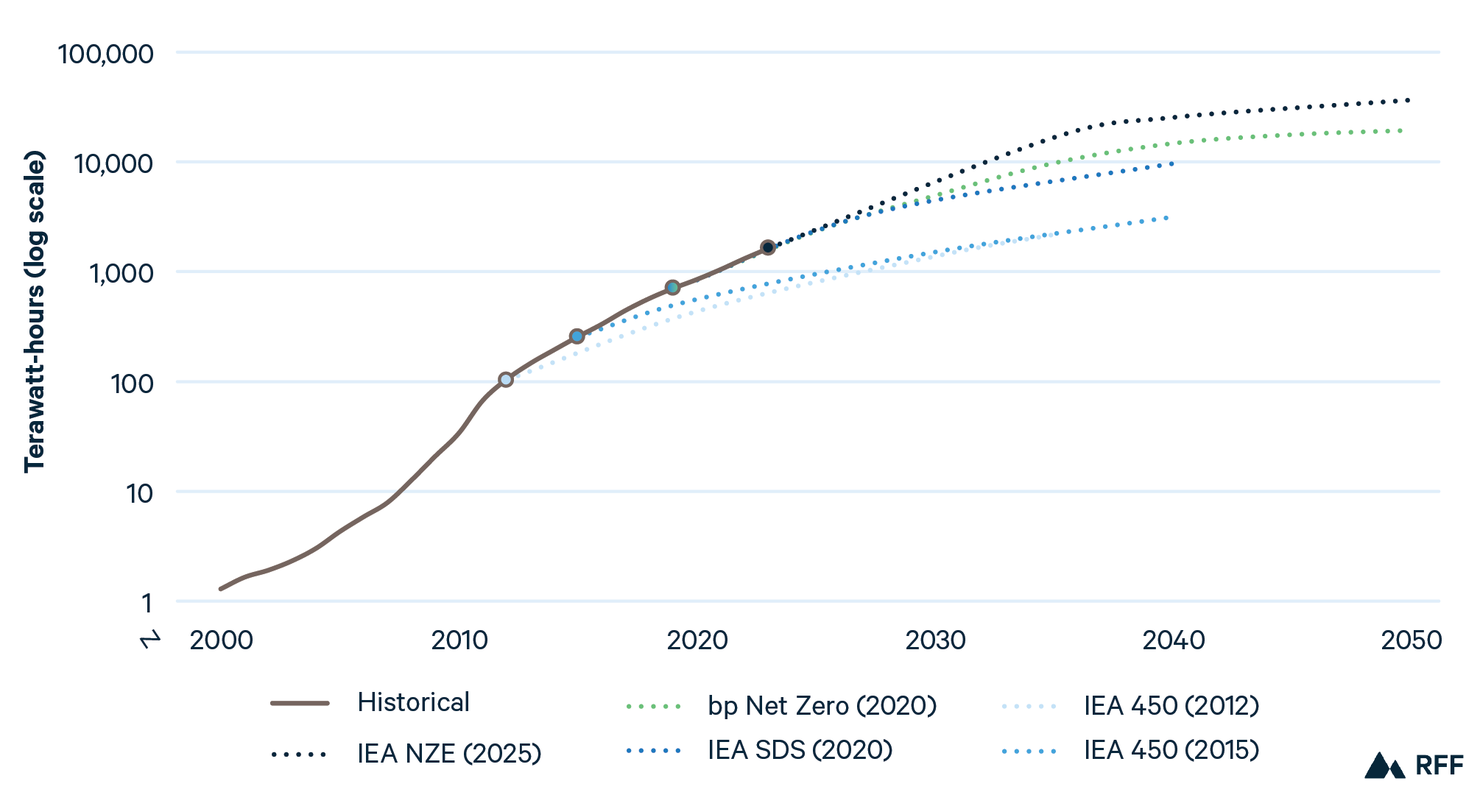
Source: Historical data from IEA.¹⁷
3.1.6. Wind
Like solar, wind energy also offers reasons for optimism regarding the future of energy and climate. In general terms, wind has grown at rates consistent with ambitious climate scenarios. IEA’s 2012 and 2015 450 scenarios envisioned wind reaching roughly 2,400 TWh by 2025. In 2024, global wind power reached 2,500 TWh.
Continued rapid growth in wind power will be needed to achieve international climate targets. Under net zero scenarios from bp (in 2020) and IEA (in 2025), wind electricity generation grows by 8.7 and 8.9 percent on average, respectively, through 2050. This rate of growth appears plausible given historical trends, but could become difficult if policies become less supportive, as seen in the United States in 2025 with, for example, the pausing of leases for offshore wind (Figure 16).21
Figure 16. World Wind Electricity Generation History and Projections
Source: Historical data from IEA.¹⁷
3.2. Assessing the Future of Global Coal Power
While there have been some downward blips, such as during the COVID-19 pandemic, global coal-fired power generation has continued to rise (Figure 17). And yet reference scenarios in 2025 project that coal will start a marked decline, with 2050 levels between 56 and 80 percent of 2025 levels. Are these realistic, in light of emerging trends in energy demand, faltering global commitments to the GHG emissions targets set by the Paris Agreement, and energy security concerns? Is there a climate optimism bias in global projections? Given that both China and India are building new coal-fired plants and adding capacity at higher rates than retirements,22,23 it seems possible that coal-fired generation will not peak this year and likely will not see the rate of decline projected. However, rates of coal-fired generation may not match rates of capacity expansion, as coal-fired units may be used for addressing peak energy demands,24,25 rather than baseload needs. The ultimate impact on total coal-fired generation and CO2 emissions will depend in large part on the evolution of energy demand and public policies that affect coal and its competitors over the coming decades.
Figure 17. Global Coal-Fired Electricity Generation
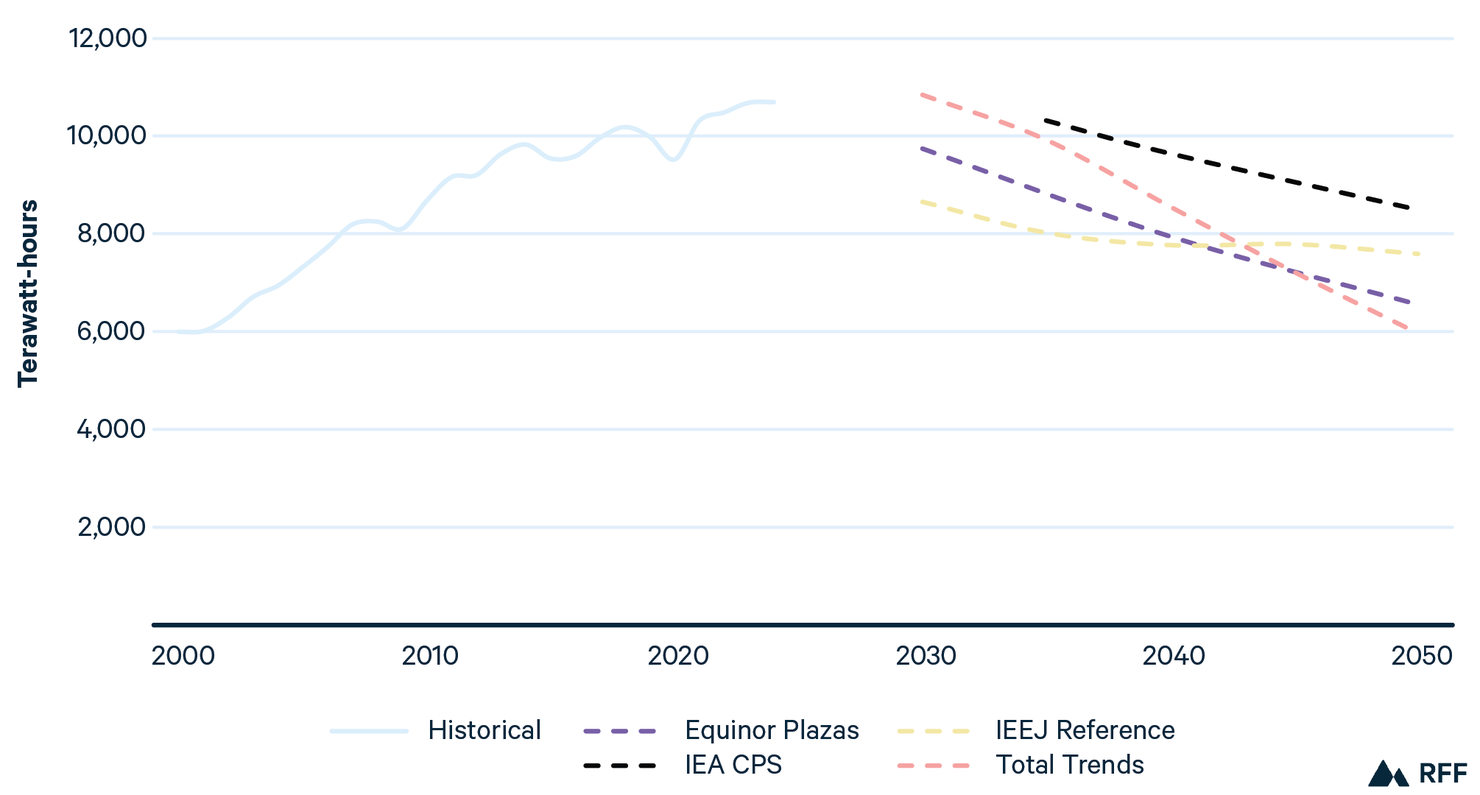
Source: Historical data from IEA.¹⁷
The United States represents one example of how efforts to reduce reliance on coal have gone off track. Before 2025, the legislative and executive branches of the US government were moving on a trajectory to substantially decarbonize the US energy system. The Inflation Reduction Act of 2021 expanded and extended tax credits for solar, wind, and nuclear generation, utility-scale battery storage, electric vehicles, low-emissions hydrogen, carbon capture, and more. Coupled with relatively higher prices for coal-fired generation, the aging of existing coal-fired units and regulations on new and existing coal-fired plants (for both GHGs and other air pollutants), projections from both EIA and IEA in early 2025 were that coal-fired generation would fall to almost zero by 2035. But these projections assumed that the United States would implement the Clean Air Act Section 111(b) and (d) standards for GHGs from new and existing power plants and that planned retirements would occur, motivated in part by the high costs of generation.
These developments are now far less certain. Figure 18 shows the difference between the EIA’s 2025 Reference scenario (dashed orange line) and an Alternative Electricity scenario removing GHG standards (dot-dash orange line), both from its domestic Annual Energy Outlook published in early 2025.26 The EIA’s Alternative Electricity scenario may still exaggerate the downward trend because it does not capture the additional impacts of the Trump administration’s other policy actions related to coal. These include requirements for federal purchases of coal-fired power,27 Department of Energy emergency orders requiring at least 16 coal-fired plants to continue operations,28 announcements of $800 million in funding to keep existing coal-fired plants in operation,29,30 and announcements by the Tennessee Valley Authority to cancel retirement of two coal-fired plants.31 In addition, Wyoming has announced a study for a new coal-fired plant,32 and industry representatives are in discussions with the Trump administration about the possibility of other new plants.
Figure 18. Projected US Coal-Fired Electricity Generation
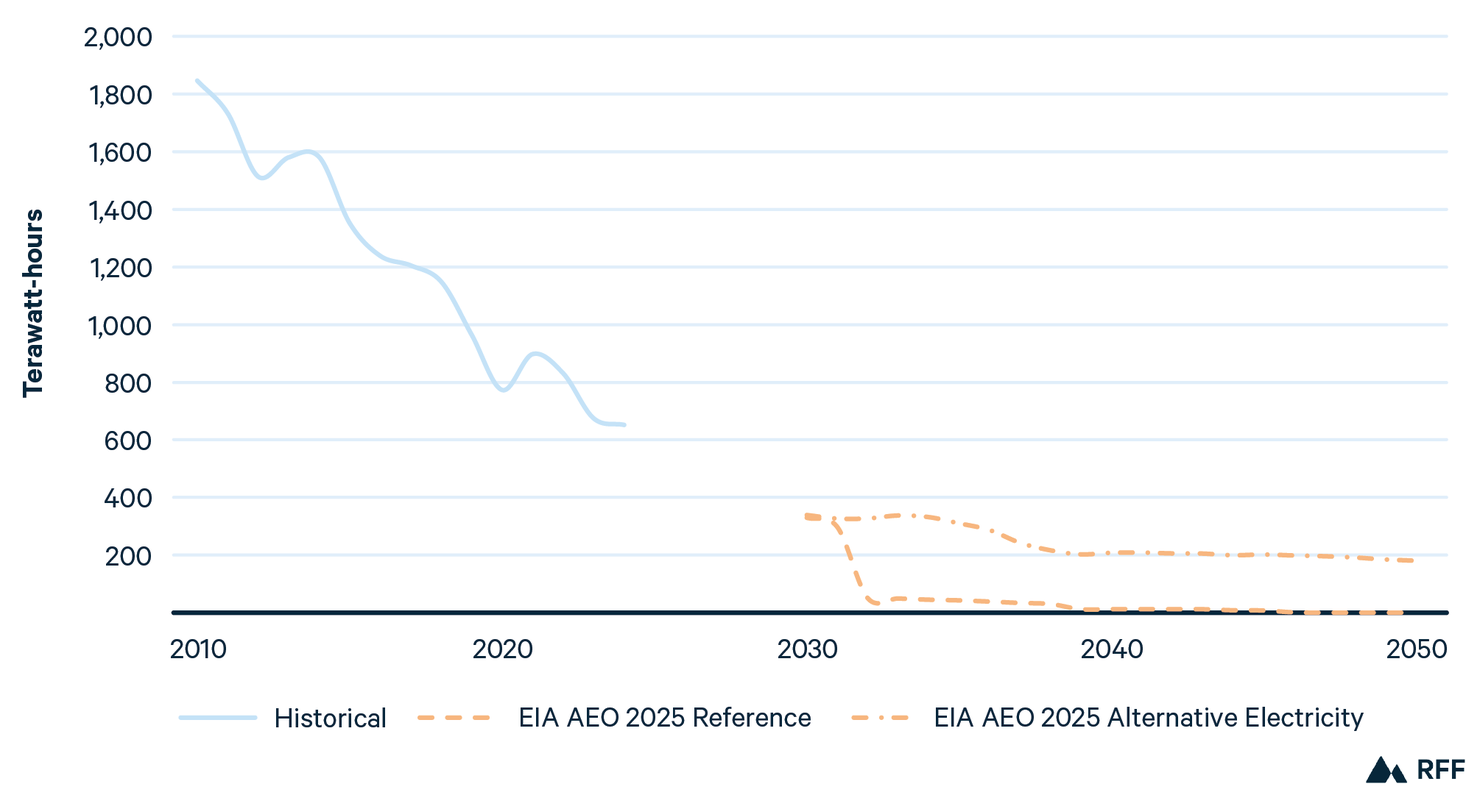
Source: Historical data from IEA.¹⁷ Projections from EIA.²⁶
Note: AEO = Annual Energy Outlook.
Although the US coal fleet is old, with existing generators averaging 47 years of age as of 2024,33 some retirements have been delayed. Emergency orders under Section 202(c) of the Federal Power Act are intended to be short-term, lasting up to 90 days, but the administration has renewed the orders multiple times for some plants,34 and retirement delays may continue through 2026.35 These orders come with steep costs. At least one plant in Michigan has reported a net loss of $125 million for 2025 due to the delayed retirement.36 The announced $175 million in funding for upgrades to plants in Kentucky, North Carolina, Ohio, Virginia, and West Virginia may increase the likelihood that these plants will continue operating even without emergency orders, although the higher costs of electricity generation for coal relative to other energy sources are still not addressed. If the administration continues to subsidize coal plants or extend emergency orders, this could result in extended operation of plants that are not economically viable, raising costs for ratepayers and continuing emissions of GHGs and traditional air pollutants.
The impact of this change in US coal policy on CO2 emissions is substantial. Figure 19 illustrates CO2 emissions under the EIA’s Reference scenario (dashed black line) and the Alternative Electricity scenario (solid black line) discussed in conjunction with Figure 18. By 2050, the cumulative additional CO2 emissions under the Alternative Electricity scenario (pink line) are 4,125 MMT higher than in the Reference case, equal to almost 90 percent of US emissions in 2024 and exceeding 2024 CO2 emissions from the Europe Union.37 Using the social cost of carbon (SCC) estimates from the US Environmental Protection Agency (EPA) in 2023,38 the damages from these additional CO2 emissions (discounted back to 2024 at a 2 percent discount rate) would be more than $800 billion (2020 US$).
Figure 19. Projected CO₂ Emissions from Coal-Fired Power Plants Under Two Scenarios
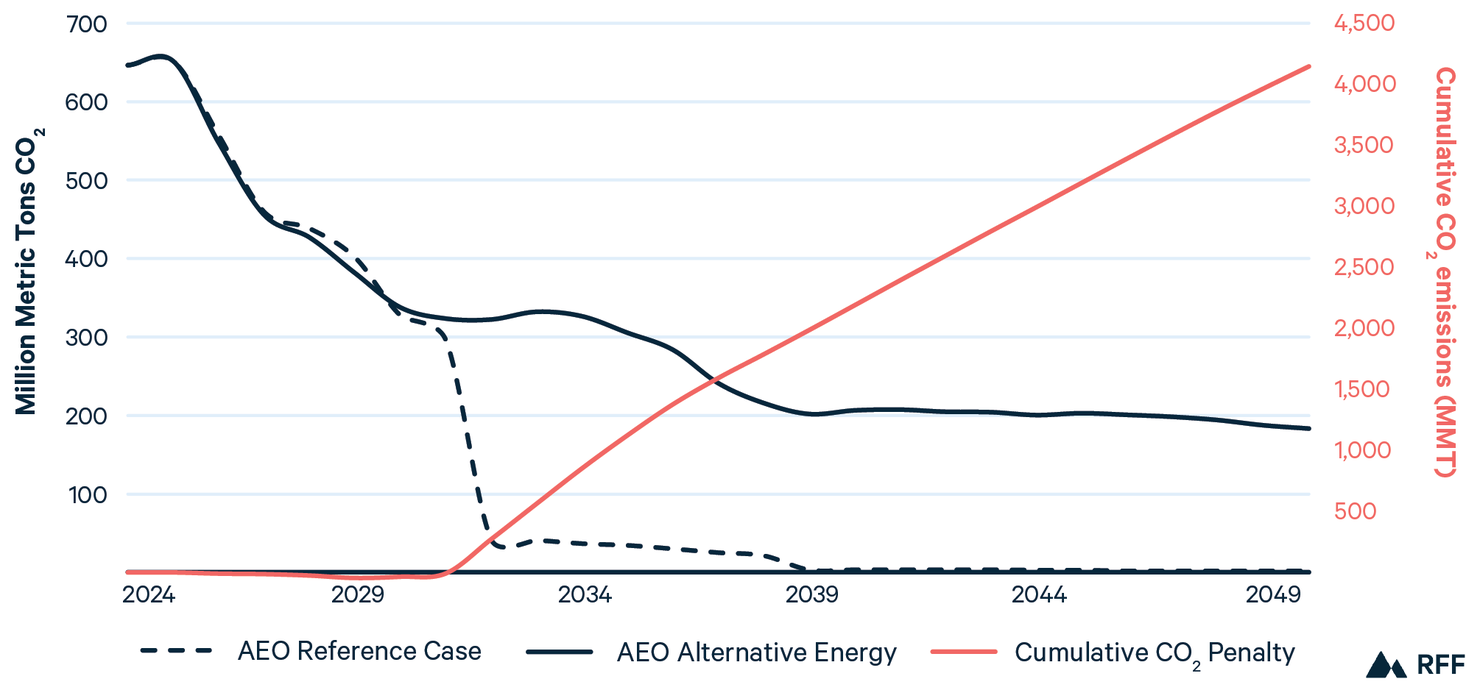
Source: EIA, Annual Energy Outlook 2025, Table 18.²⁶
Note: AEO = Annual Energy Outlook.
An estimated 2.1 GW of coal-fired capacity is being covered by the administration’s current emergency orders. Assuming a 60 percent capacity factor, this would result in an additional 11 TWh of generation, which would emit an additional 11.5 MMT of CO2 annually (assuming the EIA emissions rate of 1.05 MMT/TWh),39 roughly equal to the annual emissions of 2.7 million passenger vehicles.40 If these additional emissions were to persist through the end of the Trump administration, again using EPA’s SCC, the present value of those damages (2025 through 2028) would be $9.5 billion. The additional delayed retirements and the requirements for the US Department of Defense to purchase electricity from coal-fired plants will only make the CO2 penalty more pronounced.
Not included here are the economic costs from the increases in mortality and morbidity from potential increases in emissions of sulfur dioxide and nitrogen oxides, which contribute to ambient concentrations of fine particulate matter, or PM2.5. Nitrogen oxides also contribute to ambient ozone, which causes respiratory-related mortality and morbidity. These impacts can be substantial, with recent EPA estimates of $55,200 per ton of SO2 and $7,470 per ton of NOx emitted from power plants (2019 US$, 3 percent discount rate).41
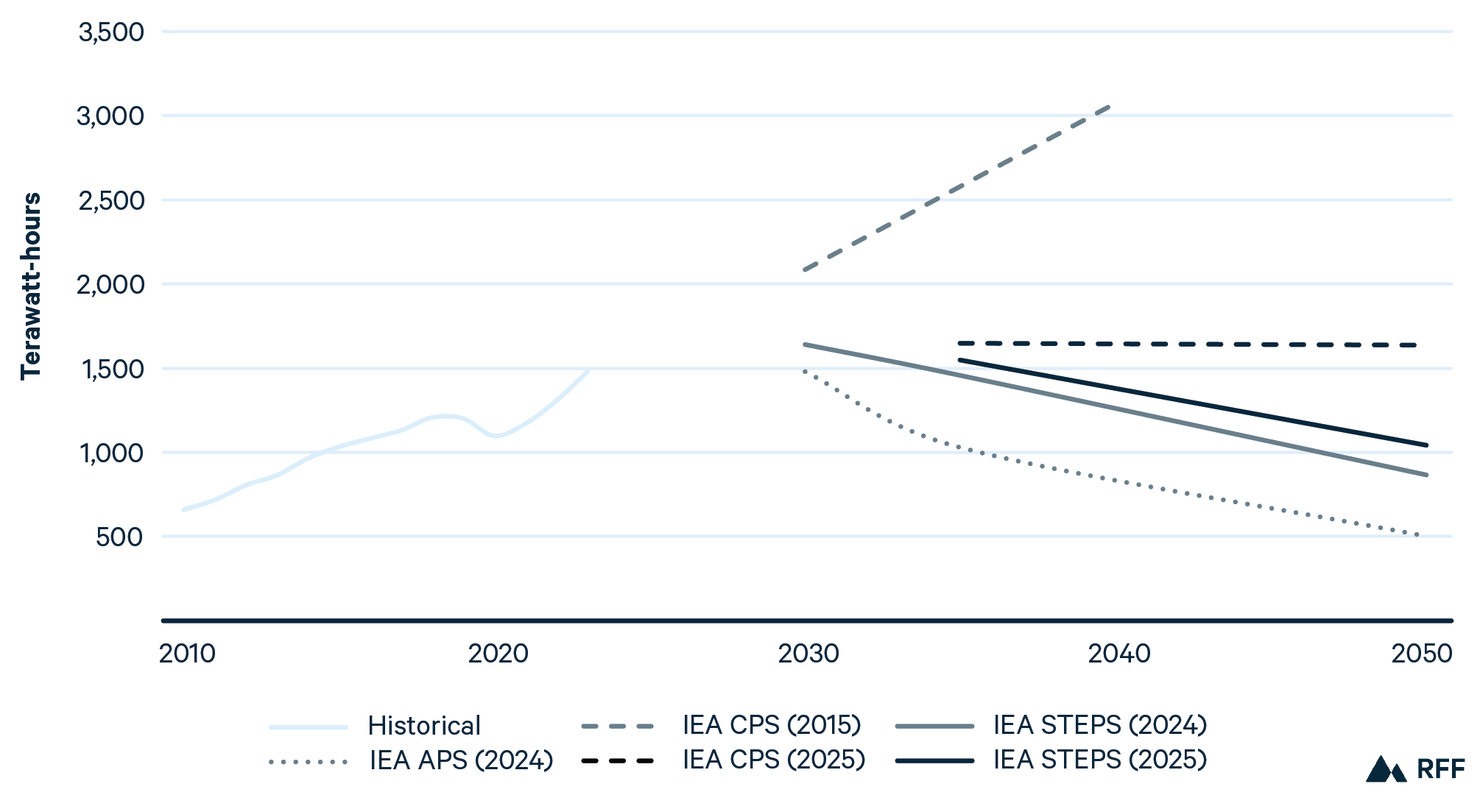
Projections of coal-fired generation in the United States have changed considerably over the last decade. In 2015, IEA projected in its CPS that generation would remain near 2010 levels, with modest declines through 2040. In 2024, IEA projected coal generation to fall by more than 95 percent by 2050 under STEPS and the Announced Policies Scenario (APS), which assumed the implementation of the Biden administration’s nationally determined contribution submitted to the UNFCCC.
But in 2025, expectations for coal-fired generation rebounded (Figure 20). In IEA’s CPS, generation declines 38 percent from current levels but remains significant through 2050. Thus, over the course of 10 years, the variation in the projected generation just out to 2035 ranges from 1,740 to 29 TWh, reflecting major changes in technology, fuel prices, and federal policies. Looking forward, the picture remains cloudy because of uncertainty about electricity demand, natural gas prices, and policies under current and future US administrations.
Figure 20. Projected US Coal-Fired Electricity Generation in 2015, 2024, and 2025
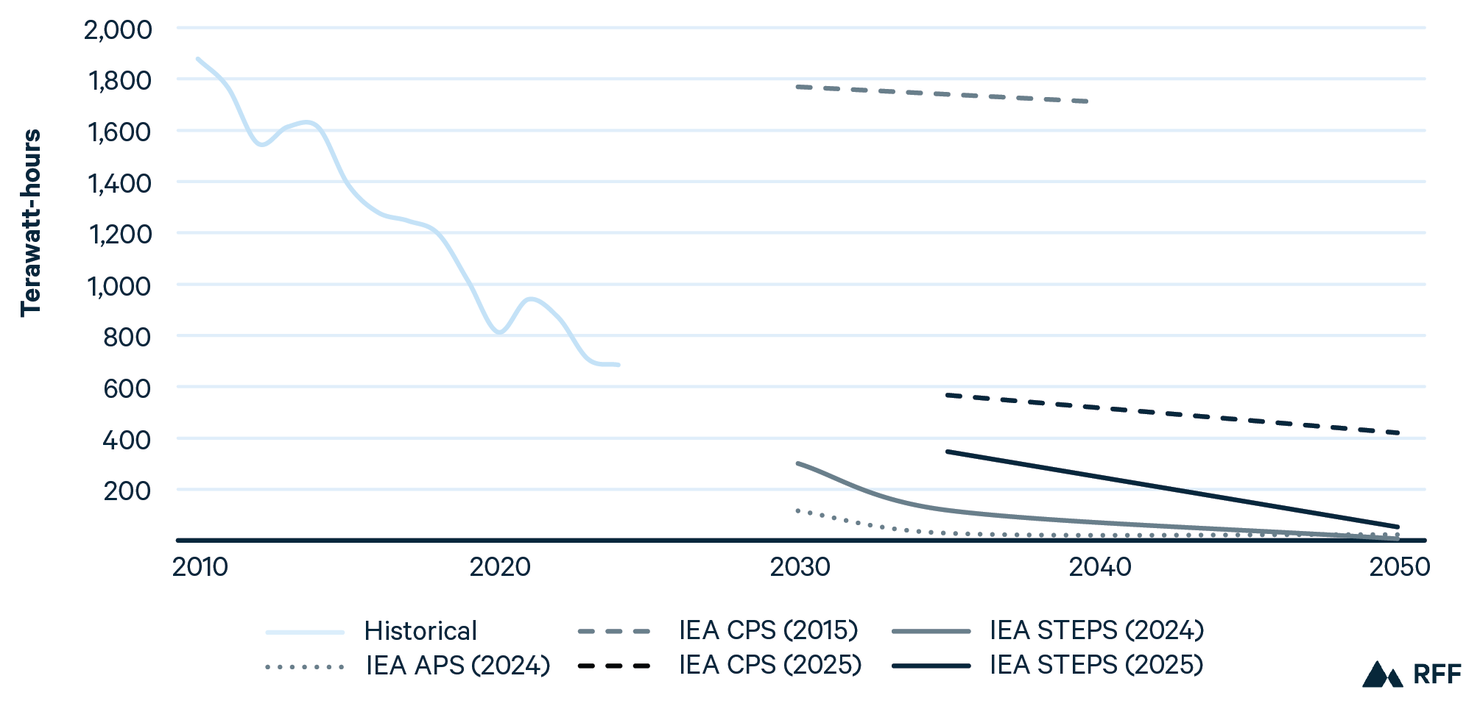
Sources: IEA, World Energy Outlook 2015, 2024, and 2025; historical data from IEA.
The outlook for coal power has also changed substantially in China and India, both heavy coal-generation countries (Figure 21, Figure 22). In 2015, IEA’s CPS projected that China and India would both see continuing sharp increases in coal generation. In 2024, for China, IEA’s STEPS and APS showed reductions of 70 and 87 percent, respectively, by 2050. Likewise, for India, in 2024, STEPS and APS showed reductions of 41 and 66 percent, respectively. But this year, projections have been revised upward, with a slower decline under STEPS and a much more muted reduction under the CPS for China, where coal generation falls by just 27 percent by 2050. For India, under the 2024 CPS, generation is increased from current levels and remains flat through 2050. The gap between the CPS and STEPS highlights an important conclusion: What countries say they will do and what they actually implement can be very different, especially when government priorities shift.
Figure 21. Projected Chinese Coal-Fired Electricity Generation in 2015, 2024, and 2025
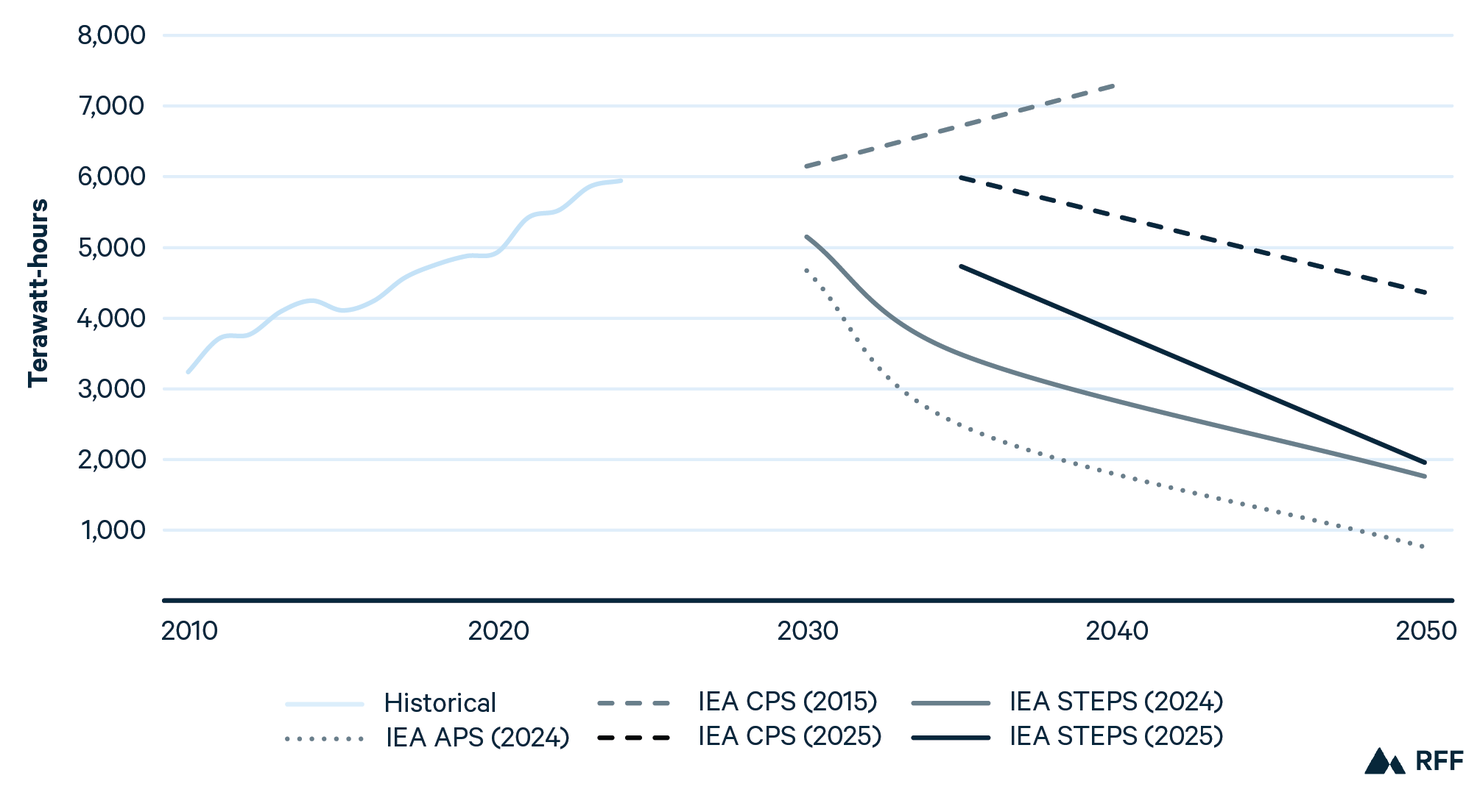
Sources: IEA, World Energy Outlook 2015, 2024, and 2025; historical data from IEA.
Figure 22. Projected India Coal-Fired Electricity Generation in 2015, 2024, and 2025
Sources: IEA, World Energy Outlook 2015, 2024, and 2025; historical data from IEA.
3.3. Evolving Regional Projections of Electricity Generation
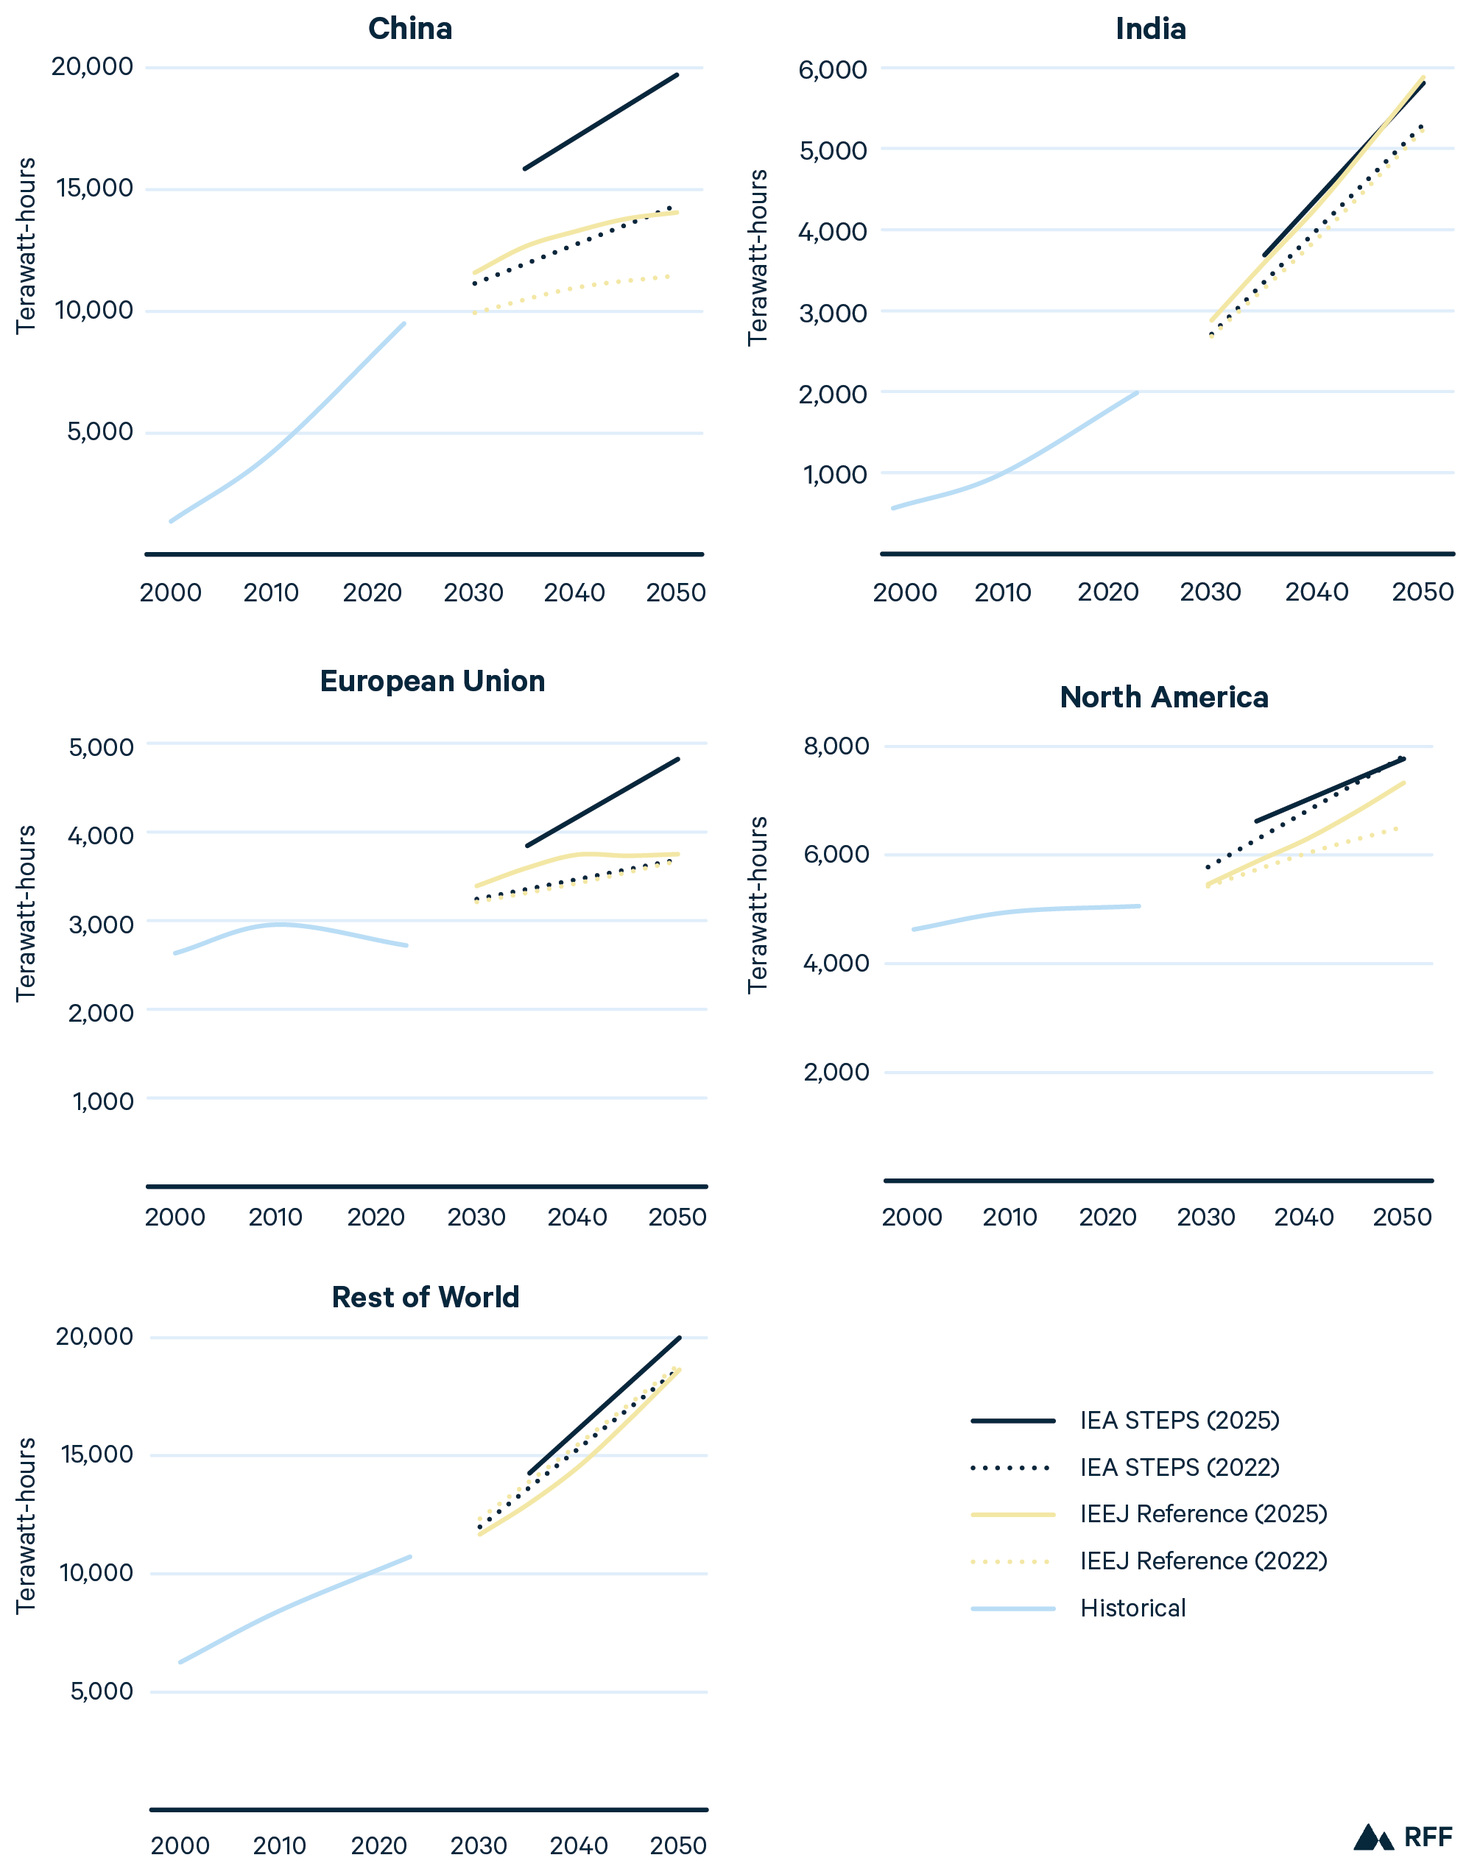
In the past three years, electricity generation projections have evolved in response to shifts in electrification of end-use sectors, industrial development, and growth in new industries such as AI. While global generation projections increased (Figure 8), the distribution of those increases varies across regions. Figure 23 compares power generation projections from IEA and IEEJ in 2022 and 2025 for China, India, the European Union, North America, and the Rest of the World.
Since the 2022 outlooks were published, policies and economics have diverged across regions. In the United States, federal policy to support deployment of renewables and the electrification of transportation and buildings has been significantly reduced. Volatile trade policy may also lead to shifting trade flows and associated industrial activity over time. Policies in China and the European Union continue to advance electrification, and China has experienced significant electric vehicle price reductions in the past two years, accelerating adoption.42 Across regions, the computational needs associated with AI remain a significant source of uncertainty for electricity demand growth.
IEA STEPS captures the acceleration of generation growth across regions, revising its 2050 projections upward by over 5,000 TWH for China (37.3 percent increase), 1,000 TWH for the European Union (30.5 percent increase), and 1,000 TWH for the Rest of the World (7 percent increase), relative to its 2022 projections. The IEEJ’s Reference scenario also increased its 2050 projections for China by about 2,500 TWH (22.5 percent increase), though it foresees only a minor increase for the European Union. The IEEJ makes upward adjustments to generation for North America and India, with 2050 levels roughly 12 percent higher in 2025 relative to its 2022 projections.
The only two downward revisions are for North America under IEA STEPS (0.7 percent) and the Rest of the World under IEEJ Reference (1.2 percent), though these decreases are the smallest magnitudes of any changes. Compared with 2022 projections, IEA’s 2025 STEPS projections for North American show less electricity going to transportation (15.6 percent decrease), industry (5 percent decrease), and other uses (1 percent decrease), while consumption in buildings is 10.9 percent higher. These differences from IEA STEPS correspond to a net increase in anticipated electricity demand (1 percent) from end users in North America, in contrast to the anticipated reduction in North American electricity generation in the same scenario. We were unable to trace the driver of this gap in the model documentation. These changes align with data center demand rising while transport and industrial electrification slows down in the United States, the largest subregion of North America.
Figure 23. Regional Electricity Generation in 2022 and 2025 Outlooks
When electricity generation rises to meet anticipated demand, changes in the power mix will follow. Figure 24 shows, for each region, the differences between projections made in 2022 and 2025 for the year 2050. Overall, growth in renewables outpace growth in overall generation needs across regions, meaning the grid is becoming less carbon-intensive even as electricity needs increase. Solar leads in additional projected generation across regions and scenarios. Solar in China is the single greatest regional change between 2022 and 2025, adding over 6,000 TWh in IEA STEPS (157 percent increase) and close to 4,000 TWh in IEEJ Reference (403 percent increase).
Figure 24. Change in 2050 Generation by Energy Type in 2022 to 2025 Outlooks
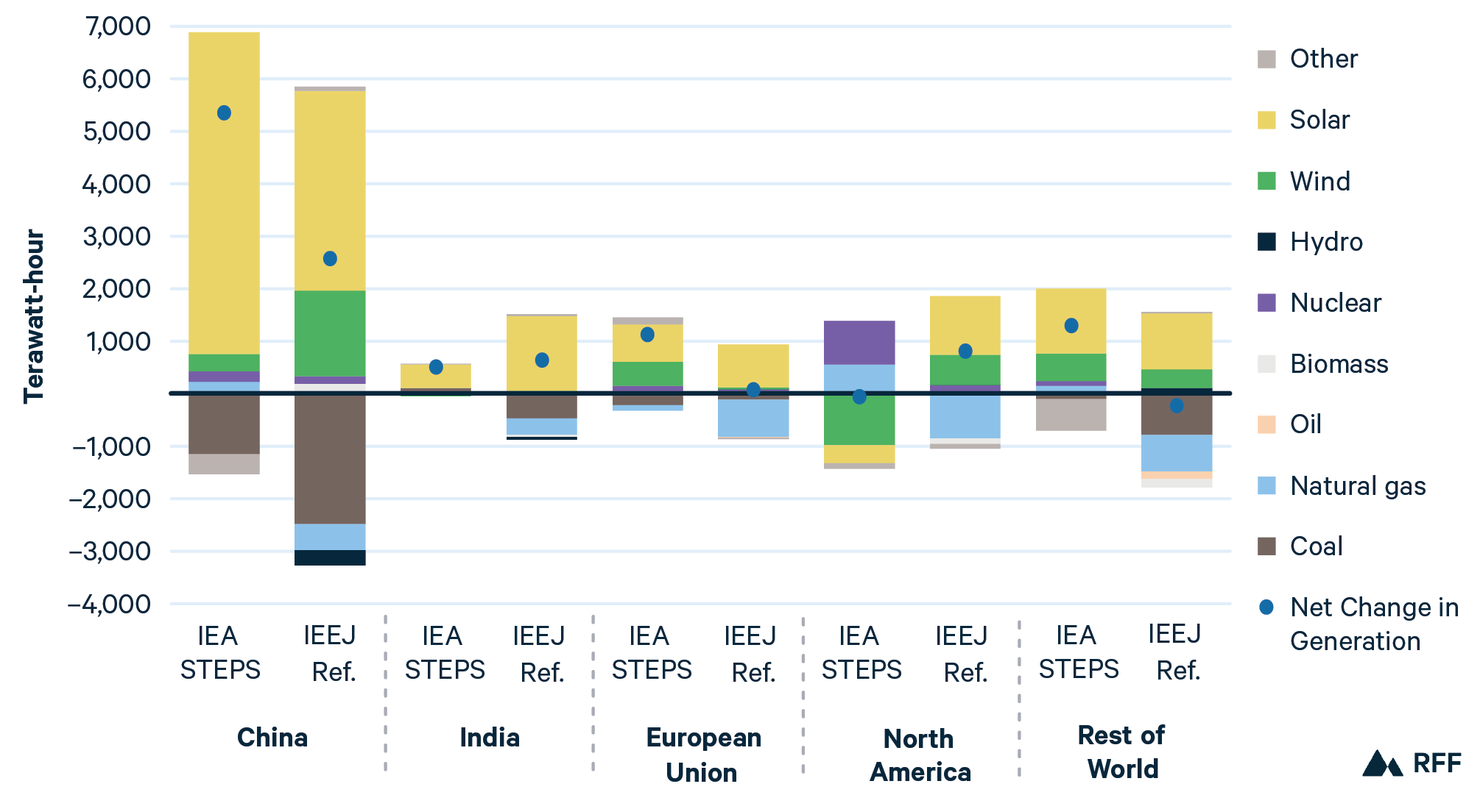
Note: For IEA, the “Other” category includes oil, biomass, and hydro generation.
The growth of projected solar generation has been accompanied, and is perhaps influenced, by increases in projected battery deployment. Under IEA STEPS, global battery capacity sees a 161 percent increase in its 2050 projection compared with 2022, jumping from 1,295 to 3,380 TW. The large revision is in response to recent announcements of large battery storage projects across regions. Although IEA does not publicly provide regional battery data, most projects currently in development are in China and North America, suggesting that these regions may claim the greatest share of 2050 capacity.43
The only exception to the near universal growth of solar is IEA STEPS in North America, where solar falls by 13.6 percent relative to the 2022 projection. The reductions in both solar and wind generation, which decreases by 44.7 percent, are almost entirely offset by increases in natural gas and nuclear generation. In contrast, IEEJ Reference increases its wind and solar projections for North America, with nearly all additional generation in the region attributable to renewables (the IEEJ’s 2025 Reference scenario does not appear to incorporate the effects of recent policy changes in the US that reduce support for renewables and boost coal). Relatedly, 2025 projections for coal-fired generation in 2050 are lower than was estimated in 2022 in all regions except North America.
For the Rest of the World grouping, the small decrease in generation observed in IEEJ Reference consists of lower estimates for coal, oil, natural gas, and biomass generation. The greatest decrease for the region under IEA STEPS is in other generation, which includes oil and biomass.
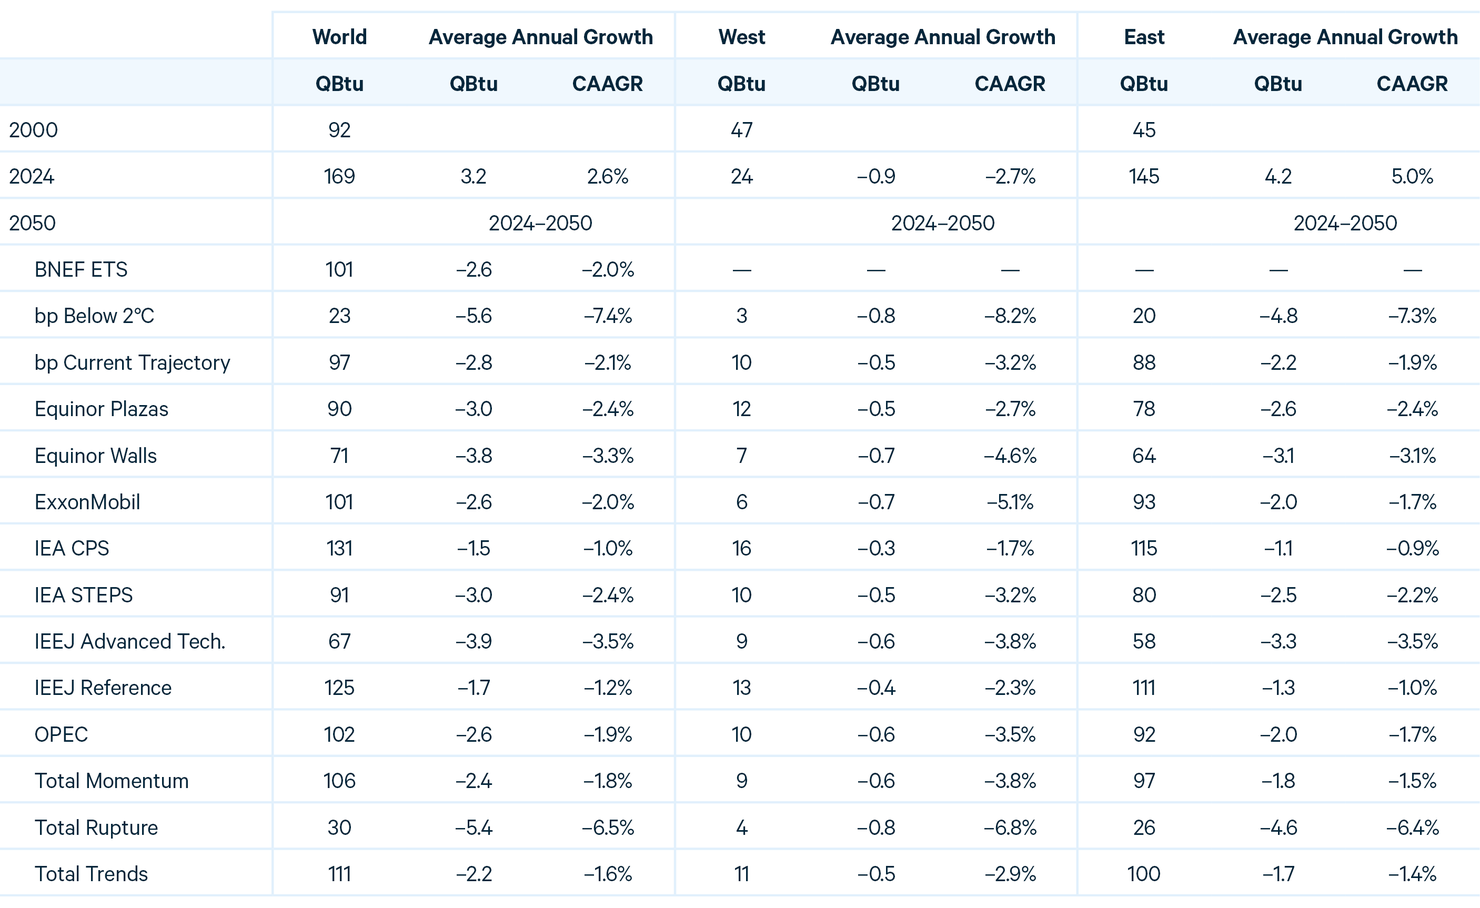
3.4. Where Is Global Transport Energy Headed?
The transportation sector is a central component of the global energy system, accounting for roughly 30 percent of global final energy demand and contributing about 10 percent of energy demand growth since 2019.44 The sector includes passenger vehicles, freight trucks, aviation, rail, and marine shipping.
Energy consumption in transport reflects offsetting forces across modes. Improvements in fuel economy and the adoption of alternative technologies reduce energy intensity, though uptake varies across regions and remains sensitive to policy support. Technology options also differ across modes: cars have seen rapid electrification, while long-haul freight, aviation, and marine transport face tighter energy density and range constraints, making reliance on liquid fuels (or in the future, possibly hydrogen) more likely. At the same time, population growth and rising economic activity in many parts of the world increase vehicle ownership, aviation demand, and freight volumes. Future transport energy use will depend on how quickly new technologies scale and how fast vehicle fleets turn over.
Figure 25 plots projected global transport energy demand across outlooks. Historical consumption rose steadily from about 78 QBtu in 2000 to roughly 118 QBtu by 2024. Projected 2030 levels fall within a relatively narrow range, from roughly 115 to 133 QBtu. By 2050, however, projections span a much wider interval, from 83 to 155 QBtu.
Figure 25. World Transportation End-Use Energy Consumption
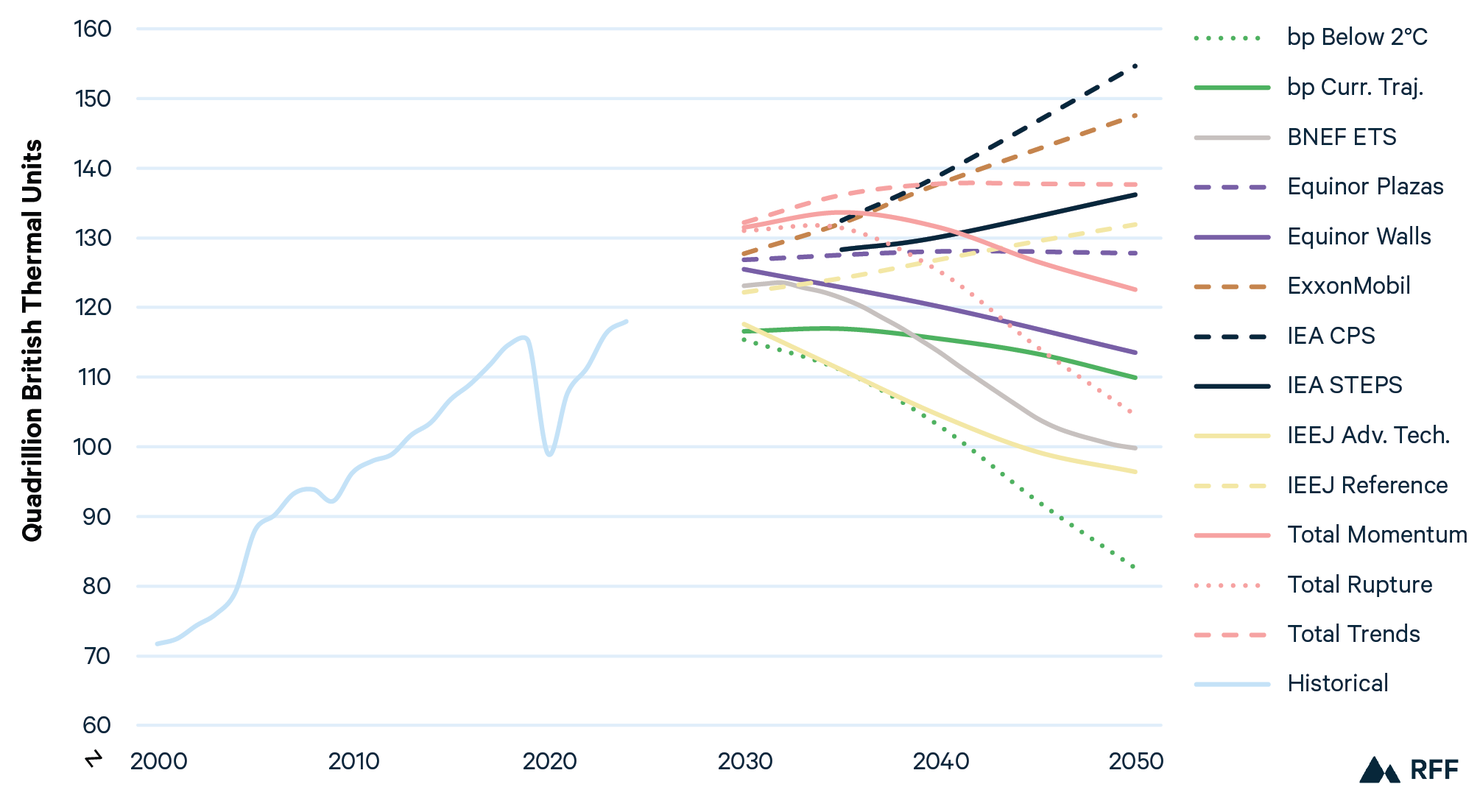
Source: Historical data from BNEF.
Within reference scenarios, projections vary materially. IEA CPS and ExxonMobil project continued growth through mid-century, while reference scenarios from Equinor, IEEJ, and Total show a plateau or modest decline. Among evolving policies scenarios, IEA STEPS projects gradual increases, whereas other outlooks show flat or slightly declining energy consumption. IEEJ Advanced Technologies stands out, projecting substantial reductions by 2050. Among the ambitious climate pathways, bp’s Below 2°C scenario implies the largest reduction in transport energy use.
The widening spread reflects different visions about how rising mobility demand interacts with efficiency improvements and electrification. In outlooks that project continued growth, rising incomes translate into higher vehicle ownership, freight activity, and aviation demand, while efficiency gains and electrification in road transport do not scale quickly enough to offset that growth. These trajectories reflect in part differing expectations about the strength and durability of policy support for low-carbon technologies across major economies.
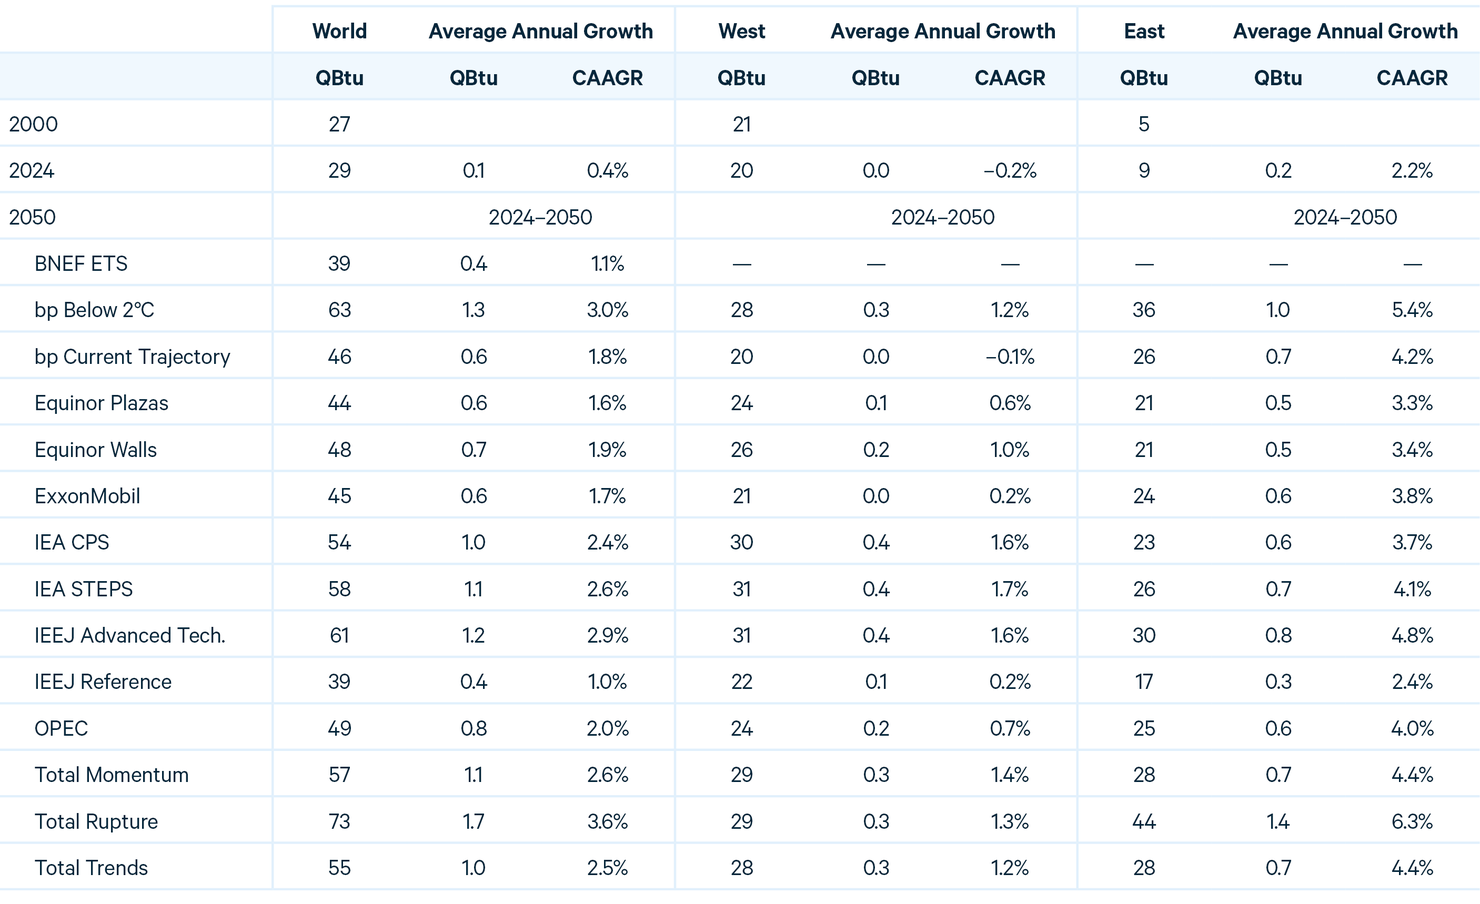
Scenarios differ in their vision for the fuels that will supply the transport sector in the coming decades. Figure 26 shows historical global transport end-use energy by fuel in 2010 and 2024, alongside projected 2050 levels. Since 2010, oil use in the transport sector has grown from 90 to 106 QBtu in 2024. By 2050, oil use in transport increases substantially only in IEA CPS, where it rises to 120 QBtu. Under other scenarios, oil consumption declines or remains roughly flat. Looking forward, oil remains the dominant transportation fuel under evolving policies and reference scenarios, but its share of the mix declines, falling from 90 percent in 2024 to a high of 78 percent (IEA CPS) and a low of 69 percent (BNEF ETS) in 2050.
Figure 26. World Transportation End-Use Energy by Fuel
Source: Historical data from IEA.
Note: Decomposition by fuel type was not available for Total, bp, and IEEJ. “Other” includes biofuels and other sources for BNEF and hydrogen, electricity, and other sources for ExxonMobil. Scenarios ordered from lowest to highest level of oil demand in 2050.
The continued dominance of oil across scenarios by 2050 reflects two main factors: (a) few economically viable substitutes exist for key modes such as long-distance trucking, shipping, and aviation, and (b) vehicle fleets turn over slowly. But electricity makes inroads under all scenarios that report relevant data, rising from just 2 percent of the mix in 2024 to between 8 percent (IEA CPS) and 20 percent (BNEF ETS) by 2050. Biofuels also grow under most scenarios that report data, rising from 5 QBtu in 2024 to a high of 17 QBtu (ExxonMobil) by mid-century.
Looking regionally, transport energy use in the East increases through mid-century under all but two scenarios, though the magnitude varies (Figure 27). This pattern is consistent with rising incomes and economic activity, which are associated with higher vehicle ownership, increased aviation demand, and expanding freight volumes. The two outlooks that project declines in the East are Total Rupture, which shows transport energy use falling after 2035, and IEEJ Advanced Technologies (not shown in Figure 27 due to data limitations that prevent full harmonization), which shows declines after 2030.
Figure 27. Transportation End-Use Energy by Region
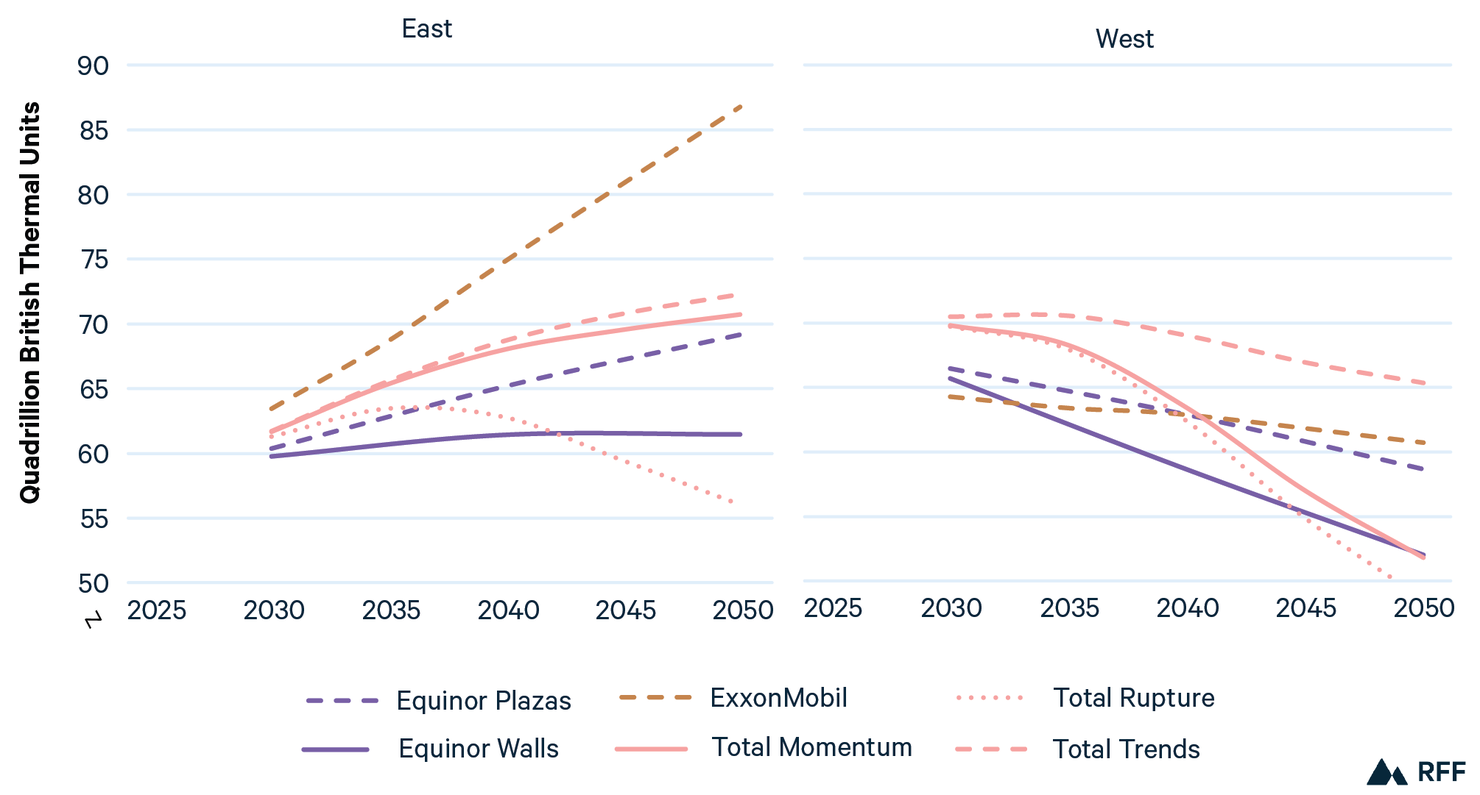
Note: Decomposition by region was not available for BNEF, bp, and OPEC. IEA and IEEJ separate fuels consumed in international bunkers and therefore are not directly comparable.
In contrast, all outlooks other than IEA CPS project stabilization or decline in transport energy use in the West. This does not necessarily imply reduced transport activity; improvements in fuel efficiency offset growth in travel, limiting overall energy demand. Taken together, these figures show that even when global totals differ across outlooks, projections often place a larger share of mid-century growth in regions where mobility demand is still rising.
Figure 28 examines how projected 2050 global transport energy demand has evolved over the last several years for scenarios reported consistently during 2022–2025. In 2025, most outlooks revised their projections upward, although IEEJ’s Reference scenario projection fell. Within reference scenarios, ExxonMobil’s projections have increased steadily since 2022, while IEEJ’s Reference scenario continues to revise 2050 demand downward. Within evolving policies scenarios, IEA STEPS declined between 2022 and 2023 but has since increased, and Equinor Walls shows an upward trend since 2022.
Figure 28. Evolution of Projections for 2050 Global Transport End-Use Energy Demand
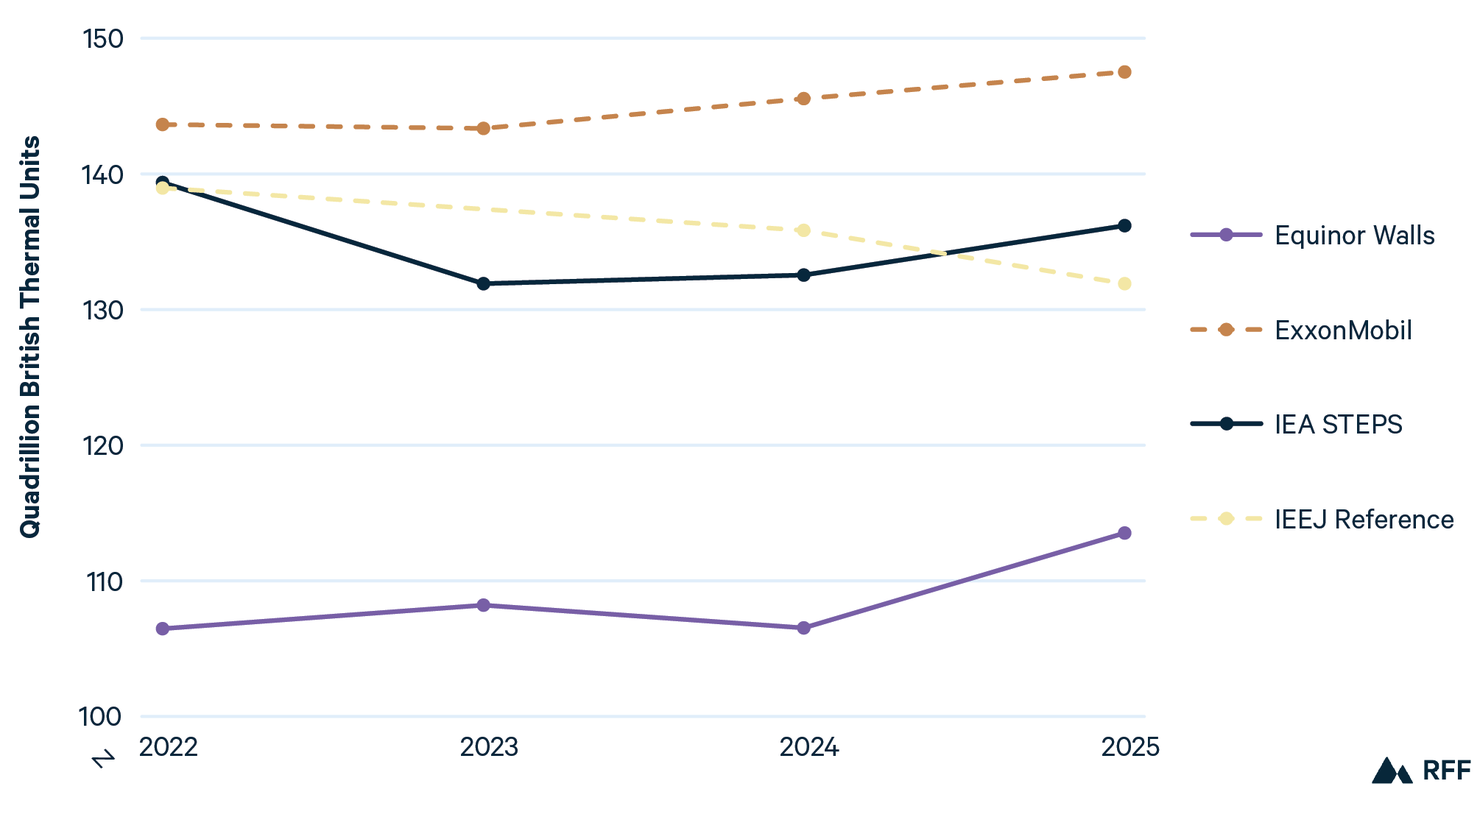
That revisions move in different directions across scenarios underscores continued uncertainty about long-run transport demand, which may reflect in part shifts in policy priorities and market conditions. In the United States, Congress ended federal tax incentives for electric vehicles in 2025 and overturned federal approvals underpinning long-standing state-level zero-emissions vehicle mandates, including California’s.45,46 By mid-2025 while outlooks were still being produced, the EPA had signaled its intent to reconsider the 2009 endangerment finding and the vehicle GHG standards that rely on it, adding uncertainty about the future US policy environment.47 Several of these actions are facing, or are expected to face, litigation.
Conversely, China and many European nations have continued to expand electric vehicle production and adoption at scale, supported by sustained industrial policy and strong domestic demand. Diverging policy and market conditions across major economies introduce uncertainty about how quickly new technologies will diffuse globally.
3.5. Global Carbon Intensity Has Declined Dramatically
Although global carbon dioxide emissions have reached record highs in recent years, the carbon intensity of the global economy has declined remarkably over the last several decades. This declining carbon intensity has not been caused primarily by climate policy. In fact, global CO2 emissions per unit of GDP fell fastest in the 1970s and 1980s, well before climate change was a top priority for policymakers. As Figure 29 shows, global carbon intensity was 44 percent lower in the 1970s than in the 1960s, and it was another 56 percent lower during the next decade. Global carbon intensity during the 2020s has to date been roughly 18 percent lower than in the 2010s.
Figure 29. Historical CO₂ Emissions per $1,000 of GDP
Sources: GDP data from Eurostat, OECD, IMF, and World Bank, with minor processing by Our World in Data. Emissions data from the Global Carbon Budget, with major processing by Our World in Data.
Note: Countries included are Argentina, Australia, Brazil, Canada, China, Egypt, France, Germany, India, Iran, Israel, Italy, Japan, Nigeria, Saudi Arabia, South Africa, South Korea, United Kingdom, and United States.
Since the United Nations Framework Convention on Climate Change (UNFCCC) was established in 1992, governments have implemented thousands of policies designed to reduce GHG emissions. And although these policies will not be sufficient to limit global warming to 1.5°C, they have helped reduce the emissions in a number of jurisdictions, most notably Europe.48 Among the 10 nations with the lowest emissions intensity of GDP in the 2020s, seven are European (from lowest to highest: Liechtenstein, Switzerland, Sweden, Ireland, Denmark, Norway, and Malta).
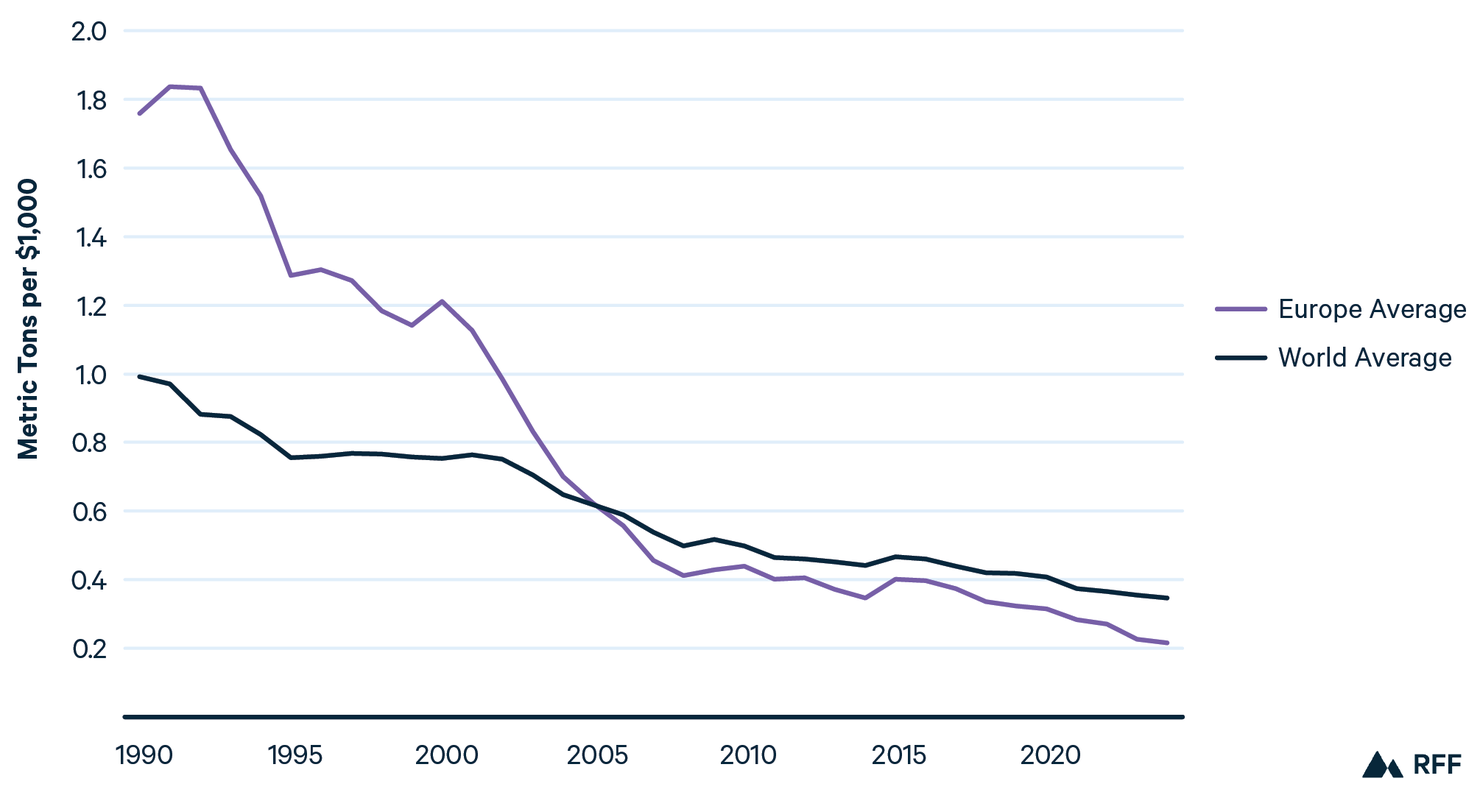
Indeed, European carbon intensity has fallen much more rapidly than the global average since the establishment of the UNFCCC. In 1990, European emissions intensity was 77 percent higher than the world average. During the 1990s, several European nations implemented carbon taxes, while other nations encouraged fuel shifting away from coal in the power sector (in part to reduce “conventional” air pollutants).49,50 Climate policies ramped up substantially in the 2000s, with the initiation of the EU’s Emissions Trading System in 2005, along with a variety of other policies aimed at incentivizing renewables deployment.51 By 2024, European emissions intensity was 28 percent below the world average (Figure 30).
Figure 30. European and Global Emissions Intensity
Sources: see previous figure.
Note: European average is a simple average of data from 42 European nations.
Among the world’s largest economies, carbon intensity has declined most notably in China. In the 1960s, China emitted 8.6 metric tons of CO2 per $1,000 of GDP (mt/k$). By the 2020s, this number had fallen by more than an order of magnitude, falling below 0.7 mt/k$. In the United States, a similar story emerged, with carbon intensity falling from 4.6 to 0.2 mt/k$ from the 1960s to the 2020s.
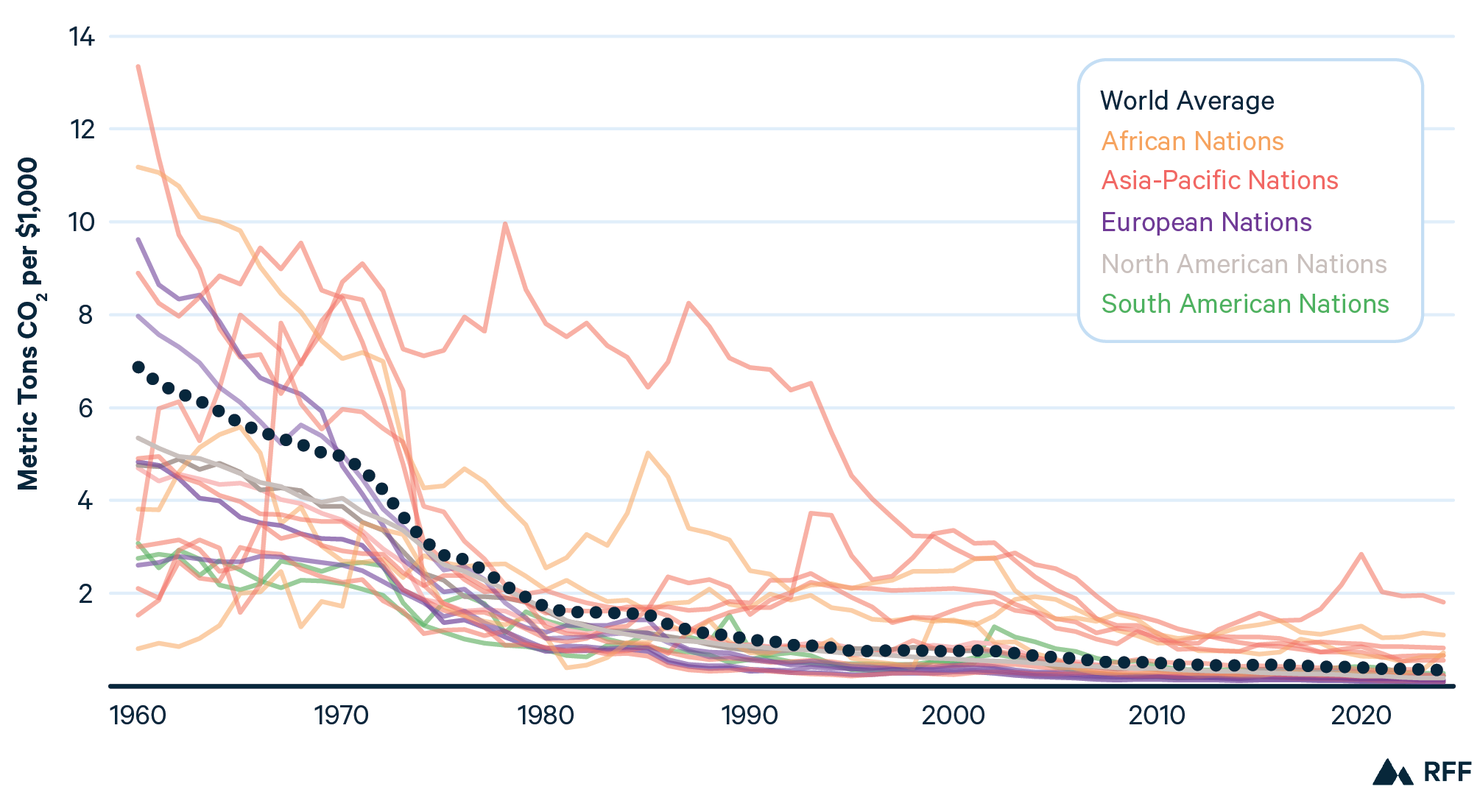
Figure 31 illustrates how dramatically carbon intensity has fallen globally over the last 50 years. The figure includes all nations for which sufficient data were available to calculate average CO2 emissions and GDP in the 1970s and the 2020s (2020 through 2024). On average, CO2 intensity fell by almost 90 percent during this period, as GDP grew much more rapidly than total CO2 emissions.
Figure 31. CO₂ Emissions, GDP per Capita, and CO₂ Intensity for over 100 Nations
Sources: See Figure 29.
Note: 1970s data includes 115 nations and territories. 2020s data include 183 nations and territories. Two nations (Qatar and the United Arab Emirates) are excluded from the 1970s figure because their values exceeded 20 metric tons per $1,000 GDP, which makes the figure difficult to interpret. CO₂ intensity is measured as tons of CO₂ per $1,000 of GDP.
Looking forward, CO2 intensity continues to decline as energy efficiency and low-emissions energy technologies expand globally. By 2050, emissions intensity declines by at least 50 percent across all scenarios. Among reference and evolving policies scenarios, emissions intensity falls by between 51 percent (IEA CPS) and 64 percent (Equinor Walls), with deeper reductions under ambitious climate scenarios (Figure 32).
Figure 32. Change in CO₂ Emissions per $1,000 of GDP, 2023 = 1
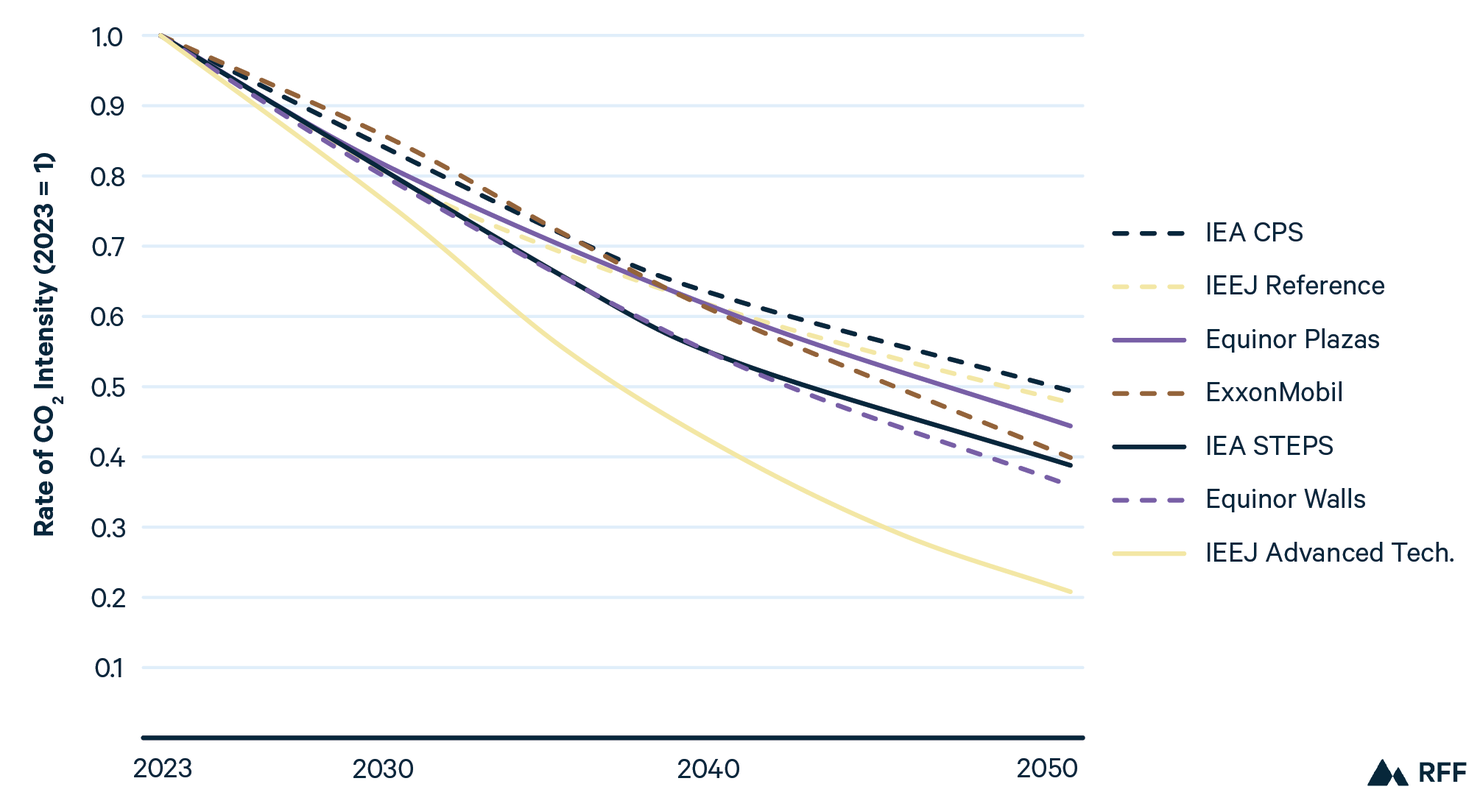
The rates of decline in reference and evolving policies scenarios are consistent with historical trends, as global emissions intensity fell by 54 percent between 2000 and 2024. Ambitious climate scenarios targeting net-zero emissions by 2050 show far greater reductions but are not included here for the reasons discussed in Sections 1 and 2.
4. Data and Methods
In this paper, we examined projections from the following publications: As our methodology does not vary significantly from year to year, this section includes standing language. Much of that language originates from the 2019 version of the publication.52
- BNEF, New Energy Outlook 2025
- bp, Energy Outlook 2025
- Equinor, 2025 Energy Perspectives
- ExxonMobil, 2025 Global Outlook
- IEA, World Energy Outlook 2025
- IEEJ, IEEJ Outlook 2026
- OPEC, 2025 World Oil Outlook 2050
- Total, Energy Outlook 2025
These outlooks vary across a variety of dimensions, including differences in modeling techniques, historical data, economic growth assumptions, policy scenarios, and more. Generally, scenarios can be grouped into three categories: (1) reference, which assume no major policy changes; (2) evolving policies, which incorporate the modeling team’s expectations of policy trends; and (3) alternatives, which are typically based on certain policy targets or technology assumptions. We focus on ambitious climate scenarios, a major subset of category 3. Table 3 summarizes the scenarios included in this year’s analysis.
Table 3. Sources and Scenarios
4.1. Harmonization
Variations in underlying assumptions about the future of policies, technologies, and markets produce useful variation among outlooks, allowing analysts to view a wide range of potential energy futures. However, outlooks also have important methodological differences, which can complicate direct comparisons and reduce the ability to draw insights.
One major difference is the choice of reporting units. For primary energy, outlooks use different energy units, such as QBtu, million tonnes of oil equivalent (mtoe), or exajoules (EJ). In this report, we standardize all units to QBtu. For fuel-specific data, outlooks also vary, using million barrels per day (mbd) or million barrels of oil equivalent per day (mboed) for liquid fuels, billion cubic meters (bcm) or trillion cubic feet (tcf) for natural gas, and million tonnes of coal equivalent (mtce) or million short tons (mst) for coal, and terawatt hours (TWh) or gigawatt hours (GWh) for electricity generation. Table 4 presents the reporting units for each outlook, and Table 5 provides relevant conversion factors.
Table 4. Units of Energy Consumption, by Outlook
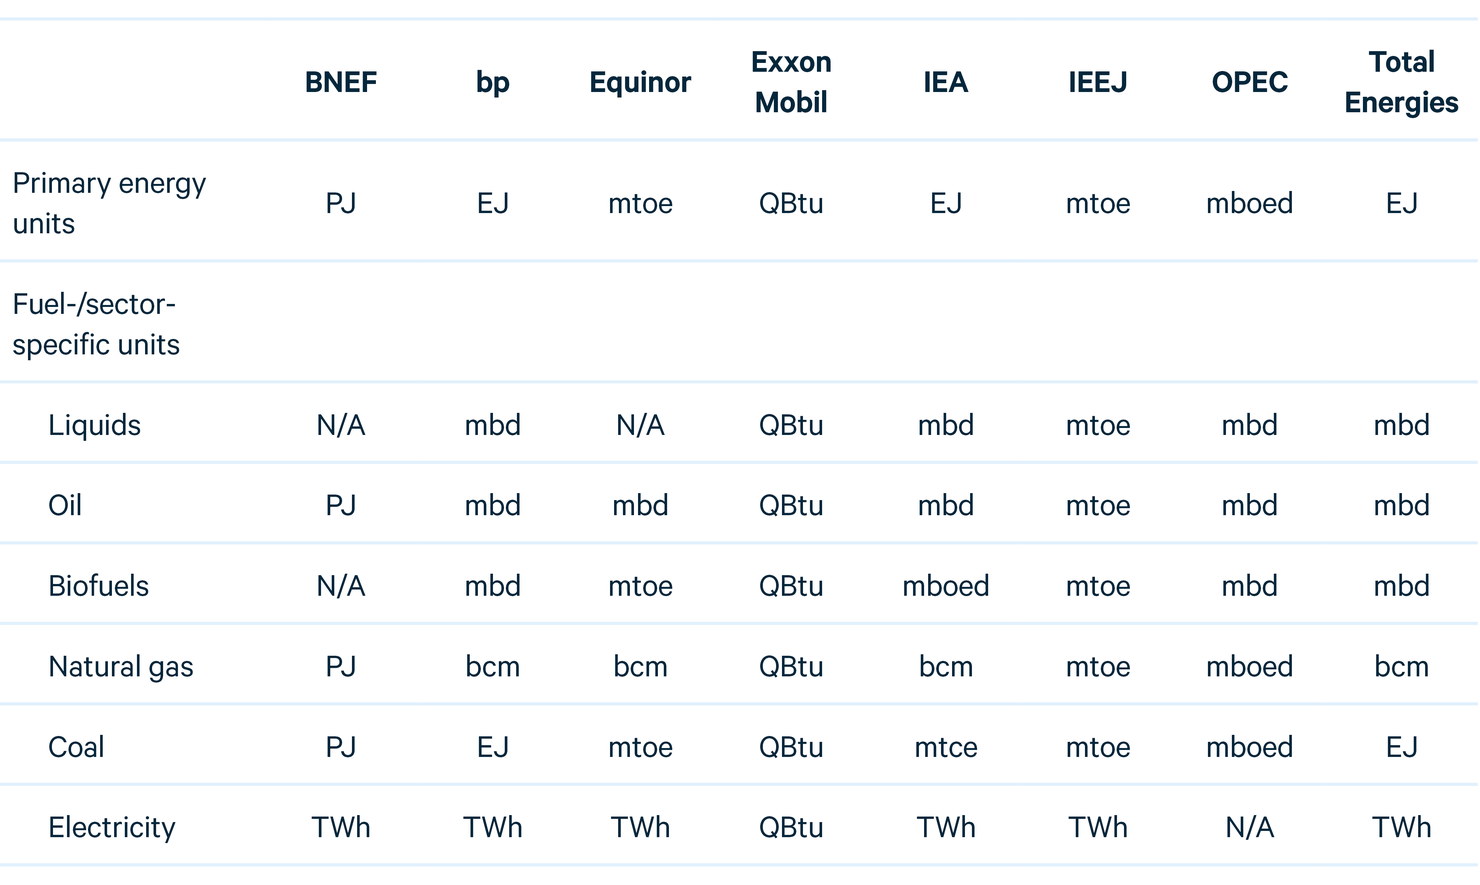
Note: Units are per year unless the unit abbreviation indicates otherwise. N/A indicates that fuel-specific data are not available for a given source.
Table 5. Conversion Factors for Key Energy Units
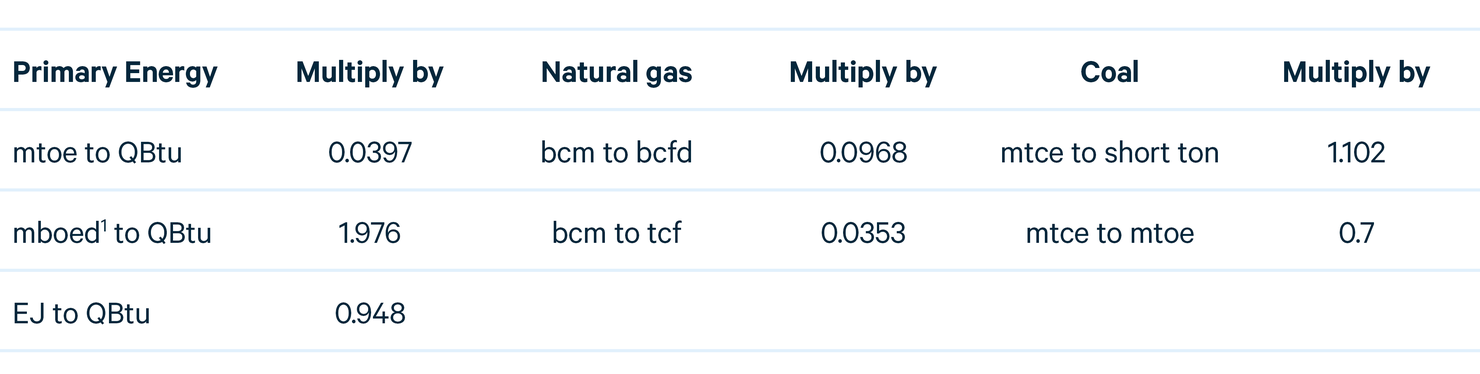
Note: There is no agreed-upon factor for boe because the energy content in a barrel of oil varies by oil type. IEA reports that typical factors range from 7.15 to 7.40 boe per toe, and OPEC uses a conversion factor of 7.33 boe per toe. We derive 1.976 QBtu/mboed by multiplying 49.8 mtoe/mboed (=1 toe / 7.33 boe * 365 days per year) by 0.03968 QBtu/mtoe.
A second key difference among outlooks is that assumptions about the energy content in a given physical unit of fuel result in different conversion factors between data presented in energy units (e.g., QBtu) and those presented in physical units (e.g., mbd or bcm). Among the outlooks we examine, these assumptions vary by up to 10 percent. Although conversion unit variations may appear small, they are amplified when applied across the massive scale of global energy systems, particularly over a long time horizon.
A third major difference results from varying decisions about including nonmarketed biomass, such as locally gathered wood and dung, in historical data and projections for primary energy consumption.
Yet another difference relates to comparing the energy content of fossil and nonfossil fuels. The primary energy content of oil, natural gas, and coal is relatively well understood and similar across outlooks. However, a substantial portion of that embodied energy is wasted as heat during combustion. Because nonfossil fuels, such as hydroelectricity, wind, and solar, do not generate substantial amounts of waste heat, identifying a comparable metric for primary energy is difficult, and outlooks take a variety of approaches.
Other differences in outlooks include (1) different categorizations for liquid fuels and renewable energy, (2) different regional groupings for aggregated data and projections, (3) use of net versus gross calorific values when reporting energy content of fossil fuels, (4) use of net versus gross generation and consideration of curtailed generation when reporting electricity data, and (5) whether and how flared natural gas is included in energy consumption data.
To address those challenges and allow for a more accurate comparison across outlooks, Newell and Iler53 apply a harmonization process, which we update and use it here. In previous years, we included a methodology report (see Raimi and Newell54). This year’s report follows the same process, outlined in this report, but with updated numbers. For any specific questions about our methods, please contact Daniel Raimi ([email protected]).
5. Statistics
Table 6. Global Key Indicators
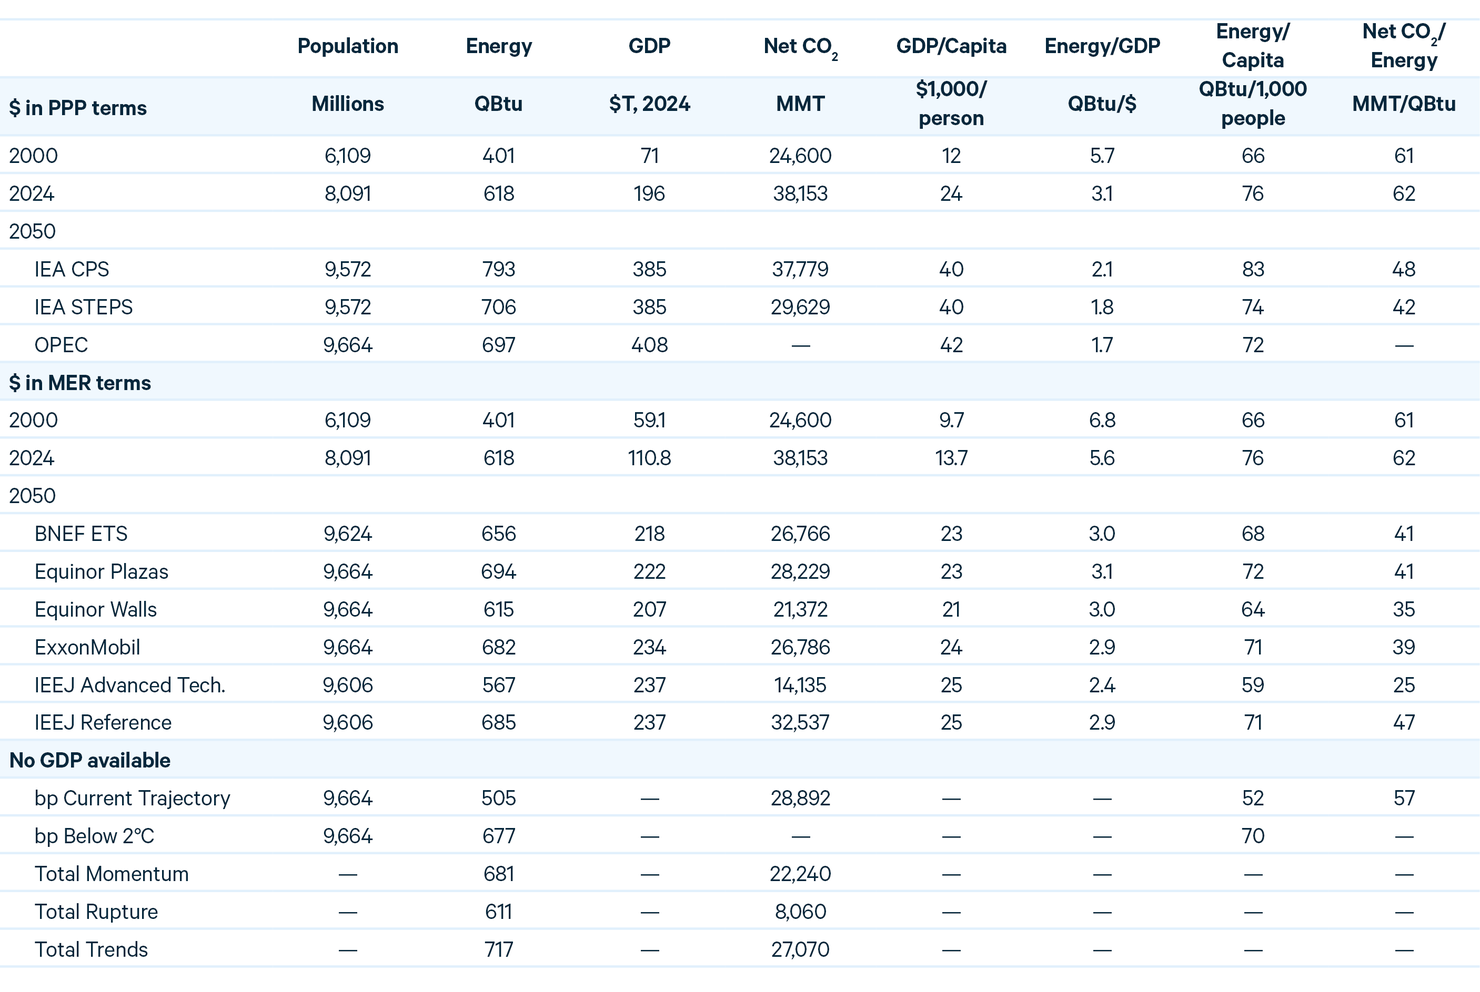
Sources: Historical data from IEA Statistics, IEA World Energy Outlook 2025, and BNEF New Energy Outlook 2025.
Note: Net CO₂ emissions include positive (gross) and negative emissions from sources such as direct air capture and bioenergy with CCS. CO₂ emissions data include fossil fuel combustion and exclude industrial process emissions.
Table 7. World Primary Energy Consumption
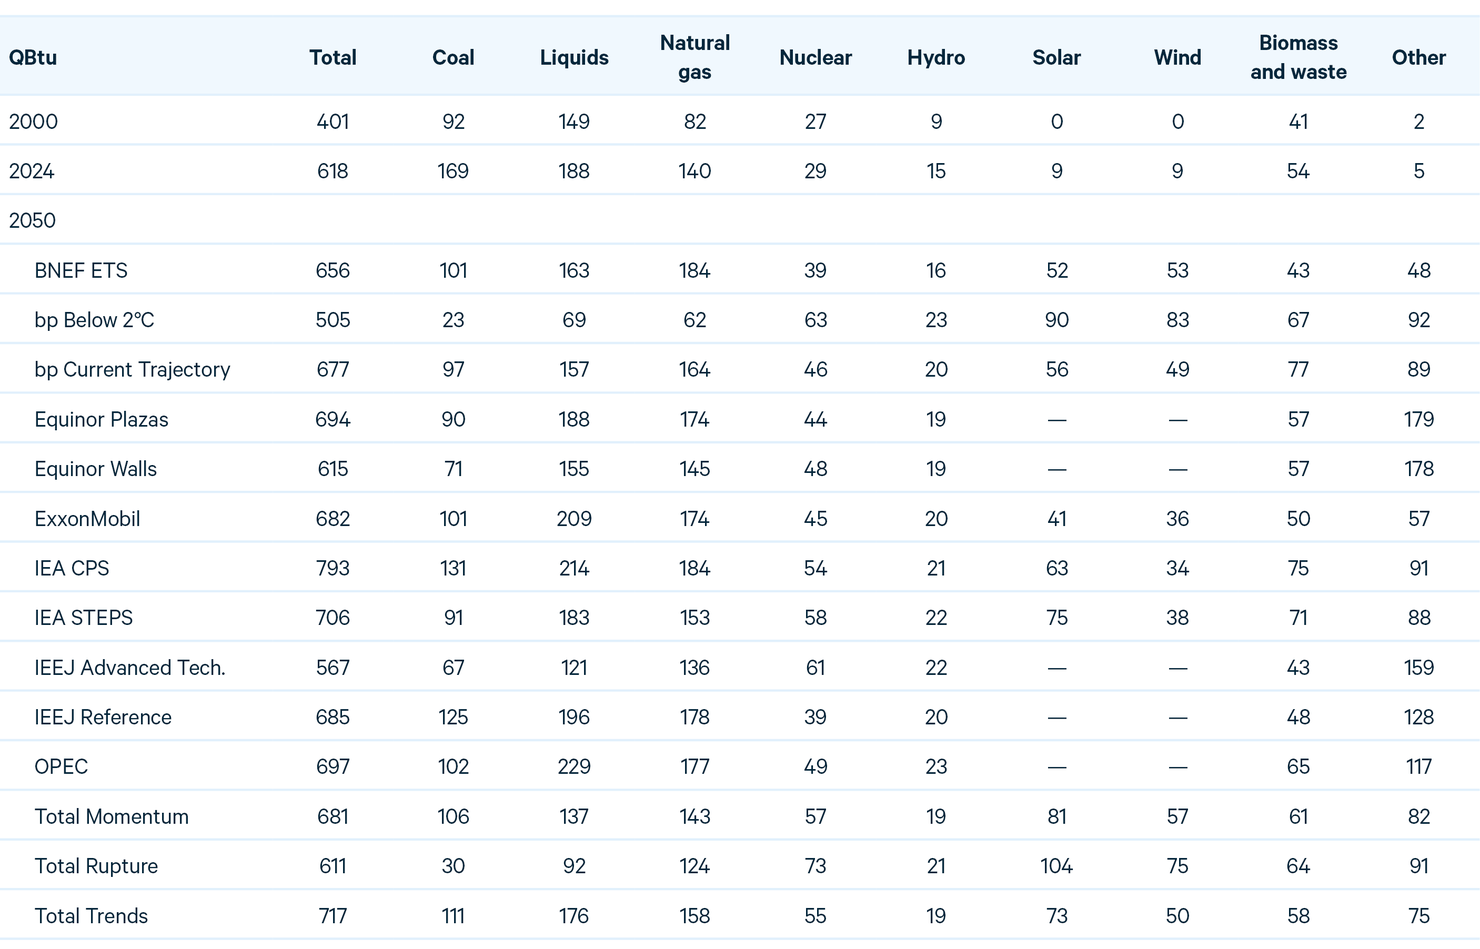
Sources: Historical data from IEA Statistics and IEA World Energy Outlook 2025.
Note: “Liquids” include only oil for BNEF, as biofuels-specific data were not available.
Table 8. Liquids Consumption, by Region
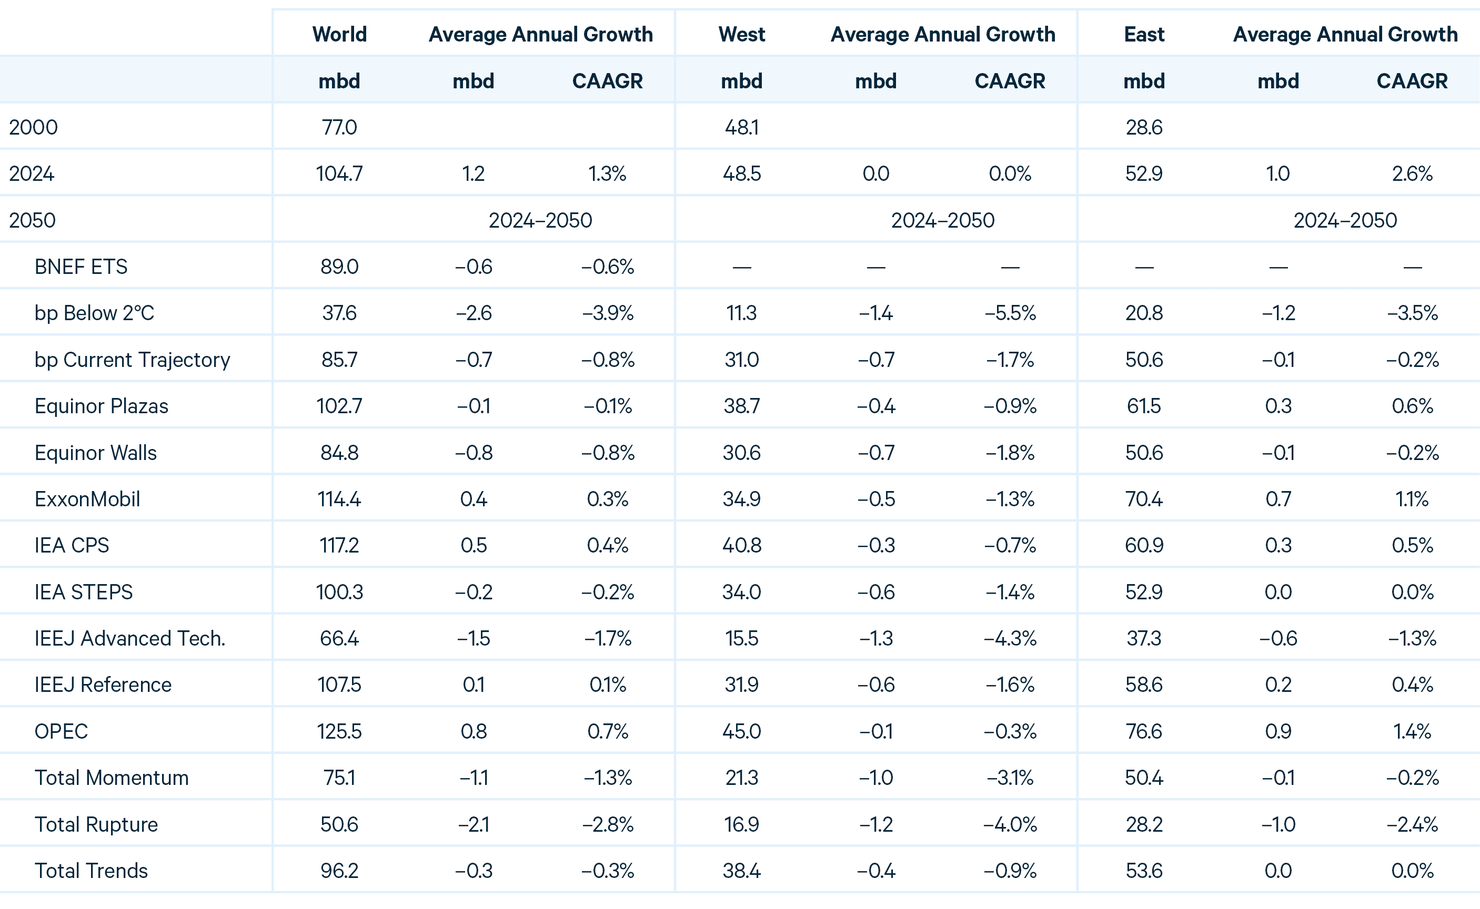
Sources: Historical data from IEA Statistics and IEA World Energy Outlook 2025.
Notes: World “Liquids” include only oil for BNEF as biofuels data were not available. East and West “Liquids” include only oil for IEA, OPEC, and Total as regional biofuels data were not available. Regional totals may not sum because of different treatment of international aviation and bunker fuels and exclusion of biofuels in regional data. Where volumetric data are not published, we assume a conversion factor of 1.832 QBtu per mbd, or 0.54585 mbd per QBtu.
Table 9. Natural Gas Consumption, by Region
Source: Historical data from the Energy Institute.¹²
Note: Where volumetric data are not available, we assume a conversion factor of 30.464 QBtu per bcm or 0.03283 bcm per QBtu.
Table 10. Coal Consumption, by Region
Sources: Historical data from IEA Statistics and IEA World Energy Outlook 2025.
Table 11. Nuclear Consumption, by Region
Sources: Historical data from IEA Statistics and IEA World Energy Outlook 2025.
Table 12. Global Electricity Generation, by Source
Sources: Historical data from IEA Statistics and IEA World Energy Outlook 2025.
Note: Equinor excludes electricity generation used in electrolysis to produce hydrogen.
Table 13. Global Renewable Electricity Generation, by Source
Sources: Historical data from IEA Statistics and IEA World Energy Outlook 2025.
Note: Equinor and Total include geothermal in “other.” ExxonMobil includes biomass and waste and geothermal in “other.” OPEC includes geothermal, wind, and solar in “other.” “Biomass and waste” includes biogas.
Table 14. Net Carbon Dioxide Emissions, by Region
Source: Historical data from the Energy Institute.¹²
Notes: Net CO₂ emissions include positive (gross) and negative emissions from sources such as direct air capture and bioenergy with CCS. CO₂ emissions data include fossil fuel combustion and exclude industrial process emissions. bp data are omitted where they include methane emissions that cannot be disaggregated. Regional CO₂ emissions are not provided by Equinor. OPEC did not publish CO₂ projections in their World Oil Outlook 2025.
Endnotes
- BNEF. New Energy Outlook 2025. https://about.bnef.com/insights/clean-energy/new-energy-outlook (2025).
- bp. Energy Outlook 2025. https://www.bp.com/content/dam/bp/business-sites/en/global/corporate/pdfs/energy-economics/energy-outlook/bp-energy-outlook-2025.pdf (2025).
- Equinor. Energy Perspectives 2025: Global Macroeconomic and Energy Market Outlook. https://cdn.equinor.com/files/h61q9gi9/global/3614d79cb24d8d69f8551477dc3119c510e76c4c.pdf (2025).
- ExxonMobil. 2025 Global Outlook. https://corporate.exxonmobil.com/-/media/global/files/global-outlook/2025-executive-summary.pdf (2025).
- International Energy Agency. World Energy Outlook 2025. https://www.iea.org/reports/world-energy-outlook-2025 (2025).
- Institute of Energy Economics, Japan. IEEJ Outlook 2026. https://eneken.ieej.or.jp/data/12798.pdf (2025).
- OPEC. 2025 World Oil Outlook 2050. https://publications.opec.org/woo/Download (2025).
- TotalEnergies. Energy Outlook 2025. https://totalenergies.com/sites/g/files/nytnzq121/files/documents/totalenergies_TotalEnergies_presentation_Energy_Outlook_2025_EN.pdf (2025).
- Nemet, G., Greene, J., Müller-Hansen, F. and Minx, J. C. “Dataset on the adoption of historical technologies informs the scale-up of emerging carbon dioxide removal measures.” Communications Earth and Environment 4, 397 (2023).
- Smith, P. et al. “Biophysical and economic limits to negative CO2 emissions.” Nature Climate Change 6, 42–50 (2016).
- US Department of Energy. At COP28, Countries Launch Declaration to Triple Nuclear Energy Capacity by 2050, Recognizing the Key Role of Nuclear Energy in Reaching Net Zero. https://www.energy.gov/articles/cop28-countries-launch-declaration-triple-nuclear-energy-capacity-2050-recognizing-key (2023).
- Energy Institute. 2025 Energy Institute Statistical Review of World Energy. (2025).
- IRENA. IRENA Call to Triple Renewables by 2030 Becomes a Key Commitment at COP28. https://www.irena.org/News/pressreleases/2023/Dec/IRENA-Call-to-Triple-Renewables-by-2030-Becomes-a-Key-Commitment-at-COP28 (2023).
- World Bank. World Bank Open Data. World Bank Open Data. https://data.worldbank.org (2025).
- Global Carbon Budget. The Latest GCB Data (2025). Global Carbon Budget. https://globalcarbonbudget.org (2025).
- Rohde, R. Global Temperature Report for 2025. Berkeley Earth. https://berkeleyearth.org/global-temperature-report-for-2025/ (2026).
- International Energy Agency. Energy Statistics Data Browser. https://www.iea.org/data-and-statistics/data-tools/energy-statistics-data-browser (2025).
- International Energy Agency. Oil. https://www.iea.org/reports/oil-2025 (2025).
- International Energy Agency. Gas. https://www.iea.org/reports/gas-2025 (2025).
- International Gas Union. Global Gas Report 2025. https://www.igu.org/igu-reports/global-gas-report-2025 (2025).
- US Department of the Interior. The Trump administration protects U.S. national security by pausing offshore wind leases. https://www.doi.gov/pressreleases/trump-administration-protects-us-national-security-pausing-offshore-wind-leases (2025).
- Global Energy Monitor et al. Boom and Bust Coal 2025: Tracking the Global Coal Plant Pipeline. https://globalenergymonitor.org/wp-content/uploads/2025/03/Boom-Bust-Coal-2025.pdf (2025).
- Qin, Q. and Shearer, C. Coal Is Losing Ground, but Not Letting Go: Structural Inertia and the Struggle to Shift Coal’s Role in China’s Power System. https://energyandcleanair.org/wp/wp-content/uploads/2025/08/CREA_GEM_China_Coal-power_H1-2025.pdf (2025).
- International Energy Agency. Coal 2025: Analysis and Forecast to 2030. https://iea.blob.core.windows.net/assets/113a8274-500c-4684-951f-947d25bef3c9/Coal2025.pdf (2025).
- Myllyvirta, L. Coal Power Drops in China and India for First Time in 52 Years After Clean-energy Records. Energy records. https://www.carbonbrief.org/analysis-coal-power-drops-in-china-and-india-for-first-time-in-52-years-after-clean-energy-records/ (2026).
- US Energy Information Agency. Annual Energy Outlook 2025. https://www.eia.gov/outlooks/aeo/ (2025).
- Strengthening United States National Defense With America’s Beautiful Clean Coal Power Generation Fleet. Federal Register. https://www.federalregister.gov/documents/2026/02/17/2026-03156/strengthening-united-states-national-defense-with-americas-beautiful-clean-coal-power-generation (2026).
- US Department of Energy. 2025 DOE 202(c) Orders. https://www.energy.gov/ceser/2025-doe-202c-orders.
- US Department of Energy. Energy Department Announces $625 Million Investment to Reinvigorate and Expand America’s Coal Industry. https://www.energy.gov/articles/energy-department-announces-625-million-investment-reinvigorate-and-expand-americas-coal (2025).
- US Department of Energy. Energy Department Announces $175 Million to Modernize Coal Plants, Keeping Affordable Reliable Power Online for Americans. https://www.energy.gov/articles/energy-department-announces-175-million-modernize-coal-plants-keeping-affordable-reliable (2026).
- Franklin, M. TVA recommits to coal at Tennessee plants as rules change under Trump. Knoxville News Sentinel (2026).
- Edmonds, A. Dry Fork Station Feed Study Signals First Possible Coal Expansion In Decades. https://wyoenergy.org/dry-fork-station-feed-study-signals-first-possible-coal-expansion-in-decades/ (2026).
- US Energy Information Administration. Annual Electric Power Industry Report, Form EIA-860 detailed data with previous form data (EIA-860A/860B). https://www.eia.gov/electricity/data/eia860/ (2025).
- US Department of Energy. Energy Secretary Prevents Closure of Coal Plant That Provided Essential Power During Winter Storm. https://www.energy.gov/articles/energy-secretary-prevents-closure-coal-plant-provided-essential-power-during-winter-storm (2026).
- Office of Energy Statistics. Retirement delays of U.S. electric generating capacity may continue in 2026. Today in Energy (2026).
- Consumers Energy Company and Consumers Energy Company. CMS Energy Corporation Consumers Energy Company Annual Reports on Form 10‑K to the Securities and Exchange Commission for the Year Ended December 31, 2025 (2025).
- Climate Watch. Historical GHG Emissions. https://www.climatewatchdata.org/ghg-emissions?end_year=2023&start_year=1990 (2026).
- Economics, O. of P. and Climate Change Division, O. of A. and R. Report on the Social Cost of Greenhouse Gases: Estimates Incorporating Recent Scientific Advances. https://www.epa.gov/system/files/documents/2023-12/epa_scghg_2023_report_final.pdf (2023).
- US Energy Information Administration. How much carbon dioxide is produced per kilowatthour of U.S. electricity generation. Frequently Asked Questions https://www.eia.gov/tools/faqs/faq.php?id=74&t=11.
- US Enviornmental Protection Agency. Greenhouse Gas Equivalencies Calculator. https://www.epa.gov/energy/greenhouse-gas-equivalencies-calculator (2024).
- US Enviornmental Protection Agency. Technical Support Document Estimating the Benefit per Ton of Reducing Directly-Emitted PM2.5, PM2.5 Precursors and Ozone Precursors from 21 Sectors. https://www.epa.gov/system/files/documents/2021-10/source-apportionment-tsd-oct-2021_0.pdf (2023).
- Cheng, E. China’s EV price war is heating up. What’s behind the big discounts? CNBC. https://www.cnbc.com/2025/05/29/chinas-ev-price-war-heats-up-whats-behind-the-big-discounts.html.
- Stylianou, N., Learner, S., de la Torre Arenas, I. and Joiner, S. How mega batteries are unlocking an energy revolution. The Financial Times (2025).
- International Energy Agency. Energy Efficiency 2025. https://www.iea.org/reports/energy-efficiency-2025/transport (2025).
- Eckert, N. and Roy, A. Automakers push EV sales as $7,500 US tax credit is set to end. Reuters (2025).
- Sharma, N. and Haake, G. Trump signs resolutions blocking California’s pro-EV rules. NBC News (2025).
- EPA Press Office. Trump EPA kicks off formal resconsiderations of endangerment finding with agency partners. US Environmental Protection Agency. https://www.epa.gov/newsreleases/trump-epa-kicks-formal-reconsideration-endangerment-finding-agency-partners (2025).
- Dupont, C. et al. “Three decades of EU climate policy: Racing toward climate neutrality?” WIREs Climate Change, 15 (2024).
- Andersson, J. J. “Carbon Taxes and CO2 Emissions: Sweden as a Case Study.” American Economic Journal: Economic Policy 11, 1–30 (2019).
- Pearson, P. J. G. and Watson, J. “The unfolding low-carbon transition in the UK electricity system.” Proceedings of the National Academy of Sciences 120, e2206235120 (2023).
- Woerdman, E., Roggenkamp, M. & Holwerda, M. EU climate policy. in Essential EU Climate Law 10–42 (Edward Elgar Publishing, 2021).
- Newell, R. G., Raimi, D. and Aldana, G. Global Energy Outlook 2019: The Next Generation of Energy. https://www.rff.org/publications/data-tools/global-energy-outlook/ (2019).
- Newell, Richard, and Stuart Iler. 2013. The Global Energy Outlook. National Bureau of Economic Research. https://doi.org/10.3386/w18967.
- Raimi, D. and Newell, R. G. Global Energy Outlook Comparison Methods: 2023 Update. https://www.rff.org/publications/data-tools/global-energy-outlook/ (2023).