Green Public Procurement for Natural Gas, Cement, and Steel
Green public procurement programs tend not to include basic materials like steel, iron, natural gas, and cement. This report describes what programs geared towards basic materials may look like, and how public programs at both the state and federal levels can be successfully implemented.
Key Findings
- Expanding green public procurement programs to include materials and fuel with large CO2 and methane emissions could create market incentives for producers and encourage innovation and best practice.
- The most important drivers for a program’s success are the design, funding, industry engagement, policy strength, staff, and leadership commitment.
- The perception that environmentally friendly products are more expensive than traditional ones is a major barrier to green procurement programs. Another significant barrier is the lack of implementation expertise for procuring green materials (such as cement and steel) for buildings, roads, bridges, and vehicles. Still, governments in Europe and, very recently California, are moving down this path, with the federal government poised as well.
- Design decisions on green standards, certification bodies and processes, as well as tools for firms to calculate their carbon footprint are critical to program success.
1. Introduction
Governments at all levels around the world are increasing their focus on procuring products that are environmentally sustainable. In the United States, green procurement programs exist at every level of government, from federal and state to county and city. The US Environmental Protection Agency (EPA) has a well-developed green purchasing program, as do the Department of Defense (DOD) and the General Services Administration (GSA) and others. California and New York are among the states with significant programs. The European Union features green public procurement (GPP) guidelines for member states (EU 2020), and the Netherlands (EC 2016b), for one, appears to have an exemplary program.
The types of products covered by these programs include office electronics and building materials. Notably, the US programs generally cover finished products commonly procured or leased by institutional purchasers and do not yet cover basic materials, such as fuels, cement, and steel, or products that incorporate these materials, such as civilian and military vehicles (except alternate-fueled vehicles), ships, and aircraft. (The California program for some steel products is an exception.) However, some programs do recommend standards and/or ecolabels requiring that commodities have greener inputs. An example is EPA’s Environmentally Preferable Purchasing (EPP) program, which includes in its recommendations some life-cycle, multi-attribute standards, like Cradle to Cradle Certified(TM), which addresses the upstream climate and other impacts of products. For example, one category of criteria in Cradle to Cradle is “material health,” which requires that products be made using chemicals that are as safe as possible. Another category, “renewable energy and carbon management,” tracks the use of renewable energy in manufacturing. (Some programs that do cover cement and/or iron and steel are noted below.)
Green procurement programs seek to find products that are more environmentally sustainable than traditional offerings. These products may carry third-party certifications for high energy efficiency or reduced levels of dangerous metals. The procurement program may use these ratings or set its own. The EPA EPP program recommends private sector standards and/or ecolabels for a host of products typically purchased by governments.
An important issue is how to define “green.” Note that we are using the term green, as opposed to greener. We leave open how much greener a product has to be before it is considered green, and discuss standard setting below. Several environmental attributes across the life cycle of the product or service may be important for a particular program, but in this paper, a green product is defined as having a carbon footprint substantially lower than its traditional (brown) counterpart. This definition has three key terms.
By carbon footprint, we mean (most expansively) the emissions of carbon dioxide equivalent (CO2e) over its life cycle, from its inputs and production processes to final delivery to consumers. Some life-cycle calculations exclude use and degradation after disposal. Thus, for natural gas, the carbon footprint comprises the CO2 emitted by burning fossil fuels, either directly or through gas-fired electricity, to run the drilling, fracking, pumping, processing, transporting, and delivery operations; the CO2 emitted when the natural gas is burned to produce heat, electricity, or commodities (e.g., plastics); and the methane (the major constituent of natural gas, adjusted for its considerable global warming potential) emitted by accident or on purpose in the course of bringing the gas from the ground to market. For excellent overviews of green procurement, see CRS (2010, 2015). Although GPP leaders recognize a life-cycle analysis as most appropriate, not all programs are based on this complex approach; some consider emissions only at the production stage.
Substantially lower, the second term, can mean that the commodity’s carbon footprint is sufficiently low as to represent superior performance over its traditional brown counterpart (the third term). Superior performance is generally measured against a baseline, such as standard industry practice. Sometimes the performance benchmark is defined as average industry performance and not labeled as superior.
Continuing the natural gas example, the baseline for CO2 emissions is reasonably well understood, being based strictly on fossil fuel use, although the waters get muddier if the CO2 is being captured for long-term storage (a tiny amount) or used for enhanced oil recovery (larger amounts).
The baseline for methane emissions (as a fraction of natural gas produced, or methane intensity) enjoys little consensus (Roberts 2019), but the superior performance benchmarks are considered to be below the current performance of most companies. For instance, for natural gas, superior performance in the industry is defined by an external benchmark, in the sense that it depends on the amount of methane emissions relative to methane production rather than an internal relative benchmark, which depends on an assessment of industry performance. Thus, the weight of evidence suggests that the baseline methane emissions rate is around 3.5 percent. The industry’s voluntary benchmark for superior performance is 1 percent methane intensity over the life cycle (OneFuture https://onefuture.us/), but other stakeholders argue for tighter benchmarks. The Oil and Gas Climate Initiative (OGCI https://oilandgasclimateinitiative.com/), for example, has set a goal of 0.25 percent methane intensity by 2025, but this applies only to the upstream (production) segment.
Superior performance can also be defined using an internal industry assessment. This involves assessing individual plant or company performance and choosing, say, a top quartile benchmark, above which performance is defined as superior. A good example, not directly related to CO2 but certainly correlated with it, is the ENERGY STAR program for industry. Based on studies of plant-by-plant performance in a sector, such as cement, an energy performance measurement tool is developed that normalizes for differences among the industry’s plants; those in the lowest 25th percentile of energy use per ton of production are then eligible to apply for an ENERGY STAR certification.
This report considers three products that can be produced in environmentally preferable ways:
- Green natural gas. Also called responsibly sourced gas in the industry, this is gas certified to have been produced with a methane emissions intensity (measured as mcf of methane emissions, both leaked and as part of operations, divided by mcf of produced natural gas) below some benchmark indicating superior performance. Natural gas is used directly to provide heat and hot water in government buildings and to power vehicles, and indirectly in a variety of government-purchased manufactured products, which then are embodied in buildings, bridges, and roads built with government funds.
- Green cement. This includes cement produced with process fuel that is decarbonized or whose CO2 is captured at the site, or cement with embedded CO2 (i.e., utilization). To measure energy performance, the ENERGY STAR program uses Btu per ton of clinker produced (a more restrictive metric than one based on the weight of finished cement or its value). Cement is used primarily in building materials and infrastructure.
- Green iron and steel. Like cement, green iron and steel can be produced with an energy-efficient fossil fuel–fired blast furnace or an electric arc furnace fired by cleaner electricity, or producers may use carbon capture technology at the plant. Most mined iron is used to make steel. The few green procurement programs that cover iron and steel are product specific, such as hot rolled steel in California’s program, which measures CO2 emissions per ton of product produced or value of product produced. Steel is used in buildings, infrastructure, energy production and transmission, appliances, vehicles, and ships.
Those materials represent a large share of industrial emissions of CO2 and other greenhouse gases (GHGs). Natural gas methane emissions are estimated to be 22 percent of the US methane inventory and 2.3 percent of the methane plus CO2 inventory in 2018 (EPA 2020), but those figures have been called a vast underestimate (EDF 2020). CO2 emissions from the US cement sector are a bit less than 1 percent of the CO2 inventory. Iron and steel have about the same share as cement. Globally, though, according to Bataille (2019) citing the International Energy Agency, cement accounts for 6 percent of energy system combustion emissions and industrial process CO2, and iron and steel accounts for 8 percent.
Figure 1 shows that much of the world’s steel and cement ends up in just two product categories: structures and infrastructure.
Figure 1. End Uses of Iron and Steel, Cement, and Concrete

According to GSA (2020), building operations account for 28 percent of total global CO2 emissions, and building materials and construction, 11 percent.
In what follows, we describe the landscape of relevant activities bearing on green procurement of basic commodities, enumerate the goals to which government procurement programs aspire, and consider the possible pathways for reaching those goals. Out of this discussion come various hypotheses about the drivers for meeting program goals: market characteristics, product characteristics, and program characteristics. We then review papers providing empirical evidence pertaining to these hypotheses, and we look at several published evaluations of major programs. Next we discuss the characteristics of the markets and products associated with natural gas, cement, and steel and consider how those characteristics may affect the success of green procurement programs. We conclude with recommendations for using such programs to stimulate the market for green natural gas, cement, and steel.
2. Green Procurement: An Overview
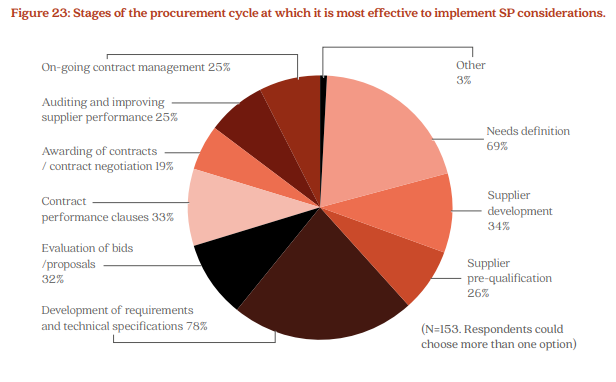
The United Nations’ Sustainable Development goal for Responsible Consumption and Production addresses green (in this case, termed sustainable) public procurement policies in Goal 12.7.1. https://environmentlive.unep.org/indicator/index/12_7_1 The goal statement notes that public procurement accounts for 12 percent of gross domestic product (GDP) in developed countries but much higher percentages in developing countries. A 2017 survey discussed in a UN Environment Programme report (UNEP 2017) found that 26 percent of the 41 responding countries had policies for sustainable consumption and production, with 78 percent engaging in some type of green procurement. Of the many stages of the procurement cycle, the development of requirements and technical specifications was thought to be the most effective in implementing sustainable procurement (Figure 2).
Figure 2. Respondents’ Evaluation of Stages for Implementing Sustainable Procurement
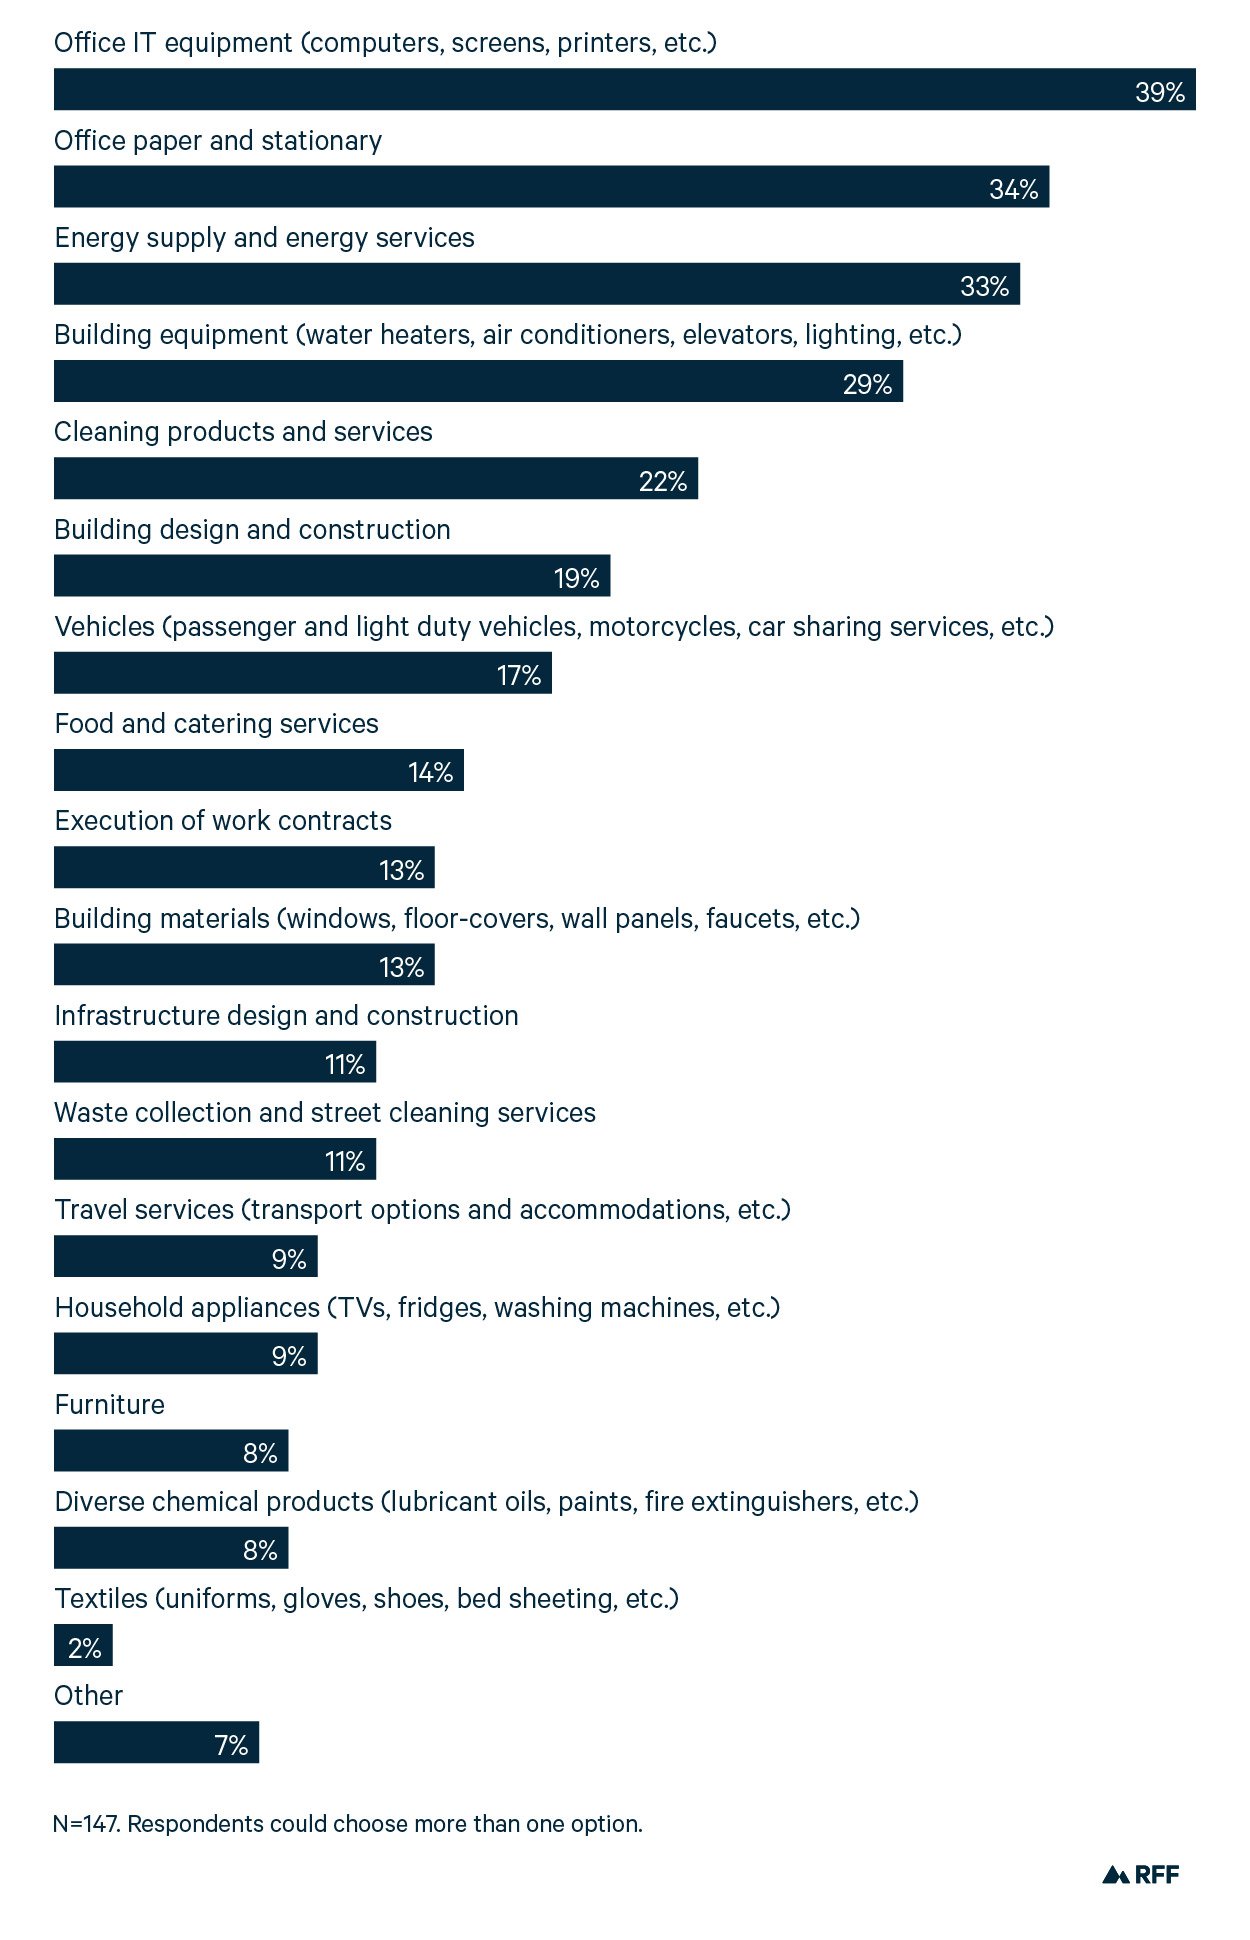
Public procurement agencies address a wide variety of products, some of which are better suited to “greening” than others. UNEP respondents believed that the top priority for product greening was office information technology, such as computers. Energy supply and services (the category that includes natural gas) came in third. Building construction and infrastructure, both of which use cement, iron, and steel, were sixth and 11th, respectively.
Figure 3. Respondents’ Prioritization of Products and Services for Sustainable Procurement
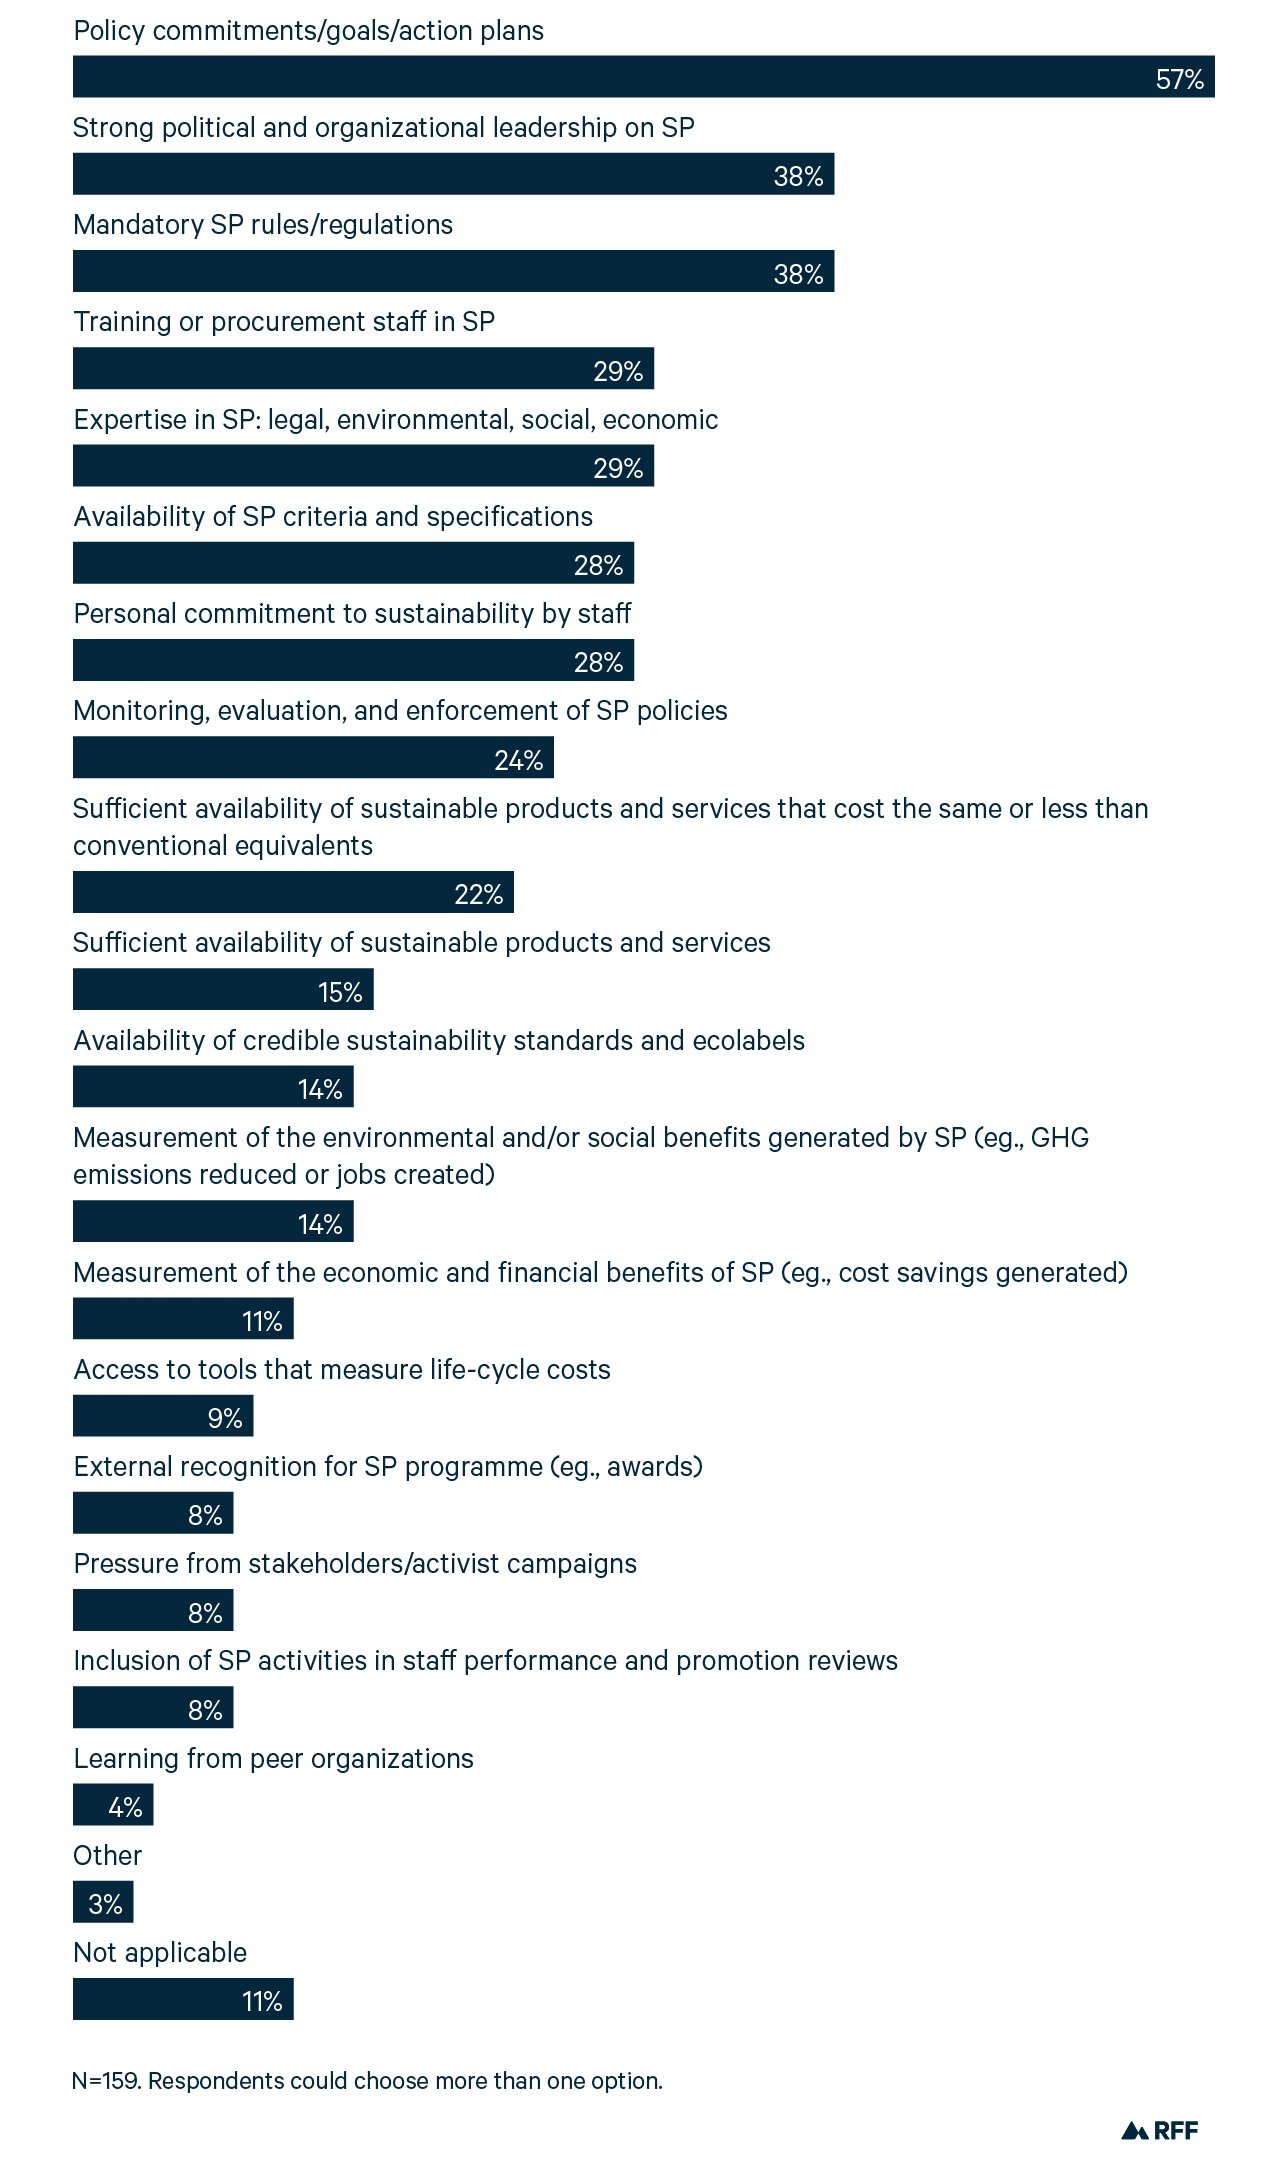
Survey respondents said that the top driver of sustainable procurement was organizational commitment, followed by leadership and legislative backing (Figure 4).
Figure 4. Respondents’ Identification of Drivers of Sustainable Procurement
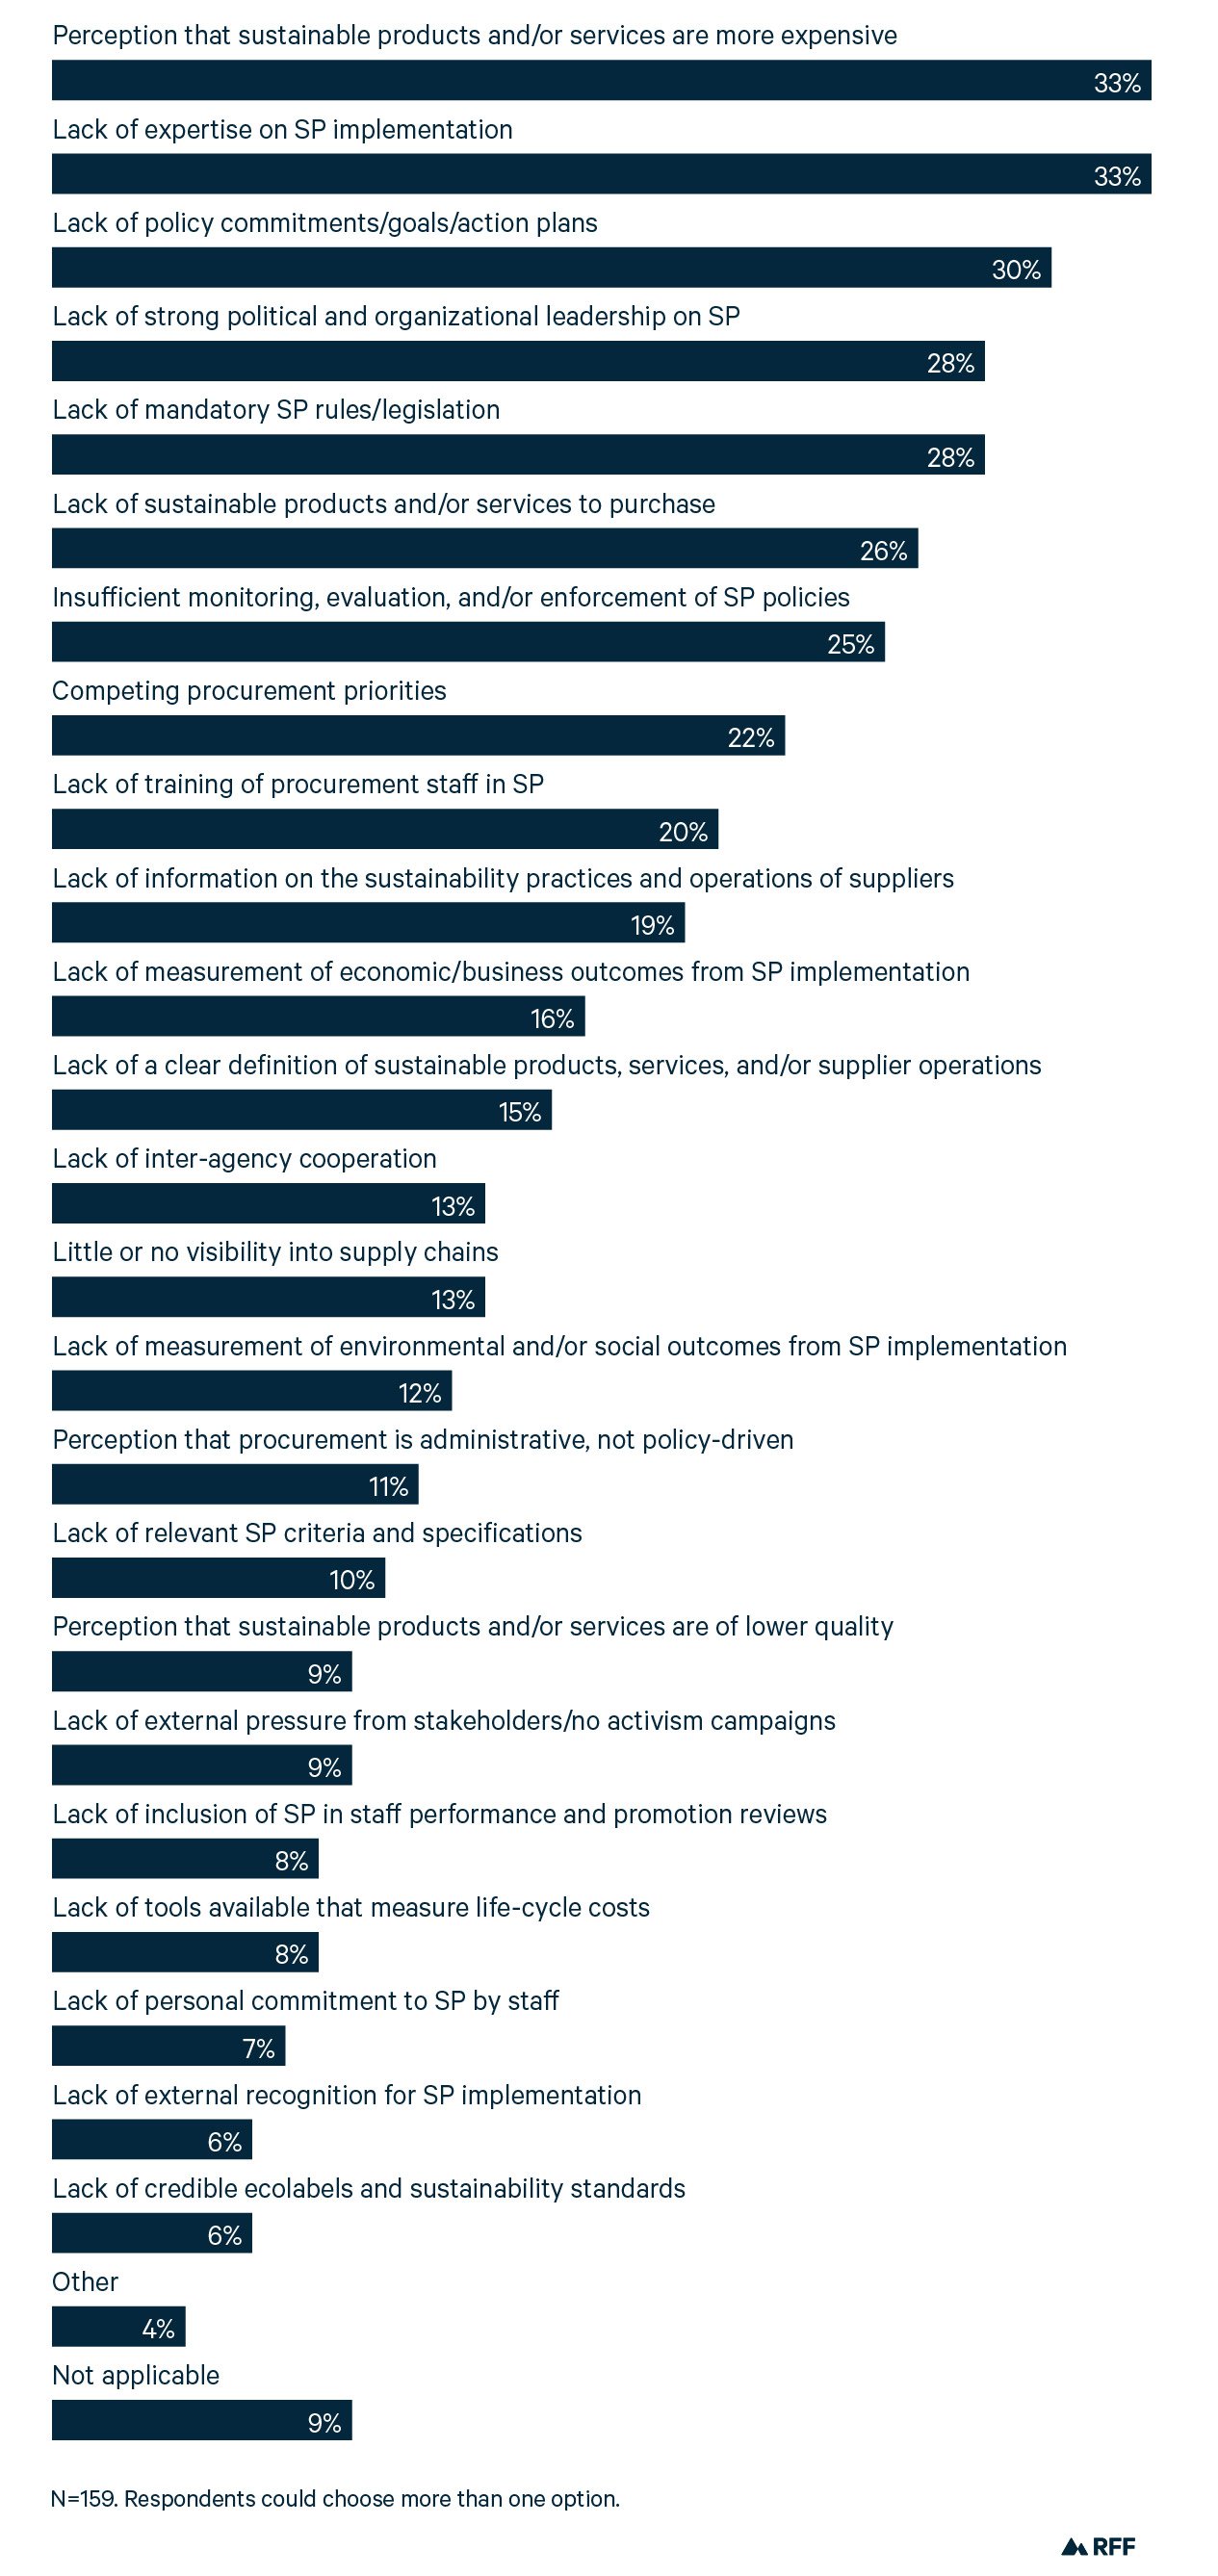
Leading barriers to green procurement—the flip side of the drivers—were economic considerations (green products were thought to be more expensive than their traditional counterparts) and a lack of implementation expertise (Figure 5).
3. The Green Public Procurement Landscape, Here and Abroad
3.1. European Union Programs
The European Union has particularly strong green public procurement programs (UNEP 2017; EC 2016a), of which the Netherlands program is one example. http://www.oecd.org/gov/ethics/gpp-procurement-Netherlands.pdf
The Netherlands program, which covered as many as 45 product groups, monetizes CO2 reductions and other environmental impacts below the maximum standard. Bidders are required to use a software program called DuboCalc,https://www.dubocalc.nl/en/ which calculates the life-cycle environmental effects of materials and energy, from extraction to demolition and recycling. These effects are collapsed into an environmental cost indicator, permitting procurers to compare bids for their environmental costs. Procurers can set a maximum cutoff for this indicator, above which bidders become ineligible. Procurers can also subtract the monetized values below the standard (the environmental “benefits”) from the bids to compare across bidders. For details on the Dutch system, see https://www.pianoo.nl/en/public-procurement-in-the-netherlands/sustainable-public-procurement-spp.
The Netherlands also has a CO2 performance ladder with 5 rungs (OECD 2015) for procurement of construction works and materials, and monetizes the appropriate rung of the latter for subtraction from the bid. A third party certifies the CO2 performance of companies that volunteer. All this information is made available on a portal, TenderNED. Another institution, PIANOo, exists to provide advice to bidders.
3.2. US Federal Programs
The US federal government’s procurement accounts for a small share of the US economy compared with the case in the European Union: although the United States spends more than $550 billion on products and services each year,https://blog.gao.gov/2020/05/26/a-snapshot-of-government-wide-contracting-for-fy-2019-infographic/ that is only 2.6 percent of the $22 trillion US economy, whereas EU member states’ procurement is 14 to 16 percent of their economies.
There are two types of federal programs (CRS 2010): market and agency. Market-facing programs aim to assist consumers and industry in meeting their goals for green products. For instance, the Federal Trade Commission’s Green Guides program helps industry avoid misleading consumers about the attributes of their products. The agency programs specify standards for green procurement by the government itself (FTC, n.d.)
The Resource Conservation and Recovery Act (RCRA) was the first legislation to undergird green procurement programs; enacted in 1976, it required government agencies to purchase products containing recycled or recovered content. In 1993, the Energy Policy Act directed federal purchasers to procure ENERGY STAR–certified products. Since then, regulations, legislation, executive orders, policy documents, and agency offices have raised the scope and profile of green procurement programs.
Some programs focus on a single product (e.g., alternate-fuel vehicles) or environmental attribute; others cover a wide variety of products from many sectors and many attributes, including GHG footprint. A good example of a multiple-attribute private sector ecolabel program is the Electronic Product Environmental Assessment Tool (EPEAT), which incentivizes low-toxicity inputs, energy-efficient use, renewable energy use by OEMs and their suppliers, energy efficient supply chains, elimination or capture and destruction of FGHGs used in flat panel display and semiconductor manufacturing, and other attributes and brings together a variety of certifications and standards.
Environmental Protection Agency Environmentally Preferable Purchasing Program. The EPP is worth a deeper dive because it is in the forefront of federal procurement programs, has been operating a long time, and has inspired initiatives around the world. This section benefited from discussions with EPA’s Environmentally Preferable Purchasing program staff (summer 2020). See www.epa.gov/greenerproducts for more information. The EPP website lists its goals as harnessing private sector innovation, supporting greater efficiency in the federal government, preventing pollution, realizing life-cycle cost savings, and increasing industry competitiveness abroad.
In general, the EPP program gives preference to multi-attribute standards and ecolabels that address the key environmental impacts or “hotspots” across the life cycle of the product and for which EPA has been able to identify a competent certification body.
The EPP program engages with procurement staff in federal agencies, works to build consensus in private sector standards development, encourages ecolabel organizations to develop robust product registries and calculators to document cost savings and environmental benefits achieved due to procurement of more sustainable products, and focuses on sectors where the federal government represents a significant segment of the market, including some electronic products. EPP, like other GPP programs that operate through multistakeholder consensus, are sometimes criticized for setting or recommending standards that reflect average industry performance, rather than pushing the industry to innovate, while other stakeholders may find the recommended standards and ecolabels too rigorous.
The EPP program works with partners, such as the Sustainable Purchasing Leadership Council and federal interagency working groups, as well as private sector standards development organizations, to help send clear signals to the market regarding expectations and performance standards. EPEAT, in particular, was developed by a non-profit, the Green Electronics Council, based on work done by a collaborative group of stakeholders convened by an EPA grantee.
With implications for cement, natural gas, and iron and steel, which are not yet covered by EPP, the various green building programs (e.g., ENERGY STAR rating system) have “long coattails”: these mature programs could fairly easily be built on to address procurement of low-CO2 products by requiring that materials (or industrial plants) be ENERGY STAR certified, for instance.
Environmental Protection Agency's ENERGY STAR. This section benefited from discussions with EPA’s ENERGY STAR program staff (summer 2020). Although the purpose of EPA’s ENERGY STAR program (and others like it around the world) is to highlight products (and also buildings) that have superior performance in energy use or embodied energy, the close connection between energy use and CO2 emissions makes ENERGY STAR relevant to green procurement. This particular program’s emphasis on the energy performance of cement, iron, glass, and steel manufacturing plants makes it especially relevant.
The program provides industries with a superior performance benchmark set at the top 25th percentile of plants in a sector on the basis of energy use, expressed in mmBtus per unit of product (for cement, per ton of clinker produced). Plant-by-plant benchmarks (statistical models) are developed from analyses of representative industry data, such as that contained in the Census of Manufacturers or other reputable sources. Data from the plant seeking certification are plugged into a spreadsheet tool designed by ENERGY STAR to provide an estimate of the plant’s CO2 emissions intensity and score its energy performance in relationship to all plants in the sector. Plants making the certification cut must have their performance certified by a licensed professional engineer and meet other criteria (e.g., no significant violations under the Clean Air Act) to be granted the ENERGY STAR label in a particular year. The Energy Star program is not to be confused with the LEED (Leadership in Energy and Environmental Design) program, which certifies energy efficient and well-designed buildings that meet technical engineering criteria and may also include materials/appliances and other products that carry an Energy Star label.
Other Federal Agencies. Department of Defense and General Services Administration programs. Both agencies play an important role in green procurement. DOD is by a large margin the primary US agency purchasing construction materials and transportation equipment. Department of Defense, https://www.denix.osd.mil/spp/; Department of Energy, https://www.energy.gov/ehss/sustainable-acquisition. It also has a good record of developing green procurement protocols. A successful effort on green cement and green iron and steel would depend on DOD buy-in and implementation.
GSA This section on GSA has benefited from discussions with GSA staff (summer 2020). See also GSA (2020) and https://www.gsa.gov/tools-overview/buying-and-selling-tools/green-procurement-compilation. has a purchasing system for other federal agencies that highlights various green procurement attributes highlighted for products and federal programs (like EPEAT). GSA’s direct purchases are about medium sized relative to other agencies (other than DOD).
GSA has built some of the greenest buildings in the country and is considering innovative approaches to measure “embodied energy” for green cement and green iron and steel. GSA’s Green Building Advisory Council, a Federal Advisory Committee Act (FACA) group charged with advising GSA on how to increase the sustainability of the leased and owned federal building infrastructure, has formed the Embodied Energy Task Group. This group is composed of mostly nongovernmental experts who are developing an “Advice Letter” to share with GSA. It has examined the extent of potential benefits and addressed the design of procurement guidelines, although recommendations are yet to be finalized.
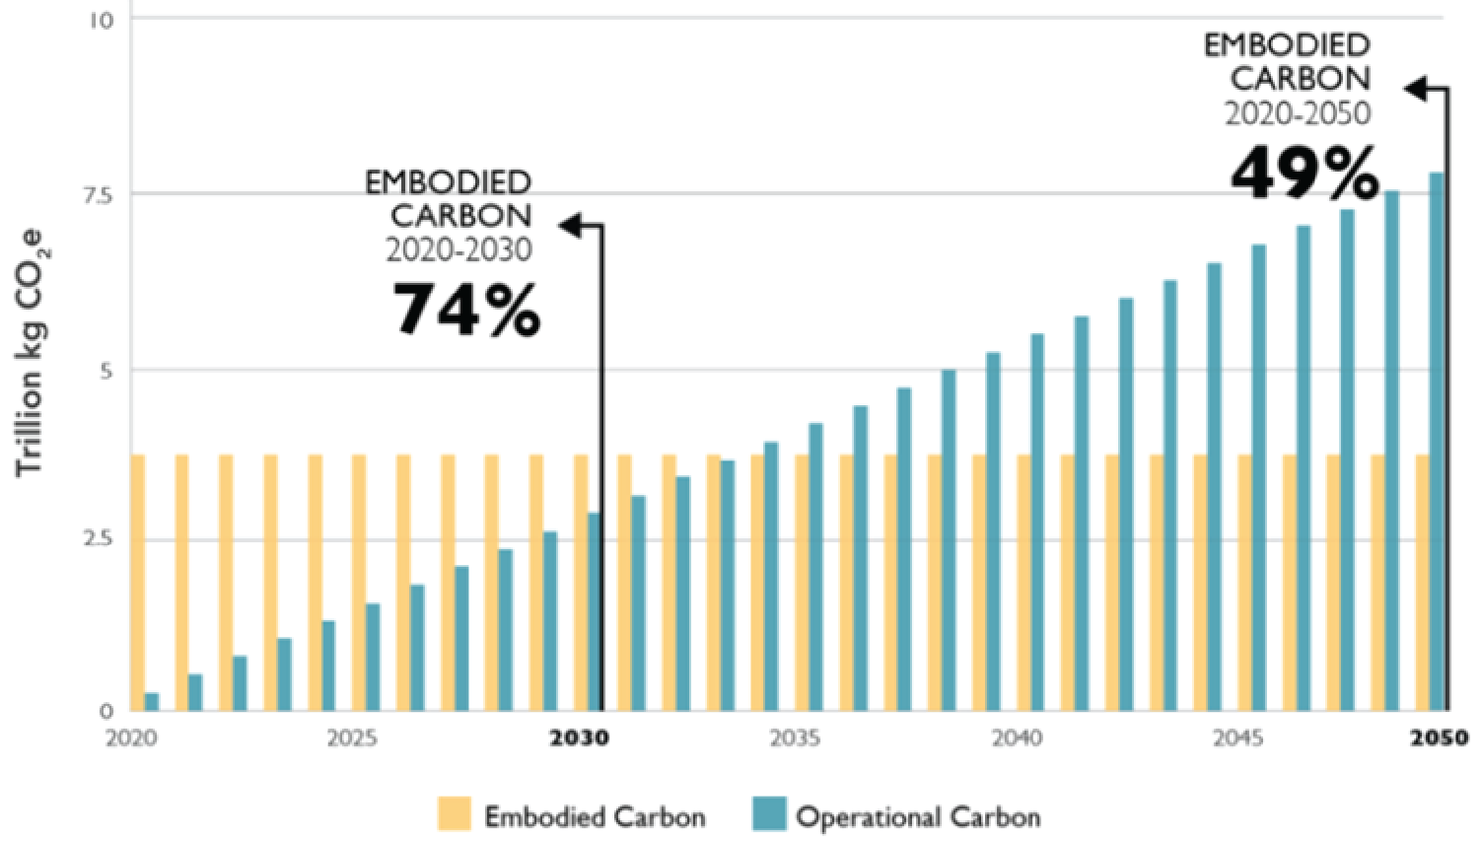
GSA’s Embodied Energy Task Group projects that over time, CO2 emissions from building operations (currently 28 percent of the global total) will grow while construction-related CO2 embodied in materials (11 percent) will remain flat (Figure 6). This suggests that procurement rules should stipulate that buildings be operated with green energy sources—electricity from renewables, of course, but potentially also low-methane natural gas.
Figure 6. Business-as-Usual Global Carbon Emissions from New Construction, 2020–2050
Within GSA’s purview, historically, are procurements for about 44 construction projects a year, accounting for 2 million gross square feet and a value exceeding $1 billion annually. The Embodied Energy Task Group estimates annual CO2e savings per year of 633,000 metric tons if this procurement were done with low-carbon materials.
To realize these benefits, new procurement guidelines will be needed. The Embodied Energy Task Group acknowledges that current procurement guidelines for construction projects already consider cost, strength and durability of materials, and a host of other attributes beyond environmental sustainability. Embodied CO2 would become another dimension to procurement decisions, but perhaps not for all projects, or even in a complete way. Small projects might be exempted, medium projects would be required to produce environmental product declarations (EPDs), and large projects would be required to produce a full life-cycle analysis. The materials covered would include steel and concrete, as well as other standard building materials. The Embodied Energy Task Group proposes flexibility in handling these procurements, with sensitivity to regional market issues, for instance.
At least four issues are still to be decided:
- the appropriate balance between simply getting transparency in embodied CO2 emissions versus directing builders to seek out products with superior green performance;
- the appropriate balance between durability and carbon content (e.g., recycled concrete has lower carbon content but is less durable than new concrete);
- how to incentivize material salvage and reuse as a decarbonization approach, and
- messaging, particularly to GSA staff and local code officials who may need to consider trade-offs with other dimensions and other minimum standards.
The Department of Transportation administers a relatively small procurement program for road building and other construction on federal lands, but the bulk of its procurement activities are devolved to the states through the award of road building and mass transit funds from the Highway Trust Fund. The Federal Highway Administration (FHWA) administers this program ($46 billion in grants in 2017). This section benefitted from discussion with Heather Dylla, Sustainable Pavement Engineer, PhD. FHWA Office of Preconstruction, Construction, and Pavement. FHWA has a sustainable pavement program and was in the process of developing guidance to the states to have their bidders use EPDs for cement and asphalt to estimate the emissions associated with a project's carbon embodied in the building materials. States ultimately decide on the specific procedures for EPD use and the way in which bids are compared across all of a bid's attributes. FHWA is currently working with Caltrans and other stakeholders to develop state procurement procedures accounting for carbon footprints for pavement in road building as part of California's Buy Clean program.
An interesting element of road building is the distinction between operational and embodied carbon emissions. Operational emissions arise from road design elements, which include attributes of the pavement—its durability and longevity, among many—that through maintenance activities and their frequency and extensiveness can affect traffic congestion, which affects carbon emissions from vehicle exhausts. Thus, even current bids and award decisions indirectly account for operational emissions. What remains are rules and procedures to account for carbon embodied in road building materials.
Comparison of federal agency performance. The Office of Federal Sustainability, part of the Council on Environmental Quality in the Executive Office of the President, “coordinates policy to promote energy and environmental sustainability across federal government operations.” https://www.sustainability.gov/index.html As part of this effort, federal agencies are required to develop sustainability reports and implementation plans, which are used by the Office of Management and Budget to develop a scorecard for each agency each year. These scorecards include two data points relevant for green procurement: the number of applicable contract actions with sustainability clauses, and the value of applicable contract actions with sustainability clauses.
Figure 7 tracks performance for 2019 using those two metrics. Note the log scale for the number and value ($millions) of contracts. The log scale is needed because DOD does so much more sustainability contracting than other agencies. The Department of Energy (DOE) has the fewest sustainability contracts but the highest value, indicating higher value per contract. https://ctsedwweb.ee.doe.gov/Annual/Report/HistoricalFederalEnergyConsumptionDataByAgencyAndEnergyTypeFY1975ToPresent.aspx
Figure 7. Federal Agencies’ Green Procurement, 2019

Figure 8. Percentage Change in Federal Agencies’ Green Procurement, 2017–18 and 2018–19
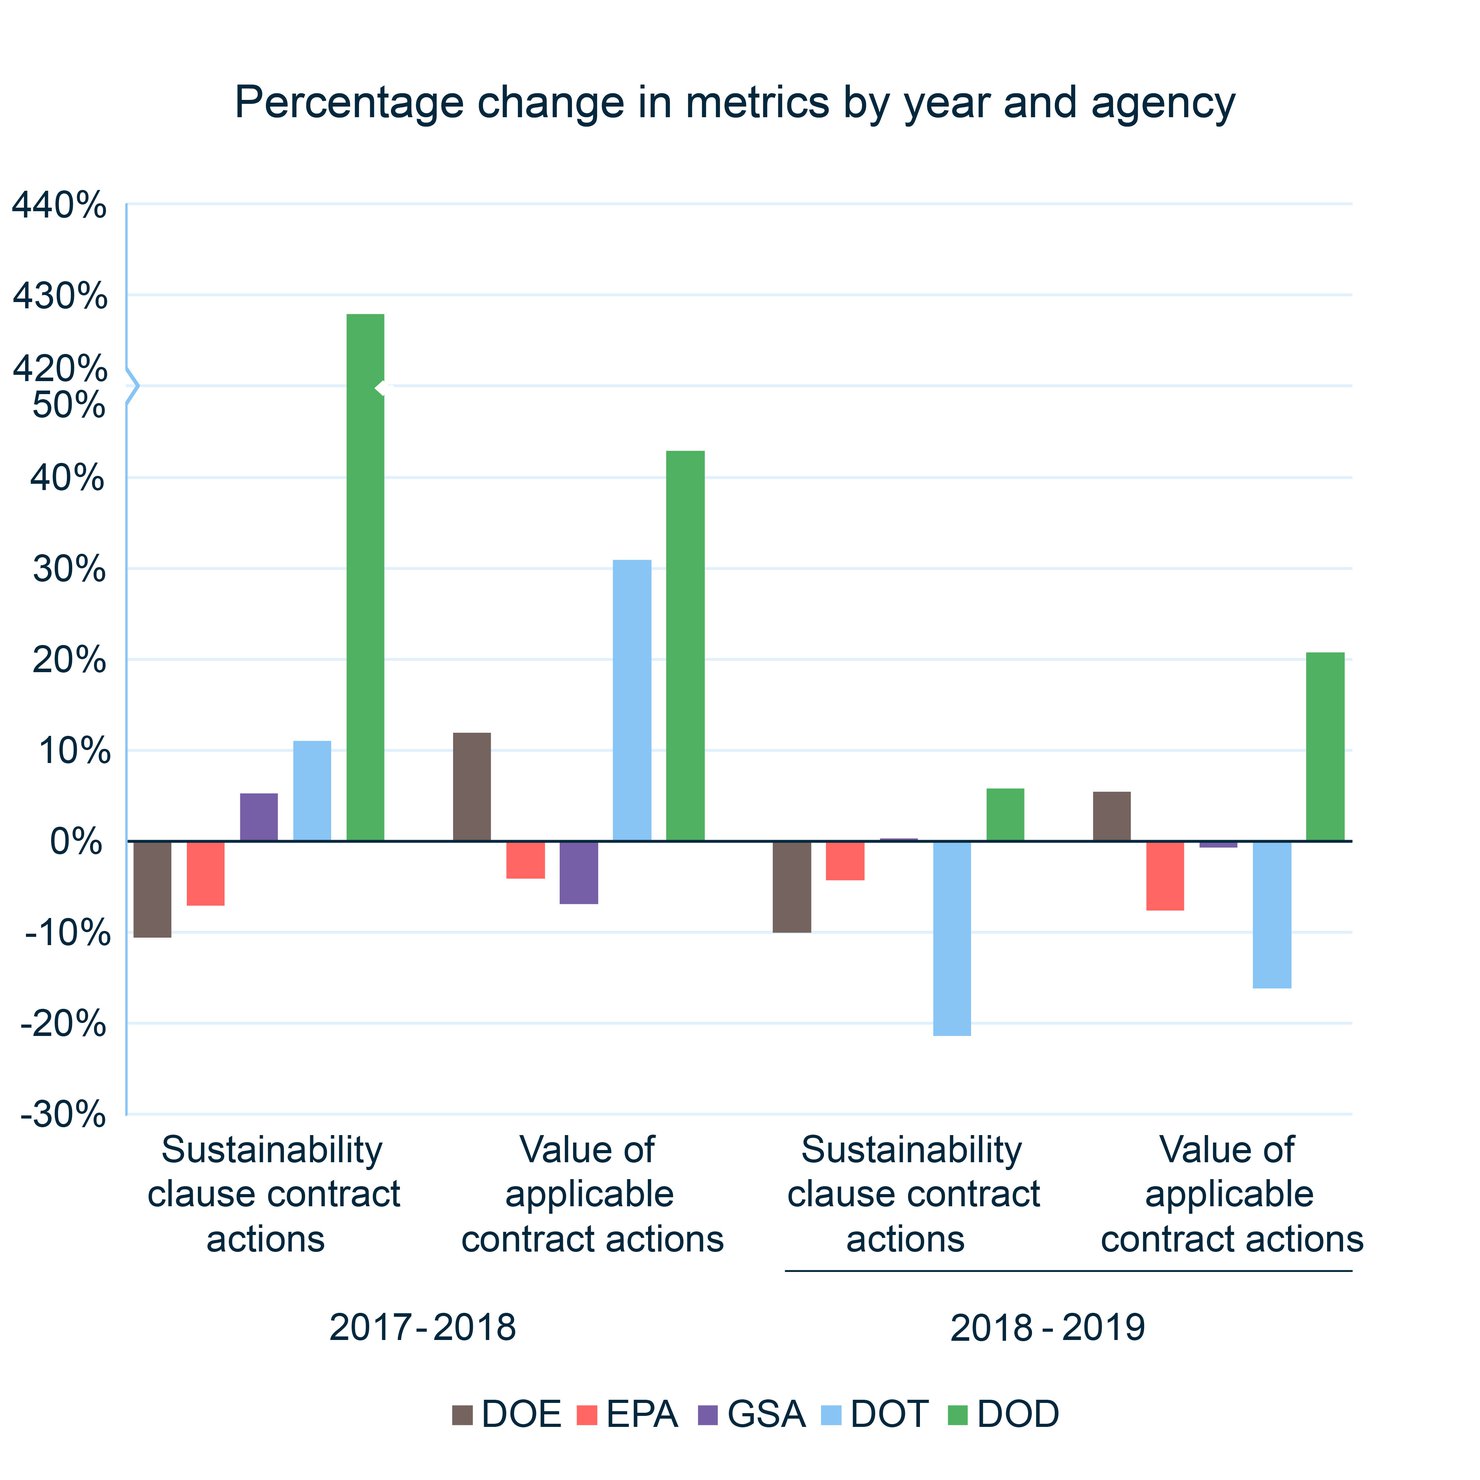
More telling is how these agencies have performed over time. Figure 8 gives the percentage change in the two indicators for 2017–2018 and 2018–2019 for five agencies. The broken y-axis accommodates the huge uptick in sustainability contracts let by DOD from 2017 to 2018. Other than that, in the 2018– 2019 period, three of the five agencies had fewer contracts with sustainability clauses in 2019 than in 2018; one showed no change and only DOD had more. Over the same period, the value of these contracts fell for EPA, GSA, and the Department of Transportation (two of the same that had fewer contracts). Again, DOD was the standout for growth. But perhaps this snapshot is unfair, going back to the 2017 to 2018 periods, EPA again saw diminished activity and value, with fewer contract actions for DOE as well, and lower aggregate value by GSA. But otherwise the activities increased over 2017. Again, it is only DOD that shows sustained growth over the 2017–2019 period.
House Select Committee report on future initiatives. A recent report by the House Select Committee on the Climate Crisis (2020) lays out a blueprint for how the federal government under Democratic leadership will address this issue and encourage companies to innovate.
The report advances a long list of recommendations for reducing emissions from natural gas, cement, steel, and other commodities by using a variety of tools—green procurement, tax credits, tradable performance standards, CO2 taxes, and research, development, and demonstration funding—as well as through creating markets for green versions of many products (with certification and auditing programs). The report references the Energy and Commerce Committee’s discussion draft of the CLEAN Future Act, https://energycommerce.house.gov/newsroom/press-releases/ec-leaders-release-draft-clean-future-act-legislative-text-to-achieve-a-100 which creates a federal Buy Clean Program to “steadily reduce the quantity of embodied carbon emissions of construction materials and products and promote the use of clean construction materials and products, in projects supported by Federal funds.”
The report’s recommendation for green procurement reads,
"Congress should direct EPA, working with DOE and [National Institute of Standards and Technology] as technical partners, to establish a Buy Clean Program for federal procurement and projects supported by federal funds that (1) sets maximum emissions intensity benchmarks for procurement of all steel, concrete, and other emissions-intensive goods and (2) requires a portion of procurement to support innovative low emission materials …. Congress should also set these benchmarks at levels that most domestic manufacturers can meet with available technologies but cut out dirtier goods. The benchmarks should also increase in stringency … "
The report considers point awards to bids for superior performance projects. It also wants the benchmarks based on a new database of EPDs, building on ENERGY STAR data and programs and standardized life-cycle emissions accounting. Certifications for clean products would be developed by EPA. These Buy Clean programs would also take into account job creation, fair labor practices, environmental justice, and other nonenvironmental attributes.
Proposed federal legislation. H.R. 7399, the Smarter Purchasing Act (Draft), https://www.fedcenter.gov/Articles/index.cfm?id=35767 opens up the possibility of having federal green procurement programs incorporate a shadow price of carbon into purchasing decisions. The bill directs EPA to conduct feasibility studies for this idea. Early in 2020, the House Energy and Commerce Committee also released the text of a draft bill, The CLEAN Future Act, which has a section on green procurement. It would create an EPA-led federal "buy clean" program to support purchase of low embodied carbon construction materials.
3.3. State and Local Programs
Many states have green procurement programs, but the one most relevant to this paper is California’s Buy Clean program. https://leginfo.legislature.ca.gov/faces/billTextClient.xhtml?bill_id=201920200AB966
California Buy Clean. Signed into law in October 2017, the Buy Clean California Act (AB262, modified by AB1817) created a green procurement program for infrastructure materials, including steel products (structural steel: hot-rolled sections, hollow structural sections, and plate), concrete-reinforcing steel, flat glass, and mineral wool board insulation. Global warming potential (GWP) standards are set at the industry average (plus a tolerance for uncertainty). Winning bidders must prove, through the submission of facility-specific, independently certified EPDs, that their products meet or beat the standard. The program phases in, with the standards published by January 2021 and compliance required by July 2021. Given California’s $10 billion annual procurement budget and its historical leadership in addressing GHGs, this legislation could have outsized effects on the markets for these products and the design of other state procurement programs. Already, a bill in the state legislature would extend the list of products to cement. From the available documentation, the extent to which GWP standards will include life-cycle emissions is unclear. Emissions from steel fabricators are excluded, however. AB966, which adds cement to the Buy Clean program, requires only that bidders supply EPDs, and only for projects exceeding a minimum threshold for cement purchased; small producers are exempt.
Proposed state legislation. Before the New York State Assembly is a legislative proposal that would apply directly to cement. The Low Embodied Carbon Concrete Act https://nyassembly.gov/leg/?default_fld=&leg_video=&bn=A08617&term=0&Summary=Y&Text=Y. See also https://ogs.ny.gov/system/files/documents/2019/03/greenpurchasingintroduction.pdf. would give concrete suppliers a price discount in bid evaluations by any state body of up to 5 percent if they certify low GWP in their EPDs.
Local potential. Collectively, local governments purchase nearly $2 trillion of goods annually, so they have the ability to move markets. Based on a representative survey of directors from 460 cities, 28 percent have green purchasing policies, although their self-evaluated success was mixed (Darnell et al. 2017). At the lowest government level, as of 2017, 270 mayors have affirmed their continued commitment to reducing GHG emissions (Darnell et al. 2017).
4. Goals for Green Public Procurement
In our review of EU and US programs, we find many goals ascribed to GPP—some complementary, some conflicting. These are listed below with commentary.
Greening the government. To the extent a government agency purchases green products, it can tout this achievement, raising its own status with certain groups and its employees. For some governments, this goal may be enough and it certainly is demonstrably achievable.
Stimulating demand. This is an oft-stated goal but not an end unto itself. Depending on the type of product and its characteristics, as well as the size of the agency implementing the GPP, demand for the green products will be stimulated. Obviously, a national government can shift demand for a product more than a local government, other things equal. And federal governments have specialized demands that most local governments do not, such as for military tanks and aircraft carriers. But just because a locality has a small procurement budget doesn’t mean its demand can’t move a market. Products with high transport costs tend to have localized markets. Thus, gauging how much demand can be stimulated requires defining the market geographically and considering both the size of the market and the size of government’s demand relative to the total demand.
Figure 9 shows what this means precisely. There is a market for natural gas with supply (S) and demand (D), as shown in the left-most graph, with price PT and quantity QT. Imagine that this market has become segmented into a green gas market and the traditional gas market, here termed “brown.” The green market is depicted in the next graph and the brown market in the rightmost graph. The price for green gas exceeds the previous equilibrium price. Note that because some demand has left the brown gas market, the price of brown gas has fallen below the former equilibrium price. Now, a large government entity, such as California or the federal government, decides to purchase green gas. Let us assume that the market is functioning. This new demand shifts the green demand curve out (D1) and the brown demand curve back to (D2), widening the spread between PG and PB (the arrows). These effects may be all that happens. But it is possible that new green suppliers enter the green market, shifting the supply curve to the right (S1) and moderating the price increase (the dotted horizontal line). In addition, if this boost in price stimulates innovation and lowers costs from economies of scale or for other reasons, the supply curve would shift rightward (to S2) and perhaps flatten, further contributing to lowering the price premium (the dashed horizontal line). But ultimately, what happens to green and brown prices depends on the size of the demand and supply shifts and the underlying demand and supply elasticities represented by these curves. Note that a crowding-out effect is possible, where this wedge between prices in the two markets leads to greater sales of the brown products (not shown).
Figure 9. Markets for Green and Brown Commodities

Promoting market certification. Few governments would make this its sole purpose for the program. Nevertheless, certification programs that permit governments to identify green products to procure are an essential requirement of any GPP. Often, certification programs come before procurement, in the sense that the government references a certification program as a guide to purchasing green products it covers.
But voluntary certification programs may well arise because of a lack of government policy in an area, in anticipation of a government program, or to improve on existing certification efforts. Governments may well consider the development of certification a successful element of their program. At the same time, governments recognize
the spillover effects of such information The National Institute of Standards, the National Technology Transfer and Advancement Act, and OMB Circular A119 actually encourage feds to use outside conformity assess-ment bodies to save government resources and be more efficient. See https://www.nist.gov/topics/conformity-assessment and https://www.nist.gov/publications/abcs-conformity-assessment for society in general. A GPP may require appliance manufacturers to develop a certification program if they want to supply green products, or engage in consensus processes or more ahead with their own certification activities. Then the popularization of that program helps interested consumers distinguish energy-efficient products from apparently identical but less efficient counterparts.
Encouraging economic development. Governments at all levels seek to promote economic health in their jurisdictions. Thus, a legitimate role of government is to help its local industry grow and become more competitive with producers elsewhere, even internationally. One approach is to recognize that low-carbon products are the wave of the future and use the power of the public purse to bolster local producers. Of course, procurement could be used to purchase brown products just as well.
The remaining goals are all part of affecting environmental policy. Governments are charged with improving their constituents’ quality of life. Regarding green product purchasing, the relevant aspects of quality of life include cleaner production processes, more recycling, efficient use of energy, and other features that safeguard environmental and human health. The scope of that charge should logically reflect the scope of the externalities governments are attempting to address. Local governments would be primarily concerned about local externalities (such as those related to land use). National governments are concerned with global CO2 and national externalities, and the states focus on a geographic scope in between. Of course, in practice, there’s much overlap in authorities and responsibilities, and even some local governments take stands on climate change.
Reducing purchase costs. Many green products are available, but their use is limited by high production costs and, therefore, high price. Government procurements can help bring costs down, in several ways. The first is through economies of scale. The larger the market to be supplied, the more the costs of production can fall through the purchase of larger, more efficient capital equipment and the building of more robust supply chains. Another pathway is through learning by doing. Greater production activity can induce learning or development of more efficient production practices.
A third pathway is the spillover effect of success, where other firms enter the market and bring new ideas, creating more competition, hastening technological growth, and generating more specialization. In terms of Figure 9, all three of these factors shift the supply curve in the green market down. Lower prices for green products also save scarce government resources to attain the same level of sustainability, but this is more an ancillary effect to the main goal of improving quality of life.
Stimulating innovation. Sometimes, green products do not yet exist or are so nascent that they don’t have a ready market presence. In this case, demand stimulus can create an incentive for both development and diffusion of new technology. See Edler and Georghiou (2007) for demand-side public procurement effects on innovation. Aside from the direct effect of government demand, which shifts out the demand curve, information about that demand can serve as a demonstration effect. Potential private sources of demand can now see that the government is putting its money where its mouth is, and that these products work as intended and are worth the added cost. Closely related is the goal of “moral suasion”: the government actions build its moral authority, which makes its arguments for purchase more persuasive.
Of course, raising demand for a product, as in Figure 9, can raise its price. This can lead to a crowding-out effect, wherein government demand pushes up prices to the point where private actors have to pay too much for the greener product and so they increase their demand for the browner product. Another conflict: promoting local business may disadvantage innovation if the best innovators are not local, though a national program seems less likely than a local program to cause this problem.
5. Hypotheses About Drivers of Program Success
Given the foregoing goals, we next set out hypotheses about the factors that could lead to their achievement. In judging the success of a given green public procurement program, it is only fair to examine success relative to stated goals. But from a social welfare perspective, we want to judge whether the program is a success relative to society’s goals, which may sometimes be different from those of the agency (e.g., seeking to minimize private costs rather than social costs). Accordingly, we focus on drivers of effectiveness in terms of making a market for existing green products and in spurring innovation to develop and market new green products. Making a market includes lowering the cost of producing a product and increasing demand for that product, as well as expanding the number of suppliers in the market.
We offer eight hypotheses:
- Programs covering a large share of a market will be more effective than those covering a small share.
a. Local governments will have less effective programs than state governments, than federal government, other things equal.
b. Any product procurement where the level of the government matches the spatial extent of the market will do better than where that match doesn’t exist. - Programs for green products that already exist will be effective faster than programs requiring product innovation.
- Programs building on existing industry green performance standards will be more successful than programs where industry green standards don’t exist.
- Programs building on existing industry performance measurement protocols will be more successful than where these protocols do not exist or lack consensus.
- Programs where economic development goals align with environmental goals will be more effective than where only one of these two goals is the focus.
- Programs with very specific performance standards will do better than programs with vague performance standards or technology or other standards for which it is hard to demonstrate conformance.
- Programs setting a high bar on greenness (with a large gap between superior performance and the baseline, as well as capturing the life-cycle emissions) will be more effective in meeting those goals, assuming the industry can appropriately respond. Such goals can also be technology forcing.
- Programs with active information and communication campaigns will be more effective than those where these elements are lacking.
6. Evidence From the Empirical Literature
A large body of literature exists on how procurement policies could or do stimulate innovation. But this literature is not specific to environmental or green procurement—it looks exclusively at innovation, as opposed to including technology diffusion and cost reduction. As for directly relevant studies, many address the drivers of green procurement success conceptually rather than empirically, and others describe green procurement programs without analyzing their operation or results.
Thus, the empirical literature is limited for testing hypotheses about green procurement success and, more specifically, success in stimulating green innovation, developing new markets, reducing costs through economies of scale and learning by doing, and reducing prices by increasing market entry and competition. Indeed, every study we identified said it was the first of its kind. We conclude that this research is in its infancy. Still, this small literature reviewed below seems reasonably well done and provides insights into the success and drivers of GPP programs.
Orsatti et al. (2020) examine whether GPPs actually lead to innovation, as measured by patent activity. The study divides the United States into 722 commuting zones and relates patent activity to firms, by zone, that obtain federal funds through environmental procurement programs between 2001 and 2011. It also collects data on local labor market characteristics (dominance of blue collar, white collar for instance) to ask whether those characteristics affect innovation directly and interact with procurement. The authors find that a 1 percent increase in GPP leads to a 0.046 percent increase in the number of new green patents. Because labor force data are available only from 2005, re-estimating this relationship results in an effect of only 0.026 percent. With the presence of what is termed abstract-intensive labor force areas, the effect increases to 0.057 percent but goes to zero where nonabstract labor force characteristics dominate. One criticism of this effort is that state and local procurement programs are not captured in the analysis and, to the extent they correlate geographically with federal procurement programs, could be responsible for some or all of the observed effects.
Ghisetti (2017) relies on a survey of more than 2,000 manufacturing firms in the European Union, Switzerland, and the United States in 2015. It examines whether adoption of innovative technologies is related to participation in a government procurement program. Specifically, innovative technologies are defined as technologies that use energy and materials more efficiently and drastically reduce emissions, and participation in a procurement program is defined by a positive answer to whether the firm competed in (and in some formulations, won) a procurement tender. Unlike in Orsatti et al. (2020), the programs could be at the local, state, or federal level.
This study took many steps to identify and eliminate self-selection, endogeneity, and a host of other problems. Matching methods were used to help address these econometric issues. Ghisetti finds that the number of firms that are environmentally innovative after receiving government procurement funds is 11.1 percentage points higher than in the group that did not. These estimates are robust to many tests and correct for variation in environmental stringency over space. A limitation of the study is that the data do not shed light on the design of the public procurement instrument, which then affects how successful this instrument is in stimulating innovation (Geroski 1990).
Zipperer (2019) looks at the effect of GPP on innovation of firms in Germany (where green innovation is defined as a product or process that lowers environmental externalities). The study marries firm-level data on firms that won green procurement contracts to data from a survey asking firms about their products and process innovative behavior. Using difference-in-difference methods and many robustness checks, the authors conclude that winning a green procurement contract “triggers” a 15 percent greater probability of making environmental product innovations but has no effect on making environmental process innovations, even though the fraction of firms introducing process innovations over the study period (2008 to 2014) exceeds by a wide margin the fraction of firms making product innovations (48 versus 32 percent). No relationship is found between winning nongreen procurements and environmental innovations. Firm size and age increase environmental innovations.
In this study, cause and effect are a bit unclear: are innovative firms more successful at wining contracts, or does winning the contracts trigger innovation? The problem is that the key variables cover a relatively long period—three years—although another variable registers whether the firm ever won a GPP and also whether the firm had won a nongreen contract over the previous three years and ever. Being an innovative firm or ever winning a contract is not associated with winning a procurement contract in the three-year window, giving some credence to the trigger hypothesis.
Simcoe and Toffel (2014) limit their geography to 735 local governments in California, collecting data “by hand” on their adoption of green building procurement policies and relating those policies to private sector adoptions of LEED (Leadership in Energy and Environmental Design) certification in their jurisdictions and neighboring areas. Direct funding for government green buildings is ignored, so this paper is entirely about spillover effects to the private sector and across jurisdictions. The analysis corrects for the number of overall construction starts, demographic differences, and differences in environmental preferences, measured by several variables. The authors are also interested in whether the labor force responds to adoption of the LEED procurement policy by increasing the number of LEED-accredited professionals.
They find a 30 percent increase in LEED adoption beyond the weighted mean of 7.4 total private LEED registrations. They also find a 12 percent spillover effect on LEED registrations in neighboring cities. This measure is basically free of the direct effects of procurements for green buildings on the number of LEED registrations. In addition, the number of LEED-accredited professionals increases by 22 percent over the weighted sample mean and is statistically significant at the 10 percent level. Interestingly, they find little relationship between market size and the impact of green building procurement policy adoption. The authors also find an increase of 0.29 private LEED registrations per log-point increase in the number of LEED-accredited professionals in the surrounding cities.
Chiappinelli and Zipperer (2018) use auction theory to build a conceptual model of the effect of green procurement on procurement costs and estimate the model using data the Tenders Electronic Daily database, which contains data on public procurement contracts in the European Union from 2006 to 2016. They find that competition and price is higher when the weight given to green criteria are either very high (40 percent or more) or very low (under 15 percent). Thus, a weight in the intermediate area results in lower procurement prices because of greater competition than in the other states. With weight in that range, green procurement prices are no higher than they would be for the otherwise same “normal” products.
7. Procurement Program Evaluations
This section reviews reports on green public procurement programs.
The Climate Works study (Hasanbeigi et al. 2019) finds that the best programs result in significant reductions in embodied CO2 and identified the Netherlands program (described above), which includes procurement of cement and steel, as an exemplar. As for barriers, the report cites a lack of products to meet GPP program goals, a lack of knowledge about GPP programs, poor or no criteria, and underfunded programs. Ecolabeling and EPDs are cited as effective tools, along with life-cycle analysis. The report recommends that GPPs move away from procuring based on the lowest bid, recognizing that the social cost of a product with low embodied CO2 can be far lower than its private costs.
Bataille (2019) focuses directly on barriers to and policies for decarbonizing the cement and steel industries. Of most interest to this paper is the discussion of the role of government procurement, including content regulations (e.g., California’s AB262 for public infrastructure). The paper mentions several policy options, including minimum content regulations and preferential buying for infrastructure (i.e., materials under a certain GHG benchmark are purchased first, potentially at a higher set price for a given volume). Bataille (2019) labels the latter a material feed-in tariff, although the analogy to such tariffs for renewable energy would be apt only if the prices were set by the government, rather than the bidder.
Bataille also mentions another variant of preferential buying, “contracts for difference” (Sartor and Bataille 2019). These contracts are a government guarantee to pay a carbon price (above the existing carbon tax in the European Union) to cover any additional costs of green products and over a given period of time. The arrangement gives stability to green product sellers when carbon prices are highly variable.
Two reports by the Congressional Research Service (CRS 2010, 2015) analyze GPPs in the United States, noting information barriers to GPP success, including a lack of knowledge about the programs’ existence and purpose. The reports recommend stepped-up training and better regulations and guidelines. Another barrier is the inaccuracy of some green labels; note that ENERGY STAR and EPEAT are cited as positive examples of clear labeling.
Real and perceived high costs of green products are a third barrier. Perceived high cost barriers can be overcome by better information, according to the reports, but high actual cost differentials require innovation and longer-term, structural changes. The report also cites cost externalities and principal-agent issues as a problem. Still more barriers are market and technical uncertainties (such as demand instability), which inhibit green product development; price variations of energy and other inputs to projects for tender (such as buildings); and concerns about performance of new technologies.
According to a 2013 evaluation of EPA’s EPP program (IEC 2013), the program’s materials—contracts, policies, guidelines—were rated moderately helpful or very helpful by a majority of the purchasers who used them. The evaluation showed a spillover effect to other government entities in purchasing electronic equipment and a spillover effect to industry in inducing certification activities. The report considered drivers of (and barriers to) the program’s success, noting that actual cost was less of a barrier than perceived cost, and that standards, as a result of the consensus-building processes that led to them, were not sufficiently stringent to be termed “leadership” standards.
8. Green Public Procurement for Three Major Commodities
In this section, the markets for natural gas, cement, and iron and steel are described, as well as emerging and existing procurement policies for these sectors, all with an eye toward the ingredients that would yield a successful GPP. The discussion is informed by interviews with trade association representatives.
8.1. Natural Gas
US consumption of natural gas is about 30 trillion cubic feet (tcf) per year, most of it domestically produced. Production is larger, at 35 tcf, the difference going for pipeline export to Mexico and Canada and liquefied natural gas export to countries around the world. The United States is a net exporter of natural gas. The wholesale prices of natural gas are available at “hubs” around the country. The main hub is called the Henry Hub, but the many regional hubs suggest that the market is geographically segmented to an extent. The current Henry Hub price is $2.75 per mmbtu, and the market for domestic natural gas is about $80 billion per year.
Natural gas can be divided into four major categories: dry gas (natural gas that is primarily methane with small amounts of ethane and propane), wet gas (natural gas with substantial amounts of ethane, propane, butane, and higher alkanes, which are sold separately), gas associated with coal beds (predominantly methane), and associated gas (natural gas produced concurrently with crude oil). Fracking dominates technology for completing a well in three of the above settings, coal bed methane being the exception.
Natural gas, oil, and coal bed methane plays are found in many parts of the country. Dry and wet gas comes primarily from the Marcellus and Utica shale plays in Pennsylvania and neighboring states, as well as the Gulf Coast, covering the Haynesville play, with additions from Texas (the Barnett and Eagle ford), plus the Permian and North Dakota oil fields for associated gas. Colorado has both types of plays; much of California produces conventionally drilled oil. Some 30 states contribute to natural gas production, which is notably absent in the Southeast and New England; New York has reserves that are not being exploited.
The demand for natural gas is fairly evenly distributed across residential and commercial users, electric utilities, and industry (including chemicals as feedstock and manufacturing heat and power). Transportation is a minor user of natural gas, although California trucking is a particular hotspot.
Government demand for natural gas. Overall statistics on governments’ demand for natural gas, whether directly for space heating and vehicles, or indirectly through electricity demand, are elusive. However, the federal government in 2019 used around 132 million mmBtus of energy from natural gas, with a cost of around $800 million. Electricity costs were about $4.6 billion, with about one-third of that natural gas. https://ctsedwweb.ee.doe.gov/Annual/Report/HistoricalFederalEnergyConsumption DataByAgencyAndEnergyTypeFY1975ToPresent.aspx Natural gas accounted for only 7 percent of energy use in California in 2015 (Hasanbeigi and Springer 2019).
Superior performance. The natural gas sector has long featured voluntary efforts to develop standards for superior performance. The first was One Future (2020), https://onefuture.us/ which since its formation as a coalition of companies in 2014 has sought to expand membership and meet a self-imposed goal of making methane emissions no more than 1 percent of total natural gas production across the value chain. Thus, there is already a segment of the industry (now 26 companies) committed to producing green gas (under the One Future definition). One Future was rewarded with recognition by EPA for providing a pathway to meet the Obama administration’s Methane Challenge program. https://www.epa.gov/natural-gas-star-program/methane-challenge-program Krupnick and Munnings (2020) detail all of the current efforts to build the elements of a green gas market, including standards, measurement protocols, certification processes, and auditing that could undergird a green gas procurement program.
Interestingly, although cement, iron, and steel are routinely mentioned as current or future targets of green procurement programs, natural gas never is. This omission is particularly curious (see Figure 6) because embodied CO2 from building construction is projected to be flat while CO2 from building operations is projected to increase dramatically.
Note also that although ENERGY STAR does not currently offer certifications for low energy use to produce natural gas, a program for US oil refineries recognizes the top quartile of performance as eligible for certification.
Cost. Can green natural gas actually be produced? Of course, the answer to this question depends on the definition of green. If, as in ENERGY STAR, the definition automatically applies to a quarter of the industry, then the answer is yes. Even if a superior performance benchmark is set external to industry performance, the answer is most likely yes. The industry-led coalitions, such as One Future and the Oil and Gas Climate Initiative, have already defined benchmarks without explicit reference to current performance. One oft-cited benchmark would be set such that methane emissions would be low enough to make natural gas life-cycle emissions lower than its substitute in power generation—coal. This benchmark is far higher (less stringent) than benchmarks for methane intensity set by One Future and the Oil and Gas Climate Initiative. Although the costs of developing a systematic approach to detecting, fixing, and reducing leaks and other emissions to low levels are uncertain, discussions with industry rarely cite costs as a prohibitive factor.
Product Design Ideas. The following points may be useful in designing procurement programs for natural gas:
- Unlike cement and steel, natural gas is a much more homogeneous product, so one standard of superior performance may be adequate, although without guidance from the federal government, state and local governments are likely to adopt different standards.
- Unlike for cement and steel, imports are not a significant issue, but procurement standards and industry requirements should apply equally to foreign imports and domestic production.
- Governments can look to the industry to develop ideas for superior performance standards and measurement of performance, since these activities are already well underway.
8.2. Cement This section benefited from discussions with Portland Cement Association staff.
The main product of this sector, Portland cement, is produced usually from limestone processed into quicklime, which is further processed into clinker, which when mixed with water, gravel, sand, and stone hardens into concrete. Concrete is primarily used to build roads and structures.
The US market for cement is about $12.5 billion per year, across 96 plants in 34 states (led by Texas, California, Missouri, Florida, Alabama, Michigan, and Pennsylvania). Production in 2019 was about 89 million tons. Most cement use is from domestic production, but imports make up about 15 percent of the market.
Cement is the most energy-intensive manufacturing sector by some metrics, consuming 24 tcf per $1 billion of shipments per year, although that is slated to fall to around 17 tcf by 2050 (EIA 2020).
Government demand. We found no overall estimate of government demand, either directly or embodied in products. But we can get an idea by looking at various uses of cement and government demand for those uses. For example, the United States
in effect builds about 30,000 lane-miles of highways per year. The whole interstate highway system, which is assumed to be four lanes wide and 42,500 miles long, contains 1.5 billion MT of aggregates, 35 million MT of asphalt, and 48 million MT of cement; US production in 2015 was about 83 million MT of cement.
Superior performance. The cement industry is interested in green cement to increase its climate performance. To this end, the industry is developing decarbonization goals and plans to meet them. It is also updating its industry-wide EPDs for four cement types and a lower-CO2 product, Portland limestone cement. Currently, the PCA website features a life-cycle analysis for CO2, and goals to reduce the carbon footprint of
its members are coming soon. The industry has already shifted its energy use and, by implication, its carbon emissions significantly downward over the past several decades. Preheating kilns and shortening kilns to lower fuel use have been particularly productive technical innovations. But according to PCA, the low-hanging fruit has already been picked from the industry as a whole, even though individual plants could potentially improve performance. One promising area is in blended cements, using coal ash, for example. Progress on carbon capture and sequestration could also help the cement industry.
Interviews with PCA staff reveal support for voluntary labeling programs. Indeed, PCA was named Partner of the Year by ENERGY STAR for its support in helping to develop the ENERGY STAR cement plant energy performance indicator tool and other program elements applicable to the sector. But by definition, GPP programs will divide the industry. Nevertheless, to the extent standards are performance based rather than technology based (such as the standards from ASTM), sensitive to international leakage issues, and flexible in their scoring (to recognize not only cement’s carbon footprint but also its benefits compared with its substitutes, which the industry argues should also be subject to standards), some support could be forthcoming. Another important issue is data quality, particularly when international firms are being compared with US firms on performance and the EPD systems are inconsistent. The use of models to normalize definitions and methods to develop EPDs can help here. Even with a well-developed model, such as that developed for cement firms to use in seeking an ENERGY STAR rating, large plants score more poorly than medium-size plants, all other things equal. This software problem is being addressed.
International trade associations, particularly for cement companies serving the European Union, tend to be more active in this area than their North American counterparts. An example is the Global Cement and Concrete Association. This group has issued sustainability guidelines, with key performance indicators (including CO2 emissions) to help companies benchmark their performance. Member companies (30 so far) agree to publish their performance indicators. The association also has built a network of research partnerships between the industry and academic institutions to help reduce future GHG emissions. Member companies and others that report their performance and create EPDs See North American PCR Catalog from Program Operators Consortium, https://programoperators.org/#. may have a leg up on competitors in green procurement opportunities, but not necessarily because their performance is superior.
Because EPDs are often cited as a tool for measuring performance, Anderson and Moncaster (2020) review them to examine the heterogeneity of EPDs across plants and countries and critique the information they contain. This study, the first of its kind, examines 2,281 EPDs from many countries—some country averages, some individual firms, some plants—for five product categories (cementitious materials, aggregates, specialist aggregates, admixtures, and ready-mix concrete), although most (2,041) are for ready-mix concrete from one manufacturer. The EPDs cover 306 products. A graph from this paper (Figure 10) illustrates the heterogeneity of CO2e (and other metrics) for the same product class (CEM II CEM II cements are made with a minimum of 65 percent ordinary Portland cement and other materials, such as fly ash or ground limestone.) across countries. The black dot is tons of CO2e per ton of product. It ranges from 0.5 tons per ton of product (from a Denmark company) to 0.82 tons per ton (from a UK company). Country averages are also included.
Figure 10. Emissions from Cement, as Reported in Environmental Product Declarations
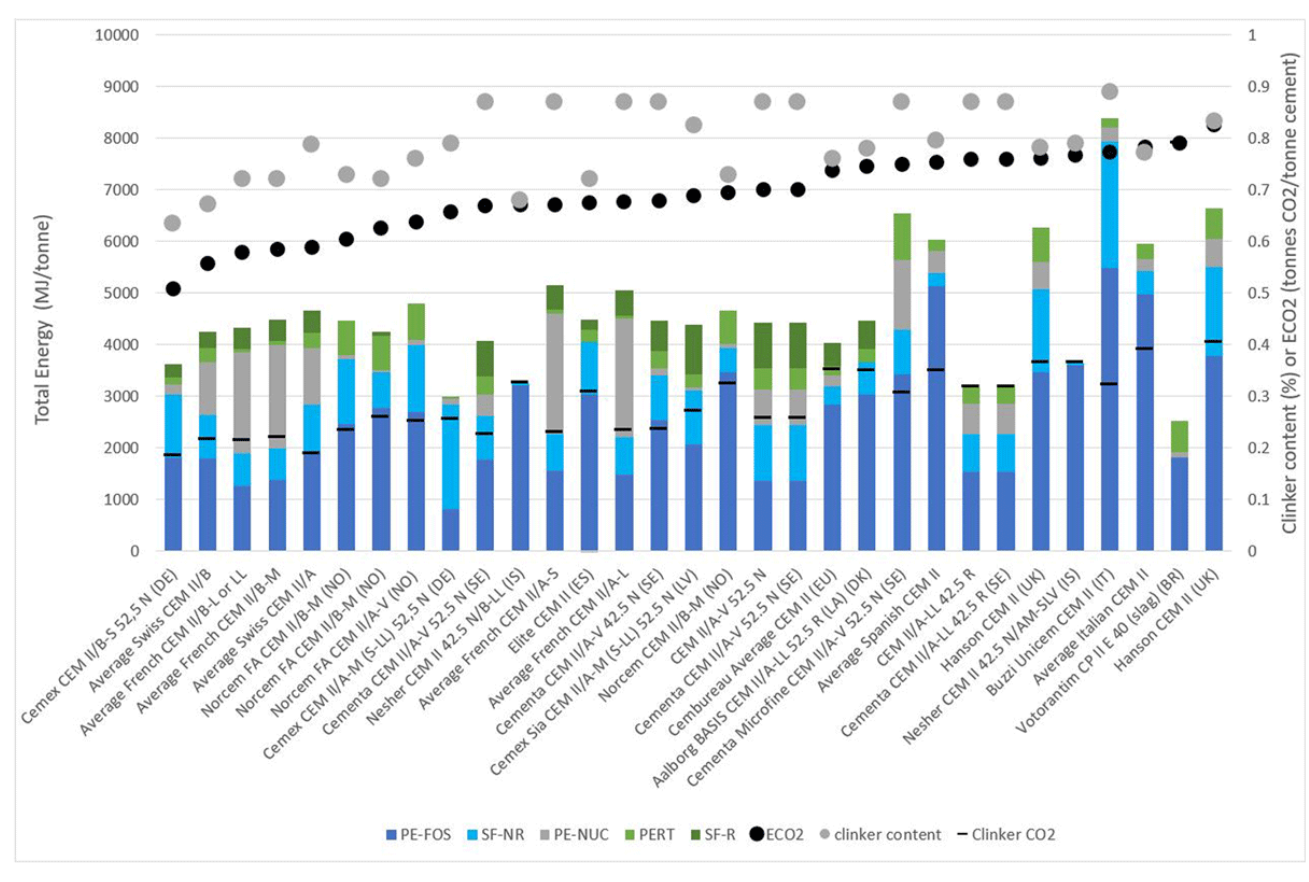
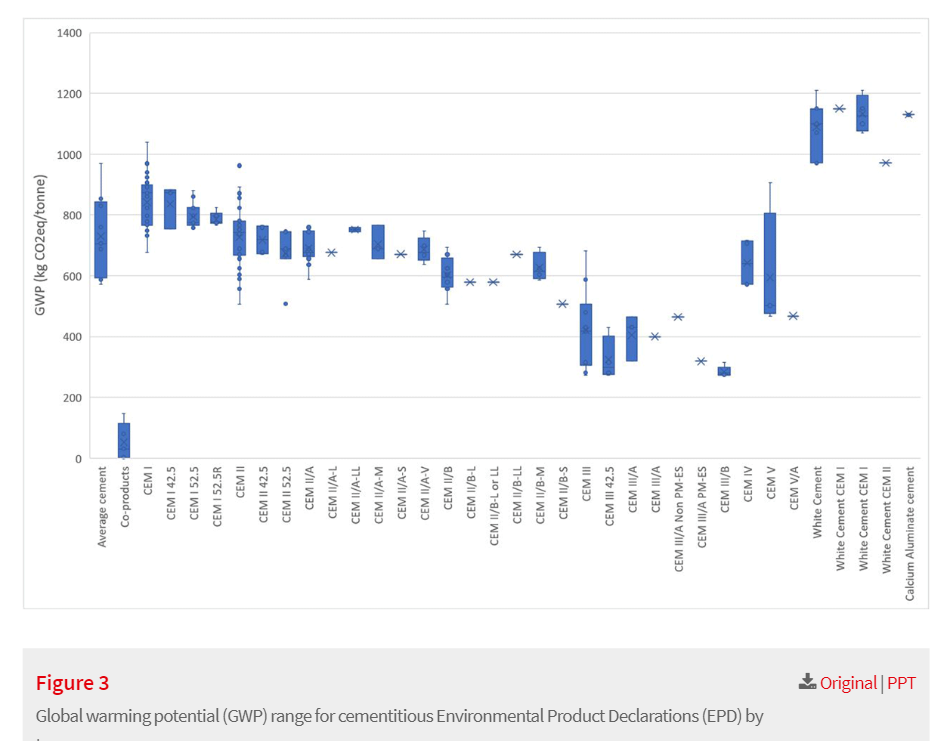
Figure 11 shows the variability of CO2e emissions across EPDs for each cement product type. Some products show large variability, others less so. An X means the number is an average. Information from this study could be used to help set superior performance standards. Anderson and Moncaster (2020) note that manufacturers can use many tools in developing their EPDs, such as the French BETie EPD tool (Potier 2012), industry association tools such as the Quantis CSI EPD Tool, https://quantis-intl.com/csi-epd-tool-cement/ developed for WBCSD CSI, and FABEKO, developed for the Norwegian Ready Mixed Concrete Association. Another EPD tool was developed by BASF for concrete suppliers to assess concretes using its admixtures (BASF 2014); other manufacturer-specific EPD tools exist as well, such as that for Tarmac (2016).
But there are caveats to the comparisons offered in the Anderson and Moncaster (2020) paper. EPDs may contain errors, use inconsistent estimation methods, and lack transparency, making the numbers difficult to compare.
Figure 11. Global Warming Potentials for Cement, as Reported in Environmental Product Declarations
Another potential source of information on industry performance to help set benchmarks is EPA’s ENERGY STAR program for industry. This program provides a tool that plants in the cement industry (and other industries) use to score plant energy performance. The ENERGY STAR plant energy performance indicator tools produce a plant’s energy performance percentile score and a measurement of a plant’s energy intensity. For cement plants, energy intensity is reported as energy consumption per ton of clinker produced. EPA sets the superior performance level at which ENERGY STAR considers awarding plant certification for energy performance at the top quartile of an industry. On the ENERGY STAR scale, this amounts to an energy performance score of 75 or higher. Those scoring 75 or higher are eligible to receive certification if they meet several other stipulations, including verification of their input data by a licensed professional engineer. The US cement industry is generally supportive of this program, according to ENERGY STAR and PCA.
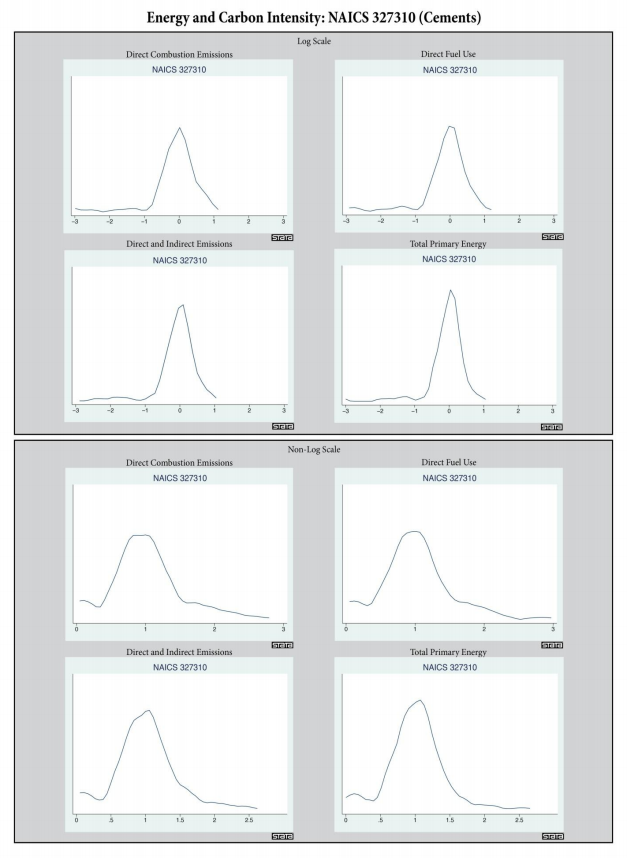
Given the close association between energy use and CO2 emissions, these curves could be translated into CO2 curves for use in assessing both low energy use and low CO2 emissions performance. This approach, however, would leave out process CO2 emissions, which are roughly the same size. Figure 12 shows how energy efficiency in the cement sector has been improving over time. Figure 13 uses more recent data and more advanced statistical analysis to derive the efficiency curve. Finally, Figure 14 provides energy and CO2 distributions by six-digit categories, based on Census data and other sources. Curves like these could be used to identify the top 25th (or any other) percentile for establishing superior performance. See also Boyd and Zhang (2013).
Figure 12. Benchmark Distributions of Energy Efficiency in Cement Manufacturing, 1997 and 2008
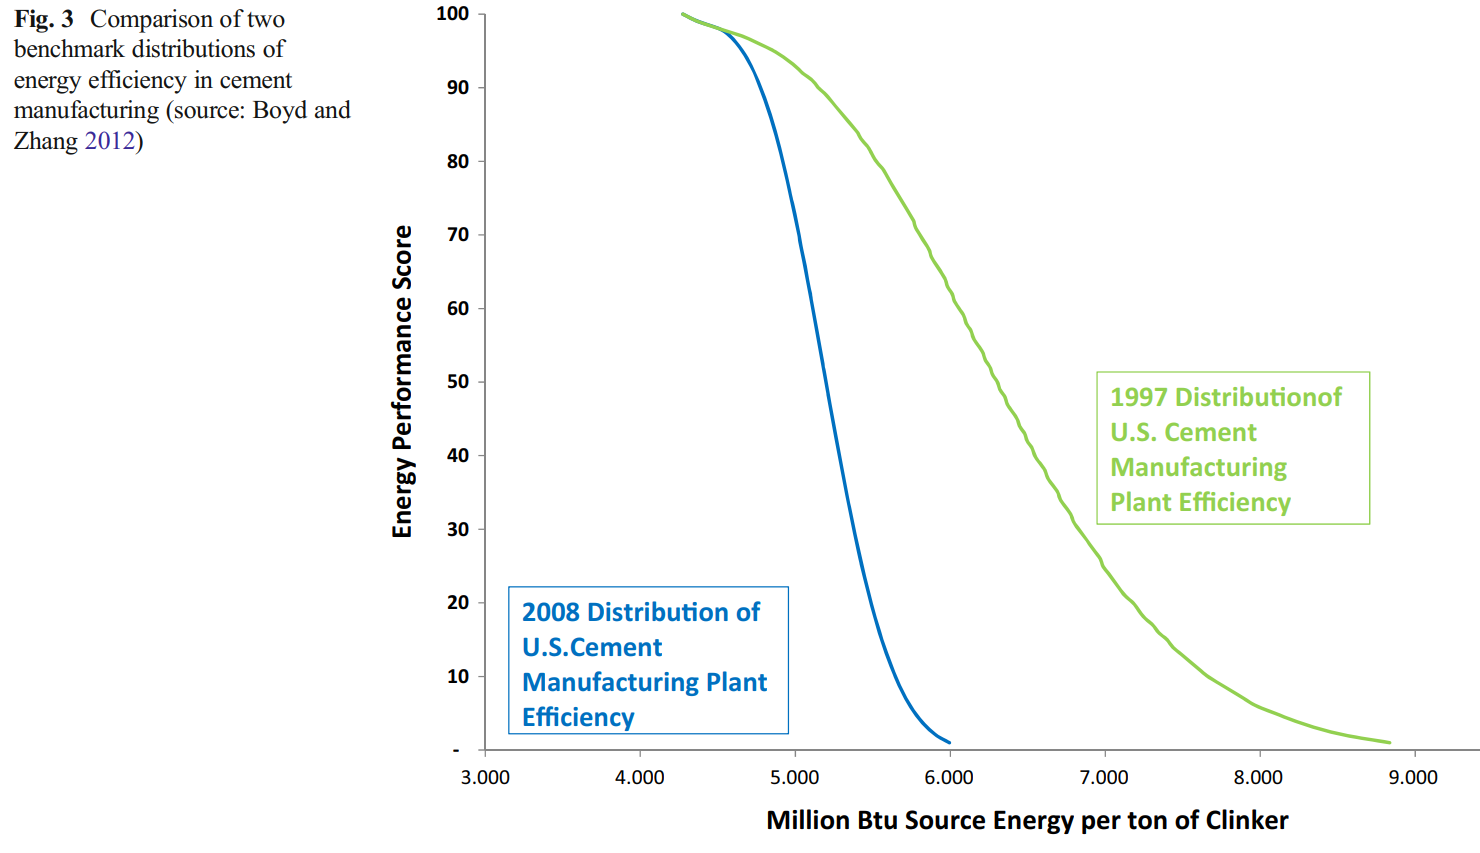
Figure 13. Energy Performance Distributions Estimated by Two Different Statistical Techniques
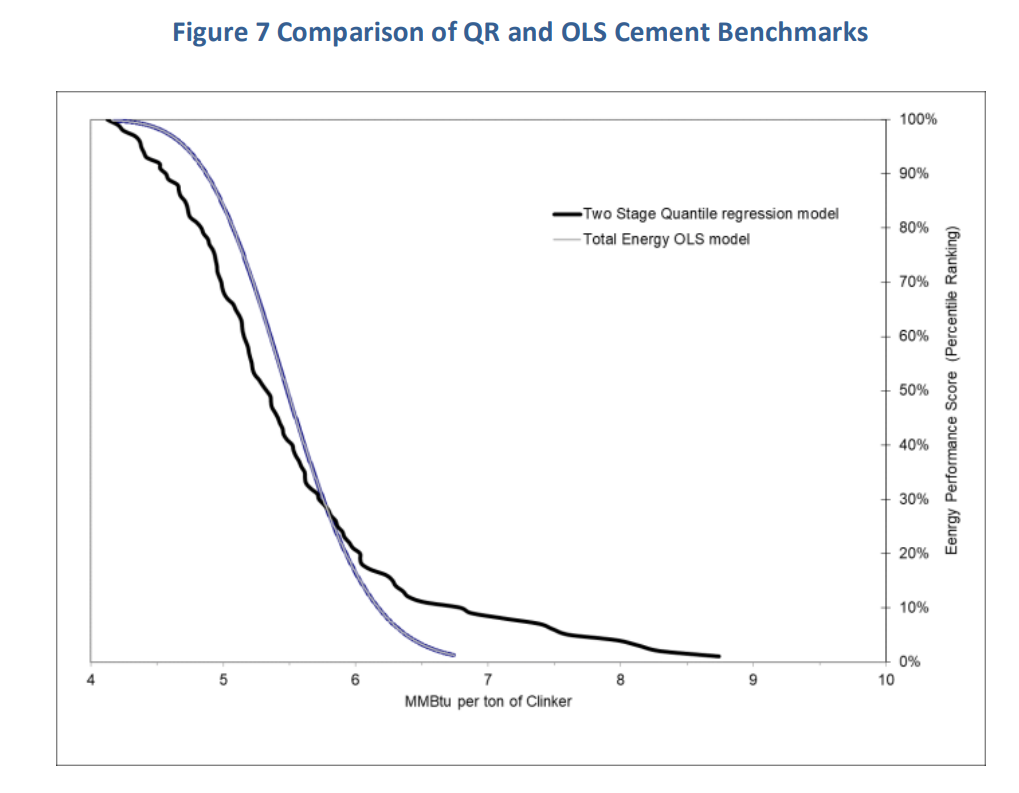
Figure 14. Energy and CO2 Emissions Distributions for Cement Sector by Log and Nonlog Scales
A final, similar graph (Figure 15) covers cement, iron and steel, and petrochemicals. These curves from Gonzales et al. (2020) are based on a study by Gray and Metcalf (2017), who combine plant-by-plant data from the Census of Manufacturers in 2012 with EPA’s greenhouse gas inventory to estimate the performance curves in CO2 per dollar of output. This metric is not ideal for comparing plant performance because product composition may differ across plants, and by this metric, those producing more highly valued products would artificially improve their CO2 performance. However, the figure is still revealing in that the cement industry has a very high degree of performance variation compared with the iron and steel sector. Again, such curves could be used to set benchmarks for green procurement purposes.
Figure 15. Emissions Intensity Distributions for Iron and Steel, Petrochemicals, and Cement Manufacturing

Cost. Can green cement actually be produced? Once again, the answer depends on the definition of green. If, as in ENERGY STAR, green is defined to characterize a quarter of the industry, then the answer is yes, by definition. But if a superior performance benchmark is to be set external to the industry performance, the answer is much less clear. Numerous studies have examined the pathways for deep decarbonization of the industry (e.g., Bataille 2019; Hasanbeigi and Springer 2019), but their costs and potential are far from certain.
Program Design Ideas. Based on discussions with PCA as well as CFHWA staff, the following design ideas seem useful:
- Develop procurement policies and procedures that are applied equally to foreign and domestic manufacturers.
- Use an EPD and life-cycle approach to measure emissions.
- Superior performance should be defined on a highly disaggregate product- and project-specific basis, since other design elements make it difficult to make apples to apples comparisons within broad product categories.
- Work with the industry in developing the above.
- Develop transparent EPD databases and tools to make it easy for bidders to comply in a harmonized bidding system, including even small scale projects and small businesses.
- Attempt to harmonize all these rules across the state programs to avoid industry being subject to 50 different rules and procedures
8.3. Iron and Steel This section benefited from discussion with AISI staff (summer 2020).
Steel is produced in two stages, by two technologies. The older and more carbon-intensive technology uses a blast furnace to heat iron ore and coke, and then various elements are added (alloyed) in a basic oxygen furnace to give the steel stiffness and durability; commonly, up to 25 percent scrap (recycled) steel is also included. The other process starts with scrap steel, as well as increasingly some virgin iron produced using the direct reduced iron method (using natural gas in the United States). Then the scrap and reduced iron is melted and alloyed in an electric arc furnace. Steel is 100 percent recyclable, which means it can be recycled into the same material of the same quality again and again. https://www.steel.org/-/media/doc/steel/general/steel-sustainability-in-steelmaking-fact-sheet.ashx?la=en&hash=B6CAF09C265D5EAD06165A0D8933D-829AB1993E0
Based on US Geological Survey data, in 2019 domestic steel production was worth $92 billion and comprised 53 producers, 3 of which operate integrated mills in 9 locations; the rest operate electric arc furnace minimills in 98 locations, primarily in Alabama, Arkansas, Indiana, Illinois, Michigan, North Carolina, Ohio, Pennsylvania, South Carolina, and Texas. Production of steel was 88 million metric tons in 2019. Construction accounted for 44 percent of production. Imports added 27 million metric tons to
US supply, with 7 million metric tons of exports in 2019. Iron and steel is the third most energy-intensive manufacturing sector, consuming about 9 tcf per $1 billion in shipments (35 percent of which is natural gas, about 14 percent electricity, and the rest coal) but slated to fall to 8 tcf by 2050 (USGS 2020).
The market for iron and steel is global, but because the products are often bulky and heavy, transportation costs are high, creating regional market prices. But there is significant international competition for all steel products. For example, imports from Mexico and Turkey compete to supply the US construction market with rebar.
Government demand. The American Iron and Steel Institute (AISI), in interviews, notes that direct government purchases of steel are small, only about 0.2 percent of total steel purchased. Expanding this estimate to attempt to capture steel content in bridges, roads, buildings, vehicles, ships, and the like, AISI estimates that government purchases account for 3.3 percent of total steel use. This estimate is derived from input-output tables.
Superior performance. Much like the cement sector, the iron and steel sector in the United States has not undertaken efforts to develop voluntary carbon intensity standards. Yet if green performance were defined using global experience, US manufacturers would look very good, primarily because 70 percent of US steel production today is based on electric arc furnace technology, which uses a lot of recycled steel; only approximately 30 percent of production today is based on blast furnace technology, which is more energy intensive. Abroad, the ratio is reversed.
Unlike the Portland Cement Association, AISI lists no specific goals for CO2 footprint reductions. But like the cement industry, iron and steel manufacturers are serviced by various companies that conduct life-cycle assessments and help companies produce EPDs. An example is SCSglobal Services (2015). Thus, companies with EPDs may be in a better competitive position in procurement bidding under GPP programs that include embodied CO2 in iron and steel, such as California’s Buy Clean Program.
Also like the cement industry, some iron and steel companies have specific goals for becoming greener. For instance, EVRAZ Steel is building a solar farm to power its electric arc furnaces. There are limits to greening the industry in the short term, however. Certain grades of steel, such as those used to make exposed automobile parts, are predominately produced in basic oxygen furnaces, although the share of automotive steel being produced in an electric arc furnace continues to increase as minimill producers expand their capabilities.
Because government procurement, whether direct or indirect, is a small percentage of steel production, a green program for steel might not have much effect in greening the industry. Nevertheless, the incentives provided, the examples set, and the learning by doing such programs might move the industry.
As for cement, requiring ENERGY STAR certification is a way to get started quickly, even though the tie between energy use and CO2 is far less than perfect. For steel, this approach would be further complicated because no companies currently are certified because they don't meet a requirement for certification related to the Clean Air Act. Alternatively, an EPD-based approach to carbon intensity procurement might be workable, but to prevent carbon leakage, the program would need to ensure that imported steel products are independently assessed in the same manner using the same product category rules as domestically produced steel products.
In parallel with the efficiency curves presented for cement, Figure 16 provides the energy efficiency distribution for iron and steel mills (Boyd 2017), and Figure 17 provides the corresponding CO2 distributions from the ENERGY STAR program (G. Boyd, pers. comm.). Curves like these could be used to identify the top 25th (or any other) percentile for establishing superior performance.
Figure 16. Efficiency Distribution for Steel Mills

Figure 17. Energy and CO2 Emissions Distribution for Iron and Steel Mills on Non-log and Log Scales

Cost. Can green iron and steel actually be produced? Again, if the definition is internally based, then the answer is yes. A superior performance benchmark set external to industry performance does not yet exist, A not-for-profit institution, ResponsibleSteel, has created some standards, a certification process and a business and stakeholder membership, largely outside the U.S. There are plans to develop a CO2 standard. See: https://www.responsiblesteel.org/ unlike for natural gas. One issue is the complexity and multidimensionality of production in the industry. For instance, Bataille C. Bataille, 2020 RFF podcast, https://www.rff.org/news/press-releases/new-episodeof-resources-radio-the-environmental-appeal-of-green-steel-with-chris-bataille/. says that recycled steel is a better bet for lower CO2 content than new steel, but as GSA argues, there may be trade-offs with durability and other attributes to the extent copper and other impurities are mixed with the steel.
Nevertheless, Bataille notes that without monetary incentives, advancing green steel beyond current practice is likely to be prohibitively expensive. “It can take 10 years for [companies] to experiment with a couple of different technologies that can cost them billions. This process, unless there is an external force feeding into driving it forward, providing funding ... it’s just really too expensive for a single firm to take on if there’s no big profit in it.” Ibid., at 21:47.
Program Design Ideas. Based on discussions with AISI, good program design should include the following:
- Performance measurements and performance standards would be developed by working in partnership with the industry. The industry should not be viewed as monolithic. For instance, the companies using electric arc furnaces, when given the opportunity, might push for setting technology standards that specify the use of such furnaces for certification.
- The standards would be highly product specific because CO2 intensity can vary greatly across products. According to AISI, the industry approves of the specificity of two categories of steel (rebar and structural steel) regulated by the California program.
- Life-cycle analysis would be required because steel doesn’t degrade and is recycled, unlike substitutes like cement and wood, particularly the latter.
- The standards should recognize that US companies are by and large cleaner than their counterparts in other countries.
9. Conclusions and Recommendations
The challenge for green procurement is that several major commodities—natural gas, cement, and iron and steel—have high GHG intensity and account for a large share of GHGs but are not typically a part of green public procurement programs. This report has reviewed green procurement programs (both nascent and ongoing), new legislative action, the academic literature, and reports from nonprofits, foundations, and government agencies. It has developed a conceptual framework for considering how the design of such programs might contribute to achieving their goals in several dimensions, used that framework to develop hypotheses about program success, and tested these propositions against academic findings and observations. This last section presents conclusions and recommendations for developing successful GPP programs for these commodities.
The section is organized around several themes: defining green, program scope, choosing winners, administrative impediments, drivers of success (market, industry, product, and program characteristics), and external drivers.
9.1. Defining Green
Which pollutants are covered and how are they measured? What standard or benchmark defines “superior performance”? How superior must performance be to qualify as green?
The pollutants targeted by green procurement programs are the greenhouse gases, including methane for natural gas, but mostly CO2 for cement, iron, and steel. Some programs also consider other emissions, such as fine particulate matter (PM2.5). We ignore this complication here to focus on the novel concerns. Measuring CO2 is relatively easy, but to measure intensity, one needs a denominator to normalize the emissions over different plants.
For cement, the ENERGY STAR program uses a metric of MMBtus per ton of clinker produced.
For iron and steel, it could be tons of production, but different products would need to be distinguished. Another metric used is tons of CO2 per dollar amount of shipments, which obviates the need for many individual product classifications but makes it difficult to compare actual performance. When plants in a sector or subsector produce the same collection of products, the latter approach is reasonable. But to the extent the product mixes are different and different products sell for very different prices, this intensity metric may unfairly advantage some plants over others.
For natural gas, methane emissions are the main concern, but measuring life-cycle emissions and accounting for superemitters present major challenges.
There are two dimensions to the type of standard. One is along the continuum of technical standards versus performance standards. A technical standard, perhaps based on ASTM, sets specific requirements on plants’ eligibility. For example, it might specify that cement be produced using a particular low-carbon process. A performance standard would directly target the pollutant but give plants flexibility in meeting the standard. For example, it might specify a maximum emissions intensity for the product. Performance standards generally result in cheaper attainment of a given emissions standard and may incentivize innovation.
The second dimension is internally versus externally generated standards. ENERGY STAR is an example of an internal standard, where industry performance is measured on a disaggregate basis and the top 25th percentile is defined as superior performance. Such a standard means that 75 percent of the industry will always be ineligible for certification, no matter how much the industry improves its overall performance, although for a procurement process, the level could be lowered to say, the 60th percentile to broaden the pool of available suppliers. An external standard would define superior performance as a particular emissions intensity and not change with improvements
in industry performance. It provides an incentive for even the poorest performers to improve, and the standard can always be raised. Of course, an external standard would be informed by data on industry performance, but not in any strict way. Note that this use of the terms internal and external is not about where the ideas, standards, or tools originate. It is strictly about whether a distribution of industry performance is estimated and used to define superior performance, or whether superior performance is defined without direct, mathematical use of a performance distribution. As noted above, superior performance in methane control has been defined in the natural gas sector but not in the other sectors.
The stringency of superior performance in the programs reviewed above ranges from the average (median) to the top 25th or even 10th percentile. Programs based on average performance or externally set benchmarks based on reasonably available technology are sometimes criticized for not pushing innovation.
Another issue is whether superior performance should be defined as one level or many levels, If a CO2 footprint were used, for instance, which doesn't actually define superior performance performance is measured as a continuum. Setting a percentile standard is a single metric for superior performance. In between, one could imagine several performance "tiers." A two-tier system, for example, would award points for good performance and more points for superior performance, Or still ore points for innovation breakthroughs. Most economists would argue that the continuous measure, like a CO2 footprint metric, is most efficient and would also stimulate innovation to reduce emissions intensity.
A final issue for defining greenness that applies to both the baseline and the standard is whether life-cycle emissions are counted. California’s program, for instance, explicitly does not count fabricator (i.e., downstream) emissions for steel and does not count upstream emissions for steel. No programs count downstream emissions—the CO2 when natural gas is burned. Because most programs that envision procuring green cement or steel are defining the commodity as the building or road or bridge, the analysis should include upstream and downstream inputs.
9.2. Defining Scope
The issue of life-cycle assessment is tied to the issue of the scope of products. One approach is to procure the green cement or steel directly; another is to design the program around green infrastructure and have bidders provide information on the greenness of infrastructure inputs. We favor the latter approach because it gives the bidder the flexibility to make trade-offs between materials with different carbon intensities and other attributes, such as cost, durability, strength, and resilience, and more closely aligns with how most procurement takes place today..
A second, related issue is consideration of substitute materials. If cement, for example, is subject to procurement standards but wood is not, wood has a competitive advantage that is not necessarily warranted based on carbon intensities. If bidders for construction must meet a performance standard for embodied CO2 in steel but aluminum is exempt, aluminum could have a cost advantage. The substitute materials might actually have a larger CO2 footprint or have other disadvantages, such as less durability or fire resistance, which lowers the social value of the project. One remedy is to write comprehensive standards for materials. Another is to require whole-structure life-cycle analyses and then put the responsibility on the bidders to develop the best mix of input materials from both a CO2 standpoint and other dimensions.
Substitution of sources is a third issue: if US government agencies have procurement standards for a commodity but trading partners have less stringent standards, then foreign suppliers might, depending on the attention paid to program differences, have a competitive advantage not necessarily based on lower carbon intensity. This situation could result in leakage of high-carbon products into the United States (without border adjustments) and cause difficulty for US firms selling abroad. Alternatively, if the importing country has such standards, the reverse would apply, in that US firms could become more competitive than foreign manufacturers not operating under those standards. Consider the situation for natural gas sold into the EU market (as liquefied natural gas). The European Union is well on its way to implementing standards on methane emissions and requiring US exporters to sell low-methane natural gas. https://www.resourcesmag.org/common-resources/future-natural-gas-balancing-economics-and-climate-change/ If the US government had a comparable requirement, it might be relatively easy for US natural gas to compete in EU markets.
9.3. Choosing Winners
Once performance has been measured and compared against the standard, how is one bid chosen over another? Here are several interesting models. One is to recognize the multi-attribute nature of commodities and add CO2 intensity to an already complicated decision process. Another is to provide numerical ratings based on performance. A third option is to price the CO2 intensity and product quantity using the social cost of carbon and add that, notionally, to the cost-based bid and make awards on the “social” costs of the project. Similarly, the monetized reduction of CO2 emissions (relative to some standard) could be subtracted from a bid to reflect it's social cost, rather than only its private costs. Yet another way is to develop whole-building metrics and compare CO2 performance on that basis. A final option is to set minimum standards for carbon performance and limit further consideration to the set of bidders meeting those standards. For example, a government agency might require ENERGY STAR certification for cement and steel makers as a proxy for CO2 emissions, and then consider only ENERGY STAR–certified bidders for the specific material inputs.
9.4. Drivers of Program Success
The drivers are divided into market, industry, product and program characteristics.
Market characteristics. Government procurement doesn’t exist in a vacuum. It reacts with all the other market demand, which, together with the suppliers, determines prices. If government demand for a product is small relative to market size, it will have less effect on changing that market (e.g., the suite of products offered, their prices) than if it is a dominant player. Markets can be regional or even local, however, so what really matters is the size of a government’s demand in the associated national, regional, or local market for a particular product.
Cement probably has the most regionalized markets because the costs of transporting it are higher relative to its product value than for either steel or natural gas. This suggests that, other things equal, local and regional governments can be more dominant in cement than in the other two markets.
Industry characteristics. Industry characteristics that may affect the success of a GPP include the rate of innovation, the commitment to greening the industry, the degree of heterogeneity in the industry in terms of cost structures, and attitudes toward innovation and greening. The less heterogeneity, the more difficult and less useful it will be to single out certain plants or companies for procurement purposes. The heterogeneity in green cement can be seen in the analysis of EPDs across plants and countries, for example.
We have seen that the iron and steel sector is more homogeneous than cement in energy use and CO2 intensity. The natural gas sector is also likely to be relatively homogeneous.
Product characteristics. Product characteristics that affect GPP success include cost differences between green and traditional products (both real and perceived), the existence of performance standards and certification processes, the availability of computer programs and other tools to measure product performance, and uncertainties about performance of new, green technologies.
The links to GPP success are obvious for these characteristics: the larger the cost differences and the greater the uncertainties about products made with new technologies, the more difficult it will be to justify green procurements. And if standards, certification processes, and measurement protocols and tools don’t exist, they have to be developed—a costly and time-consuming process that may not garner industry support. Some tools and certification processes are ready to draw on, however. The ENERGY STAR tool is well developed for cement and a few steel products. Other tools are available in the Netherlands. And firms to help companies develop EPDs are operating around the world. For natural gas, measurement protocols are an active area of industry and regulatory engagement. So perhaps developing the basis for GPP is not a huge barrier.
As for differentials in the cost of producing green products, green gas may be less costly than green iron, steel, and cement (sectors where the low-hanging fruit has already been plucked). Markets for green natural gas are gaining momentum (Krupnick and Munnings 2020) relative to those for cement, iron, and steel, yet no procurement programs appear to be in the works for natural gas, even though iron, steel, and cement are covered in some GPP programs.
Program characteristics. Probably the most important driver for GPP success is the program itself: its design, funding, industry engagement, strength of legal justification, staff, and leadership commitment. As Hasanbeigi et al. (2019) noted, the best programs have been found to reduce embodied CO2 in key commodities.
The goals of the program set its tone. Is the goal merely to increase transparency in reporting, or is it to have a measurable effect on GHGs from the natural gas, cement, and iron and steel sectors? Does the program emphasize innovation, which the academic literature confirms as a possible outcome, or is the focus more on rewarding good actors (the 25th percentile again) or improving performance but not necessarily through innovation? Does the program seek to bring down the costs of green products, or is the government willing to pay the cost differential?
How bids are evaluated is important. Is there monetization and subtraction from bids? Are index and point systems used and added to the multidimensional decision problem? Are minimum standards used (e.g., taking ENERGY STAR certification as a marker for a green product)? Adapting ENERGY STAR’s approach to cement and steel would be a quick way of undergirding a procurement program for green cement and steel. And are requirements adjusted for small projects and small businesses?
As noted above, programs that can provide bidders with tools to assess their and their suppliers’ green performance will undoubtedly do better than those without such tools.
From an environmental perspective, continuous improvement in lowering GHG emissions is highly desirable if GHG goals are to be met. This implies that benchmarks for judging which products and manufacturers qualify for GPPs should be continually tightened.
The maturity of the program is obviously important, as noted above.
Where certification programs and standards do not exist, how will they be developed? EPA’s EPP program works closely with industry and other stakeholders to develop standards and tools for gauging sector performance. ENERGY STAR even awarded recognition to PCA for collaborating to develop standards and tools for certification. It is worth noting that voluntary standards developed by industry could potentially be applied to competing imports, eliminating this future competitive concern. More generally, such standards could result in global harmonization.
The jurisdictional level of a program may be critical as well. Is there any particular reason to favor development of federal versus state and local programs? Although policymaking for reducing GHGs is a proper role for the federal government because of the global nature of the pollutant, some states and localities have developed their own programs. This raises concerns about differing programs and conflicting requirements for firms that operate at more than one government level or in more than one regional market. It follows, then, that it would be better administratively if the federal government or the government of a major state (e.g., California) set the GPP template to be adopted by other governments. And GSA can develop multiple award schedules that local and state governments could use to simplify procurement.
If the federal government has a robust program for natural gas, cement, and iron and steel, who would administer it? GSA is already being encouraged to develop guidance for cement and steel, but DOD is the greater demander and EPA’s EPP and ENERGY STAR programs have the most experience. At the same time, congressional committees and legislation describe a future federal program administered by EPA with input from the Department of Energy and the National Institute for Standards and Technology.
To reduce GHG emissions from natural gas, cement, and iron and steel will require a combination of many types of policies—a carbon tax, tax credits, research and development programs, and others. Implementation of some of these would be a heavy lift. But green public procurement policies for these three sectors would establish the foundation for bigger and broader policy initiatives, such as tackling the performance measurement issues and developing certification protocols. This paper is therefore sanguine about the benefits GPP programs could have in ushering in more rapid decarbonization in these industries. Indeed, some governments already have functional, successful programs for cement and steel. Future US programs need to be designed with as much industry cooperation as is consistent with meeting decarbonization and other goals. Their progress should be watched closely and analyzed carefully so that green procurement can be a powerful a tool for arresting climate change.
With a change to the Biden administration, the federal government can again show leadership on green procurement and address fully the CO2e implications of government procurement programs. Both Executive orders and legislation can work in a complimentary way to advance these ideas. The federal funding to state road building projects is the most obvious way of providing harmonized, well thought out programs on the procurement of green cement (and possibly steel for bridges, cement reinforcement and the like). More broadly, such programs could set an example for states to follow. California's Buy Clean program can also be an example, as well as European programs. An Executive Order, for instance, could create an interagency task force to build on and to the appropriate degree harmonize all the green procurement programs across agencies for the key materials discussed in this paper.