Prioritizing Justice in New York State Cap-Trade-and-Invest
This report, produced in partnership with the New York City Environmental Justice Alliance, analyzes the emissions effects of different cap-trade-and-invest policy designs in New York State.
For more information about this research project, click here.
Read the press release for a high-level summary, policy implications, and author perspective.
1. Introduction
New York State is currently planning for and implementing the New York Climate Leadership and Community Protection Act (CLCPA), which was passed in 2019 to promote renewable energy and battery storage, transportation electrification, building decarbonization, and climate resiliency and adaptation. The CLCPA directs the state to reduce statewide greenhouse gas (GHG) emissions by 40 percent by 2030 and 85 percent by 2050 (relative to 1990 levels)—and to achieve net-zero GHG emissions economy-wide. In meeting these targets, the state must prevent disproportionate burdens on disadvantaged communities (DACs) and prioritize GHG and copollutant reductions in DACs as defined by the Climate Justice Working Group. Additionally, Section 0117 of Article 75 of the Environmental Conservation Law, an environmental justice (EJ) provision of the CLCPA, requires that DACs receive at least 35 to 40 percent of climate investments and benefits.
The CLCPA established the Climate Action Council to develop a framework for how the state could meet the CLCPA goals and commitments. In January 2023, the Council released its final Scoping Plan, which outlined strategies to achieve the GHG and net-zero emissions targets and increase renewable energy usage. A cap-trade-and-invest program was among the strategies identified as a tool that could help the state hit its emissions targets and generate revenue for climate action and investments. The New York State cap-trade-and-invest program is intended to encourage decarbonization by capping carbon emissions, requiring emitters to purchase allowances to emit, and subsidizing (the “invest” side) the adoption of low-carbon technologies such as heat pumps.
Since early 2023, the governor and state have announced and focused on a cap-trade-and-invest program (“NYCI”) as a priority measure to reduce GHG emissions economy-wide. The state has named it the New York Cap-and-Invest or NYCI, however, regulatory agencies have expressed that there will be a form of trading so we refer to it as cap-trade-and invest to be clear about the program. Draft cap-trade-and-invest regulations are expected to be released by the Department of Environmental Conservation (DEC) and New York State Energy Research and Development Authority (NYSERDA) in mid-2024, with a public hearing and comment period to follow. As currently described by state agencies, cap-trade-and-invest will establish an auction for emissions allowances and allow entities to freely trade allowances in a secondary market, as in the economy-wide carbon cap-and-trade systems of California, Washington State, and the European Union (NYSERDA and DEC 2023). However, New York State’s cap-trade-and-invest must additionally meet the CLCPA’s explicit requirement to not disproportionately burden DACs and to prioritize emissions reductions in them. The preproposal released by NYSERDA and DEC in December 2023 offered some ideas about how the program might ensure benefits for DACs and highlighted its willingness to consider implementing facility-specific caps outside the cap-trade-and-invest program. The preproposal indicates that the caps would be administered separately under DEC and that the state is seeking additional guidance on how these caps might be implemented (NYSERDA and DEC 2023).
Our research analyzes the emissions effects of different cap-trade-and-invest policy designs at the statewide and community level Communities are defined by census tracts in this analysis. in New York. The first policy design is a traditional cap-and-trade program with full trading allowed between sectors and with no facility-specific restrictions (the full trading case, or FTC). Because of modeling constraints, we were unable to model a case with carbon allowances that can’t be traded in a secondary market, Our modeling reflects a system with a free market for allowances because obligated entities will only pay up to their marginal cost of carbon abatement for a carbon allowance. In a system without a secondary market, entities may behave differently, or some allowances may end up stranded with obligated entities that cannot use them or sell them. We cannot capture these behaviors in our models. so the second case restricts trading through facility- and sector-specific caps designed to prioritize emissions reductions in DACs and limit their pollution burden (the restricted trading case, or RTC). Both the FTC and RTC obligate the power sector and are designed with caps that assume achievement of the 40 by ‘30 target mentioned above. We do not model all sectors, so we establish an emissions budget for the modeled sectors estimated to reflect economywide reductions under the 40 by ‘30 target (40 percent below 1990 levels by 2030). See Appendix E for more detail. The preproposal analysis released by the state signaled that the electricity sector may not be obligated to purchase allowances in New York state cap-trade-and-invest program but would be covered by the Regional Greenhouse Gas Initiative. We discuss how that policy may impact the interpretation of our results in the conclusion. Our analysis assesses the two policy designs and compares them with a business-as-usual (BAU) policy case where no economy-wide carbon pricing or trading policy is implemented.
In this report, we provide GHG and copollutant emissions (fine particulate matter, PM2.5; nitrogen oxides, NOX; and sulfur dioxide, SO2) results, along with a variety of economic metrics. Air quality results, along with an additional policy case, will be forthcoming in a separate issue brief. In that analysis, we leverage a model that considers how direct emissions covered in this report combine, migrate, and settle into PM2.5 concentrations at the census tract level. The initial emissions analysis presented in this first report provides key insights on direct pollutants, particularly in the power sector, where our model provides detailed data at the latitude-longitude level about the proximity of copollutant emissions to DACs.
Our analysis has revealed several insights:
- A cap-trade-and-invest program reduces carbon emissions in all modeled sectors beyond the baseline policies included in the BAU. Implementing either modeled cap-trade-and-invest system (FTC or RTC) yields an approximately 22 percent reduction in emissions from the BAU statewide in 2030.
- At facilities within one mile of a DAC, facility-specific caps (RTC) increase the average facility direct PM2.5 emissions reductions (from 2016) by nine percentage points, from 80 to 89 percent, compared with a scenario with a cap-trade-and-invest program that doesn’t include facility-specific caps. SO2 and NOX emissions behave similarly.
- The facility-specific caps included in the RTC reduce New York direct PM2.5 emissions within a mile from DACs on net by over 44,000 pounds in 2030 (with significant reductions in SO2 and NOX emissions). The caps have virtually no impact on retail electricity prices.
- Sector-specific caps (RTC) that force greater emissions reductions in specific sectors reduce GHG emissions by 4 percent more in the residential sector (or 0.76 MMT CO2e) relative to a cap-trade-and-invest program with full trading across sectors (FTC).
- Sector-specific caps (RTC) that require fewer GHG emissions reductions in the transportation and power sectors lead to lower gasoline and residential electricity prices relative to a cap-trade-and-invest program with no sector-specific caps (FTC). Prices are lower by 10 cents per gallon and 30 cents per MWh respectively. The increase in average household heating costs is outweighed by the reduction in average household transportation costs.
Our research demonstrates that cap-trade-and-invest policy design choices can affect the distribution and cost of GHG emissions reductions. Including facility-specific caps can ensure a minimum level of reductions for each facility without driving costs significantly higher, compared with not having facility-specific caps. Additionally, sector-specific caps with no trading between sectors can help ensure a minimum level of reductions in each sector while mitigating some important household costs. Our cost findings reflect the assumption that New York State will make generous investments in electrification subsidies for households. The details of a cap-trade-and-invest program, such as those we model, will determine whether New York State simultaneously achieves its GHG emissions goals, prevents disproportionate burdens in DACs from conventional pollution emissions and concentrations, and produces revenue that can sustain and drive climate action and investments by the state. For EJ stakeholders, this research is essential because they will not support a cap-trade-and-invest system that may further harm the health and quality of life for low-income communities and communities of color, which could violate Section 7(3) of the CLCPA.
2. Relevant Research
Cap-and-trade policies, like carbon taxes, are often favored by economists because they create a price signal for emissions reductions. Through market mechanisms, low-cost carbon abatement options can be identified and adopted instead of high-cost abatement options. However, economy-wide carbon pricing policies (either cap-trade-and-invest or carbon taxes) do not equally protect all communities from the harmful impacts of polluting industries unless additional constraints are imposed. If sectors or businesses are particularly expensive to decarbonize, they will likely continue to pay the price for carbon emissions rather than reduce their polluting behavior. Moreover, if these businesses or other polluters are disproportionally located in DACs, some communities could face higher pollution burdens with a cap-trade-and-invest program in place.
Prior to release of the Climate Action Council’s Scoping Plan, some environmental and climate justice advocacy groups were calling for adoption of the Climate Community Investment Act (CCIA) over a cap-trade-and-invest system. The CCIA was a polluter fee policy that priced not only GHG emissions but also harmful copollutant emissions, based on the relative harm they posed to society (also referred to as their social cost). Revenue from the CCIA program would be intentionally invested to advance a just transition to a clean, renewable energy economy for New York State. The CCIA would have created a dedicated Climate and Community Investment Authority to administer a multi-billion-dollar program that included worker protections, investments in renewable energy, emissions reduction, infrastructure, and community-led projects across the state. Another important component of the CCIA was the Community Directed Grant Program to provide direct support to community- and constituency-based organizations, unions, and local governments, rooted in and led by DACs to further energy and resiliency planning through community-led initiatives.
Some of the consulted stakeholders, including environmental justice groups, remain skeptical that a cap-trade-and-invest system will enable New York State to hit its emissions targets and equitably distribute air quality benefits to communities of color and low-income communities (NY Renews 2023). For example, in California, the state’s Legislative Analyst’s Office’s analysis of California’s 2022 Scoping Plan Update concluded that California was not on track to meet its 2030 goals through cap-and-trade: “the program is not stringent enough … it will not drive the additional emission reductions needed to close a 2030 emissions gap. One key reason for this is because there will be more than enough allowances available for covered entities to continue to emit at levels exceeding the 2030 target” (Petek 2023). The California program allows unlimited banking of allowances from earlier years, which can then be used to comply with more strict caps in later years (Taylor 2017). Furthermore, many jurisdictions allow polluters to purchase offsets instead of allowances, which, to the extent they deliver additional emissions reductions, may provide no benefit to the community exposed to pollution. Many other aspects of these existing systems designed to reduce costs, such as free allocation to industrial polluters, border adjustments for exports, and allowance trading, can create negative, unintended effects for communities of color and low-income communities (Plummer et al. 2022; Pastor et al. 2022).
Additionally, some research raises concerns about cap-trade-and-invest programs and their impacts on DACs. Pastor et al. (2022) find that emissions at facilities near DACs have not improved at the same rate as facilities in wealthier communities under cap-and-trade in California. In fact, the research team finds that facilities near DACs often increase pollution under the policy (Pastor et al. 2022). A California state-sponsored study released in 2022 shows that some sectors, including oil refineries and cement plants, increased emissions (e.g., GHGs and PM2.5) under cap-and-trade (Plummer et al. 2022). A 2016 USC study that assessed the EJ impacts during the first compliance period (2013–14) found that although overall GHG emissions in California dropped from a peak in 2001, many industrial sectors covered under cap-and-trade reported increases in localized in-state GHG emissions after the program came into effect in 2013 (Cushing et al. 2016). The USC team updated the 2016 study and found that DACs saw some improvements in terms of reduced pollutants from cap-and-trade facilities, but these improvements were less than those in the non-DACs (Pastor et al. 2022). On the other hand, research by Hernandez-Cortes and Meng (2023), comparing cap-and-trade with an alternative scenario without the policy, estimates that the program has made progress toward closing the air quality gap between disadvantaged and advantaged communities in California. Burtraw and Roy (2023) find that although most facilities near DACs in California have kept pace with the statewide emissions reductions (because of a mix of regulatory policies and the cap-and-trade program), outliers continue to pollute at elevated levels near DACs with high population density. Their work further indicates that facility-specific caps could improve outcomes for these communities at a relatively low cost.
Environmental justice advocates prefer direct emissions reduction measures, such as stronger vehicle standards and whole-home retrofits, over market-based solutions that let polluters pay to pollute. Community advocates who have worked hard to pass the CLCPA and ensure that DACs are not disproportionately burdened by pollution and its harmful health impacts fear that a cap-and-trade system will produce the same outcomes of many previous government decisions that rely on market-based solutions, namely that wealthy communities will benefit while historically underserved and disinvested communities get left behind. Environmental justice advocates consulted in this work will support a cap-trade-and-invest program only if it addresses the historical pattern of air pollution, sickness, and environmental degradation forced on communities of color and low-income communities.
A cap-trade-and-invest system that doesn’t explicitly consider these issues could further perpetuate the cycle of disparities in which the benefits of policies and investments are realized by wealthy communities at the expense of communities of color and low-income communities that continue to face disproportionate pollution burdens. To prevent these outcomes, EJ advocates have identified policy safeguards or “guardrails” to include in a cap-trade-and-invest program that would prevent pollution hotspots and ensure equitable air quality improvements and benefits for DACs. These guardrails include sector- and facility-specific caps, strict limits on banking and borrowing, and prohibitions on allowance trading, allowance offsets, and free allocations. Many EJ stakeholders oppose trading altogether, preferring an administratively set price or a system in which all allowances must be purchased directly from the state at a market price (without a secondary trading market). We were unable to model this exact framework, so we focused on other important restrictions on trading that New York State might consider. This analysis explores some of these policy guardrails to investigate their effects on emissions, local air quality, and costs.
3. Methodology
This work represents the next phase of research established to analyze the EJ effects of CLCPA implementation. Our first report (Krupnick et al. 2023) looks broadly at program ambition in the context of CLCPA implementation and how more aggressive decarbonization policies prioritizing DACs can influence the air quality in these communities. This next iteration looks specifically at how various cap-trade-and-invest program designs affect costs, emissions, and pollution. The collaboration and research involve several models that build on each other to estimate the emissions and air quality effects of different policies.
The first step in our research is to build and compare three policy cases: a business-as-usual case, a traditional cap-trade-and-invest with full trading, and a cap-trade-and-invest with restricted trading and specific caps. We use four economic models that estimate the 2030 emission levels resulting from the different policies in each of the three cases (see Appendix A). Our Analysis includes the following sectors: electric power, light-duty vehicle market and fleet, medium- and heavy-duty vehicle market and fleet, nonmarine port activities and residential buildings.
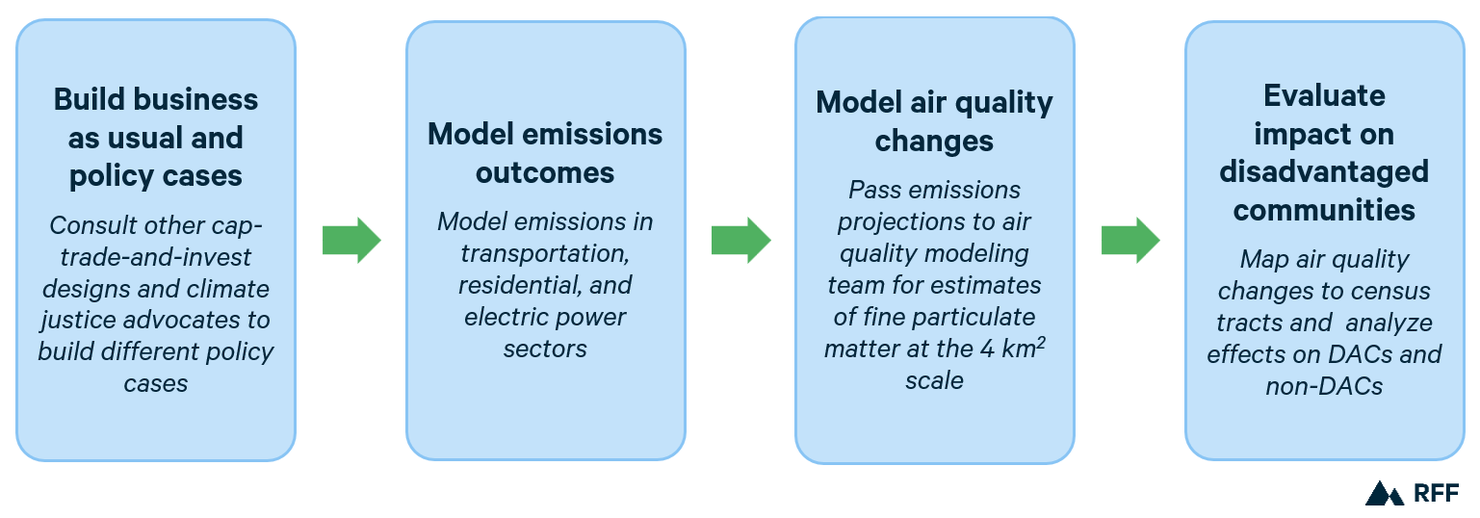
Our research collaboration will offer unique insights on air quality and community-level effects in a forthcoming report. In combination with the economic and behavioral models mentioned above, we use one of the most sophisticated air quality models available to assess and trace the community-level air quality outcomes of the policy cases, comparing DACs and non-DACs (see Appendix B for a description of the methodology for identifying these communities). Furthermore, visually mapping these results at the 4km2 scale will give readers the ability to assess and understand the geographic distribution of results and how they relate to DACs in New York State. We will cover these air quality results in a subsequent report. In this report, we focus on emissions of GHGs, NOX, SO2, and direct PM2.5. Figure 1 depicts the flow of the research process for this project.
Figure 1. Research Process
The findings from this project contribute to the body of work investigating the effects of the state’s climate policies (Krupnick 2023; E3 2022). We also acknowledge that two important limitations to our research may influence the interpretation of the results. First, our model is not a general equilibrium model designed to identify the price of carbon allowances in the economy. Our models have a good representation of each sector’s responsiveness to carbon prices, but our work is not intended to estimate the price in the state’s cap-trade-and-invest program. Second, we do not include the industrial sector in our model because our team lacks the modeling capabilities to investigate location-specific emissions reductions in this sector. We do, however, want to note that how the industrial sector is treated in the cap-trade-and-invest system is an important EJ consideration.
4. Policy Cases
We model and provide findings for the following three policy cases: (1) business-as-usual, (2) traditional cap-trade-and-invest with full trading, and (3) cap-trade-and-invest with restricted trading and specific caps on sectors and facilities. Both cap-trade-and-invest designs include generous electrification subsidies and other complementary policies to represent the “invest” aspect of the proposal in a simplified way (see Appendix F for a complete list). We focus on 2030 as the year for modeling economic activity and related air pollutant concentrations throughout New York State. Again, each cap-trade-and-invest case is designed to achieve the greenhouse gas target of 40 percent reductions from 1990 levels by 2030, as discussed further below and in Appendix E.
Our modeling begins with a business-as-usual (BAU) case, which includes the following: policies in place prior to the passage of the CLCPA; federal policies like the Inflation Reduction Act (IRA) and the Infrastructure Investment and Jobs Act (IIJA); and policies passed and implemented because of the CLCPA. This is an updated baseline case from our first round of work, which was developed prior to the passage of the IRA. The BAU in the first round of work excluded all CLCPA policies and the IRA. The BAU leverages baseline assumptions on fuel prices, population growth, and income changes as estimated by the Energy Information Administration (EIA) in the 2021 Annual Energy Outlook. We used New York–specific assumptions about transportation vehicle miles traveled and made some adjustments to our assumptions about gas supply to avoid potentially biased results. EIA limits its modeling to sets of policies (mostly federal but in some cases state) that are already in place, excluding policies that might be implemented in the future.
The next case we model is the full trading case (FTC), which reflects a traditional cap-trade-and-invest policy design without mandatory emissions reductions for specific facilities and sectors. The FTC also includes spending from the “invest” side of the policy, with subsidies for heat pumps, EVs, and fossil fuel phase outs in the building sector (see Appendix F for a complete list). The investment policies are generous, and the source funding is not limited to the revenue generated by the program. An emissions budget was set for the sectors we model based on the state’s emissions inventory and emissions reduction pathways analysis (see Appendix E for details).
Obligated entities in our sectors have full access to bid on allowances in an auction and trade among themselves until the allowances are held by entities with the highest willingness to pay. This policy case has no facility-specific or sector-specific limits on emissions. The emissions cap in the FTC for our sectors is 82.4 MMT CO2e, which reflects a 40 percent reduction from 1990 levels on an economy-wide basis (see Appendix E for full methodology), and a 22 percent reduction from the 2030 BAU (no cap-trade-and-invest policy).
The final policy case we model is the restricted trading case (RTC), where specific guardrails are implemented to prevent disproportionate pollution burdens and prioritize emissions reductions in DACs:
- facility-specific caps on power generators that force each facility to reduce emissions at the economy-wide rate (40 percent) between 1990 and 2030 Our electricity model does not have data for 1990 and uses base-year data for 2016 instead. We therefore estimate the percentage reduction required from 2016 levels to achieve a 40 percent reduction from 1990, using the statewide emissions as a benchmark for comparison of 1990 and 2016.;
- sector-specific caps that force each modeled sector to reduce emissions by a minimum amount from 1990; and
- a prohibition on trading between sectors.
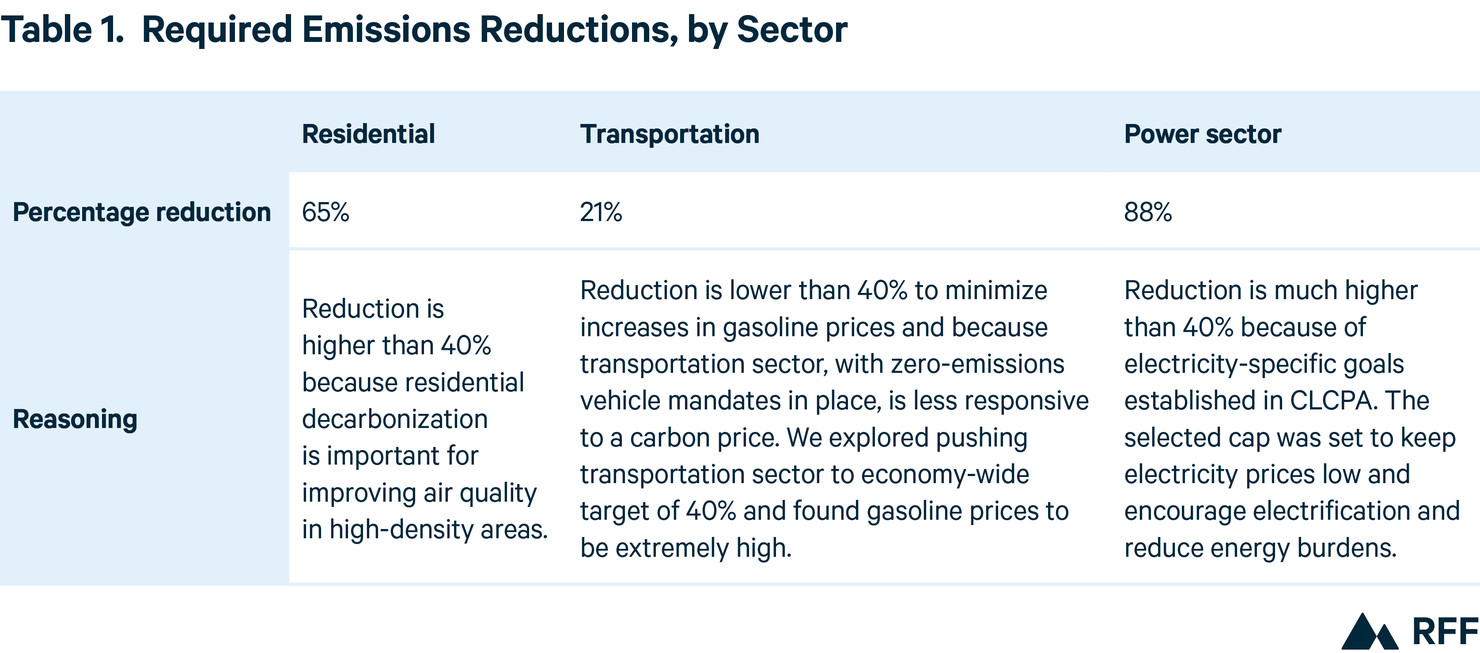
The RTC includes the same investment policies as the FTC (see Appendix F for a complete list). The total emissions budget is the same as the FTC, but the sector-specific caps lead to unique allowance prices in each sector, based on the underlying cost of mitigating CO2. Table 1 shows the required emissions reductions in each sector, and the reasoning for those caps developed in consultation with EJ stakeholders.
Several policy design elements are included in both policy cases: compliance entities cannot fulfill their obligations by purchasing offsets, and upstream methane is included in the emissions accounting for each entity. Because of modeling limitations, we could not represent carbon allowance banking, borrowing, or free allocations. Our representation in all cases implies no banking, no borrowing, and no free-allocation in our sectors. We also do not model linkage with other state cap-and-trade programs, such as those in California and Washington State, but we do include the Regional Greenhouse Gas Initiative (RGGI). We assume New York State continues to participate in the RGGI, with entities receiving credit in the NYCI program for the amount spent on RGGI allowances. We estimate demand for allowances in other sectors to establish the emissions budget for our modeled sectors. See appendices for additional detail on our methods.
Environmental justice stakeholders consulted in this research process Guidance was provided by our partners at the New York City Environmental Justice Alliance and by the NYRenews Cap and Invest Working Group. also stated a preference for prohibiting trading in a secondary allowance market and establishing a price floor to ensure that the revenue from the program is collected by the state, rather than by private entities trading allowances. Our modeling is consistent with a price floor that is at or below our model prices, and when we discuss revenue, we refer to the total amount spent on allowances. We were unable to model a framework with a market price set by auction and no allowance trading in a secondary market.
5. Results
We find that the implementation of either cap-trade-and-invest scenario in New York would significantly decrease emissions, encourage clean technology adoption, and have meaningful effects on different cost indicators, relative to the BAU case.
For the full trading case (FTC) relative to the BAU and for the restricted trading case (RTC) relative to the BAU and the FTC, we estimated changes in energy demand and technology adoption, energy prices, emissions changes in modeled sectors, and the location of emissions changes in the power sector, with a particular focus on direct PM2.5 and NOX. In an upcoming report we will discuss air quality changes associated with these results.
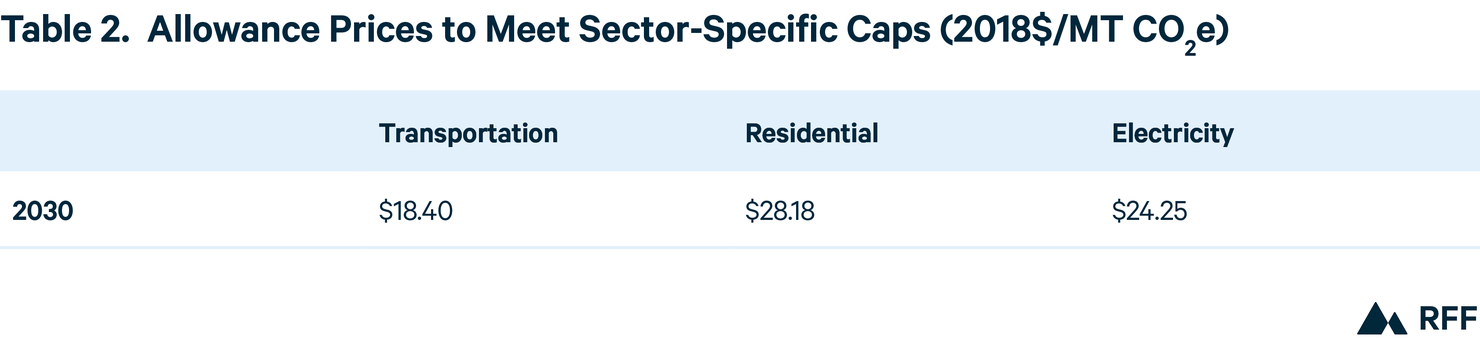
The RTC prioritizes reducing costs in the transportation sector while also ensuring minimum emissions reductions are achieved in each sector through sector-specific caps. As a result, the sectors we model face different prices for emissions. All sectors face a price of $26.50 As previously mentioned, this price is an estimate using data from our selected models. A general equilibrium model with all covered sectors included would provide a more accurate projection of the price in the carbon market. Our goal in this analysis is to test how different policy designs affect prices and emissions, not to estimate the allowance price in the NYCI program. in the FTC with full trading across sectors; Table 2 shows the prices needed to meet the sector-specific caps in the RTC in 2030. The price differences are relatively small, particularly in the residential and electricity sectors, indicating that the FTC is close to the minimum performance standards in each sector, but falls short in the residential sector specifically.
Regulations and generous subsidies (detailed in Appendix F) contribute to low prices, particularly in the residential sector.
Facility-specific caps may also impact allowance prices. Because the RTC includes both sector-specific caps and facility-specific caps, adding the facility-specific caps would only impact prices in the electricity sector. Our modeling indicates these effects would be very small. Adding facility-specific caps does not significantly alter overall demand for allowances from the power sector, and in an exploratory analysis we estimated that facility-specific caps would decrease allowance prices by less than 15 cents in the electricity sector. Without sector-specific caps, facility-specific caps in the power sector could impact economy-wide allowance prices and emissions in other sectors. Our modeling tools are limited in their ability to estimate this effect, but we discuss the information we do have on this topic in Appendix D.
We find that adding sector-specific caps (included in the RTC) changes the distribution of emissions across sectors, relative to the FTC, affecting costs and technology adoption. We find that adding facility-specific caps in the power sector (included in the RTC) changes the distribution of emissions across generators and therefore the location of pollutant emissions in the state. We discuss these findings in detail below. The state-wide emissions differences may seem modest, but the distribution of emissions is the focus of these policy guardrails and this analysis.
5.1. Behavior and Technology Change
Both implementations of cap-trade-and-invest (FTC and RTC) prompt an increase in clean electricity generation relative to the BAU, which includes IRA and IIJA incentives, the clean energy standard, and the CLCPA clean generation mandates (see above for more detail about the scenarios). Relative to the BAU, both cases deliver more solar generation (a 26 percent increase in the RTC and a 29 percent increase the FTC), 10 percent more wind generation, 1 percent less hydro, and significantly more storage used to serve electricity demand (a 53 percent increase in the RTC and a 59 percent increase in the FTC). Our model does not hinder renewable buildout in 2030 based on regulatory obstacles such as siting, permitting, and interconnection.
In residential buildings, both implementations of cap-trade-and-invest (FTC and RTC) make oil and natural gas more expensive, which encourages the transition to heat pumps. Relative to the building codes and IRA subsidies included in the BAU, the FTC and RTC both increase heat pump adoption by more than 10 percentage points. This increase in adoption is the combined effect of the carbon price and the investments included in both policy cases (see Appendix F). The subsidies included in the residential sector, which are not limited by program revenue, play a significant role in increasing heat pump adoption.
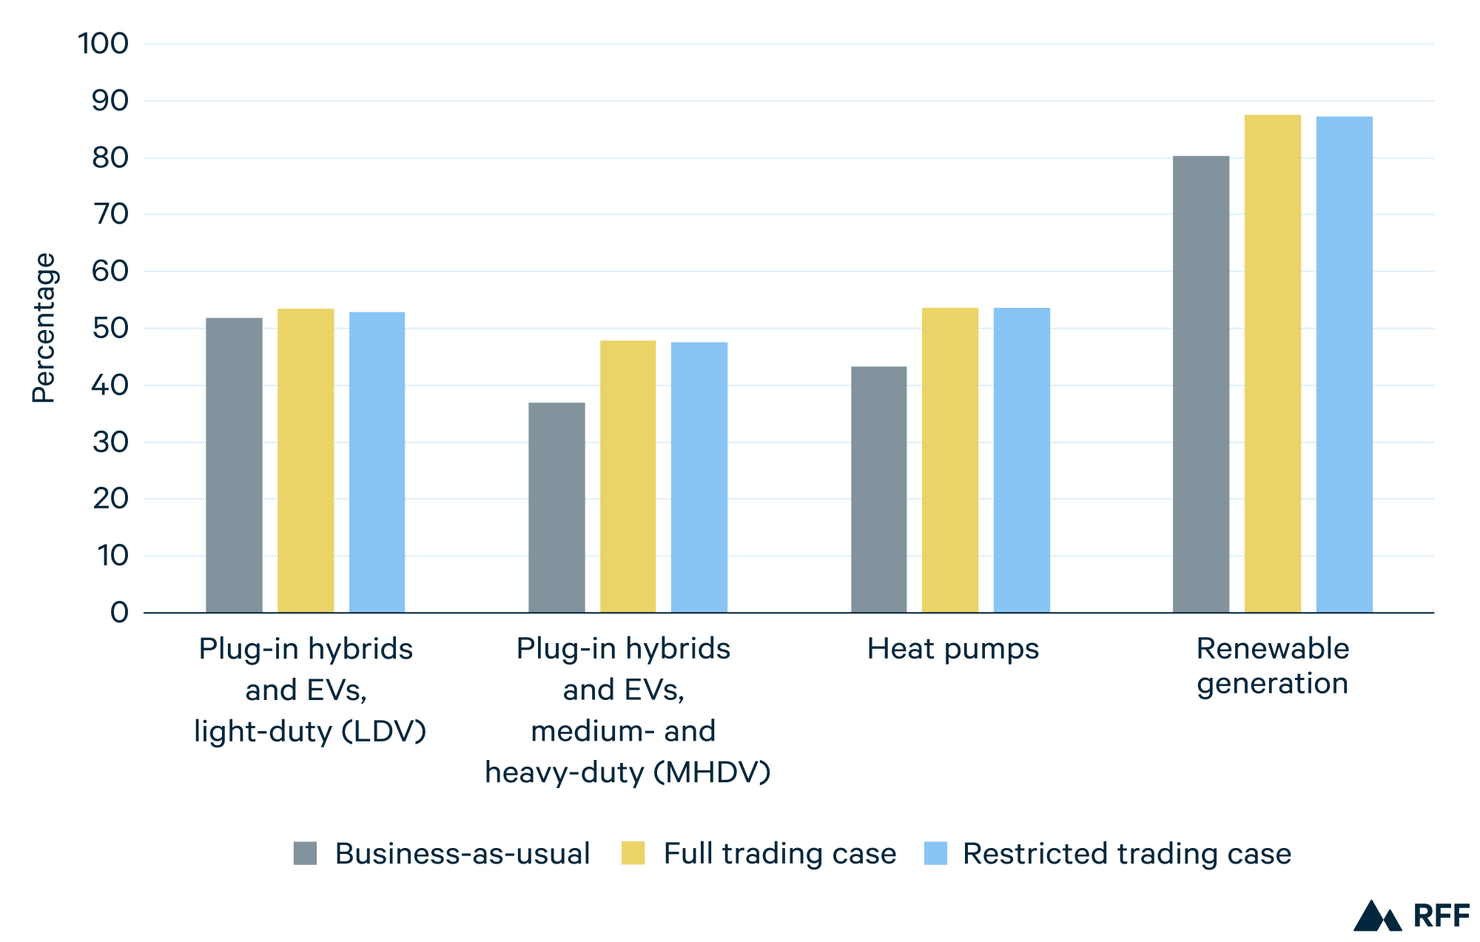
In the transportation sector, the mandate for zero-emissions vehicles (ZEVs) included in the BAU is a primary driver of the shift to cleaner vehicles and lower emissions. Both cap-trade-and-invest designs (FTC and RTC) drive some additional changes by increasing the price of fuel and the point-of-sale rebate for consumers buying new ZEVs (one of our assumed investments of cap-trade-and-invest revenue). See Appendix F for more detail on complementary policies included in our modeling, as reflections of the “invest” side of cap-trade-and-invest. Congestion pricing is not included in this modeling. Both the rebate and the increased fuel price encourage greater adoption of ZEVs. The increased fuel price also depresses auto use in favor of less costly modes of transport like transit. The slight changes in EV adoption relative to BAU (illustrated in Figure 2) demonstrate how far the ZEV mandates are pushing the transportation sector and the relatively inelastic demand for gasoline and internal combustion engine vehicles when the mandates are fulfilled.
The sector-specific caps in the RTC slightly affect the rate at which clean technologies are adopted relative to the FTC (see Figure 2). Figure 2 shows a summary of the major technologies and how their adoption rates are affected by each policy case. The RTC yields slightly greater clean technology adoption in the residential sector, specifically a 0.01 percentage point increase in heat pump penetration. The lower price in the electricity sector yields slightly lower (about 0.3 percentage points) renewable energy generation while the lower prices in the transportation sector also have a small effect (about 0.5 percentage points) on EV stock. These differences are small because the carbon prices needed to achieve the sector specific caps (RTC) do not vary widely from the price in the economy-wide cap case (FTC).
Figure 2. Technology Changes Driven by Cap-Trade-and-Invest (All Policy Cases)
5.2. Emissions
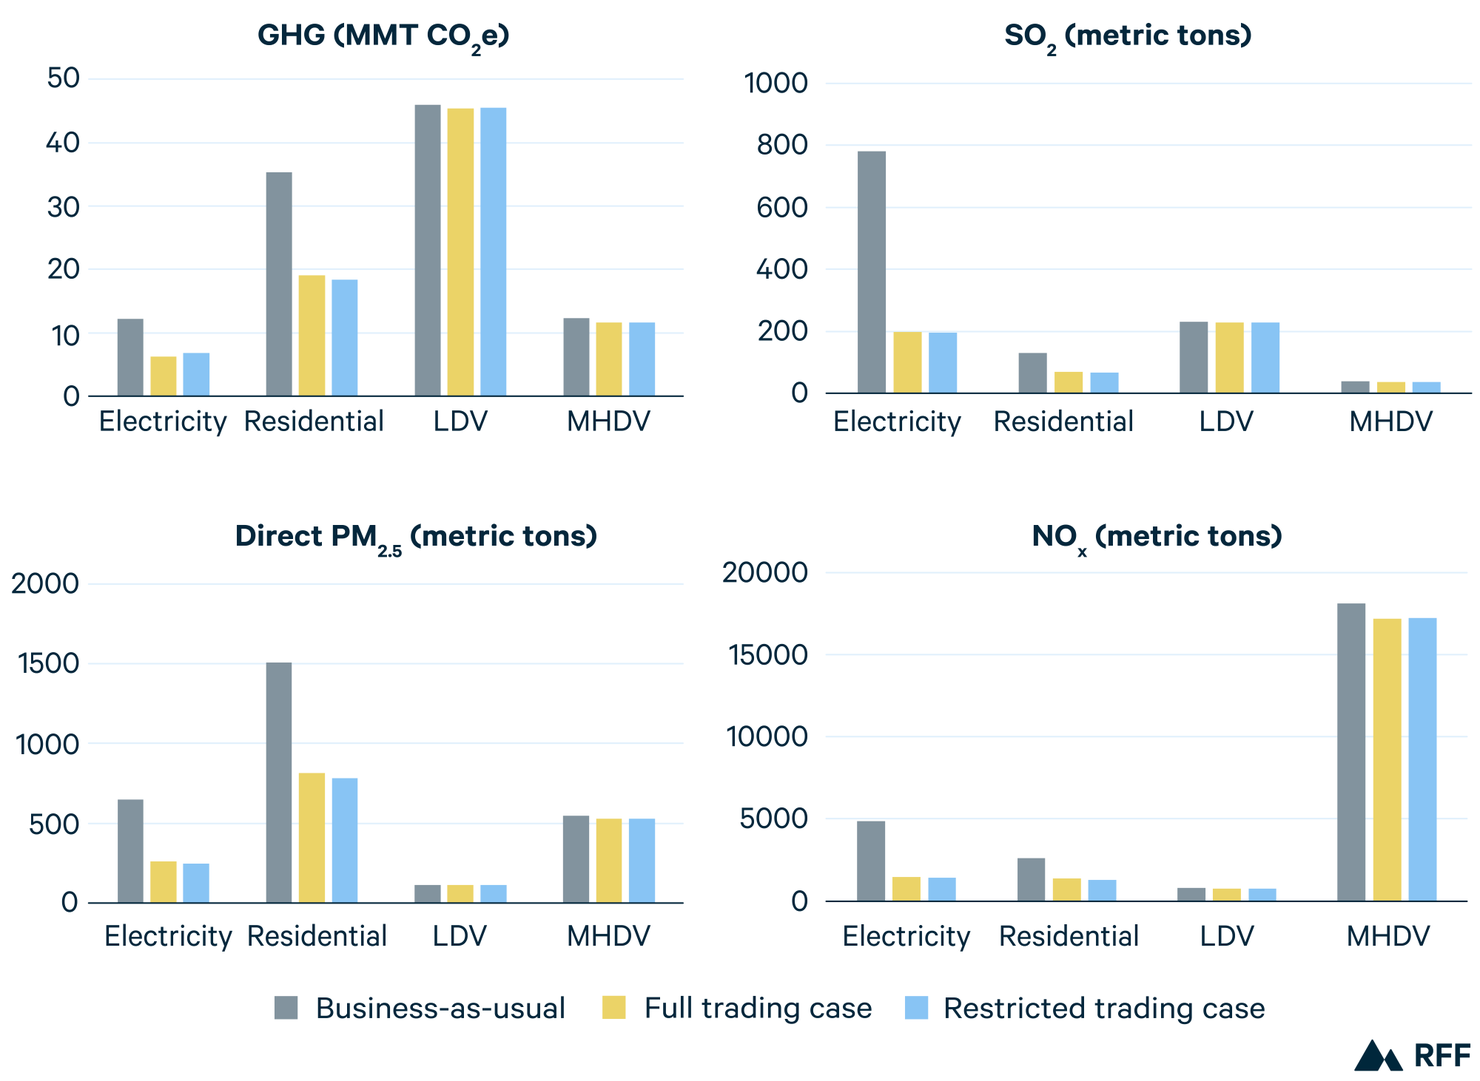
The technology adoption changes described above yield GHG emissions reductions. Both cap-trade-and-invest designs set an emissions budget according to CLCPA mandates. In both policy cases the cap is the same—40 percent below 1990 levels, which is a 22 percent reduction relative to the BAU. When allowing sectors to trade and find the least-cost reductions, as in the FTC, we see a 2 percent decrease in GHG emissions in the transportation sector, a 46 percent decrease in the residential sector, and a 48 percent decrease in the power sector, relative to the BAU. The variability in those emissions reductions reflects the sectors’ relative sensitivity to carbon pricing and the ambition of decarbonization policies included in the BAU, like the ZEV mandate, which drives transportation electrification without a carbon cap. Figure 3 summarizes the emissions reductions for all policy cases.
While the economy wide emissions reductions are fixed to meet the CLCPA mandate, the sector specific caps shift emissions reductions across sectors. The sector-specific caps in the RTC lead to 0.2 percent higher GHG emissions in the transportation sector (relative to the FTC) and about 8 percent higher CO2e emissions in the power sector to save on costs due to the lower CO2e permit price required to meet the sector specific cap. These emissions differences reflect the relative ambition of the caps in each sector, which were identified by stakeholders consulted in this process as part of a research exercise based on the estimated impact on household costs and emissions (see Table 1 for full reasoning). Sector-specific caps could be set more restrictively in any sector, but it would increase the price of allowances in that sector.
Not only do the modeled cap-trade-and-invest policy cases reduce GHG emissions, the FTC and RTC also lead to copollutant reductions. The FTC causes estimated statewide reductions below the BAU of 55, 21, and 39 percent for SO2, NOx, and direct PM2.5, respectively. The facility-specific and sectoral caps in the RTC have a greater effect on some copollutants, even though the GHG reduction targets are the same. Compared with the FTC, the RTC SO2 reductions are roughly half a percentage point greater and direct PM2.5 reductions are 2 percentage points greater. These are relatively small differences, but they highlight that copollutants reductions are not perfectly correlated with GHG reductions across all sectors, and emissions reductions in some sectors yield greater copollutant emission reductions. We will explore how this impacts air quality more in the upcoming report analyzing air quality results.
Figure 3. Emissions by Policy Case, by Sector, 2030
5.3. Prices and Revenue
Besides encouraging carbon emissions reductions and the subsidization and adoption of low-carbon technologies, cap-trade-and-invest also impacts energy and fuel prices. Table 3 shows a summary of three major household energy costs—electricity, The electricity prices in the RTC reflect the combined impacts of the lower carbon price in the sector and the facility-specific caps. gasoline for vehicles, and natural gas for home heating—under the policy scenarios compared with the BAU. We find that, relative to the FTC, the RTC delivers lower gasoline prices and slightly lower electricity prices while it pushes natural gas prices higher. This reflects the relative ambition of the sector-specific caps (see Tables 1 and 2). Our modeling shows adding electricity sector facility-specific caps to either cap-trade-and-invest policy has virtually no impact on residential electricity prices in the RTC.
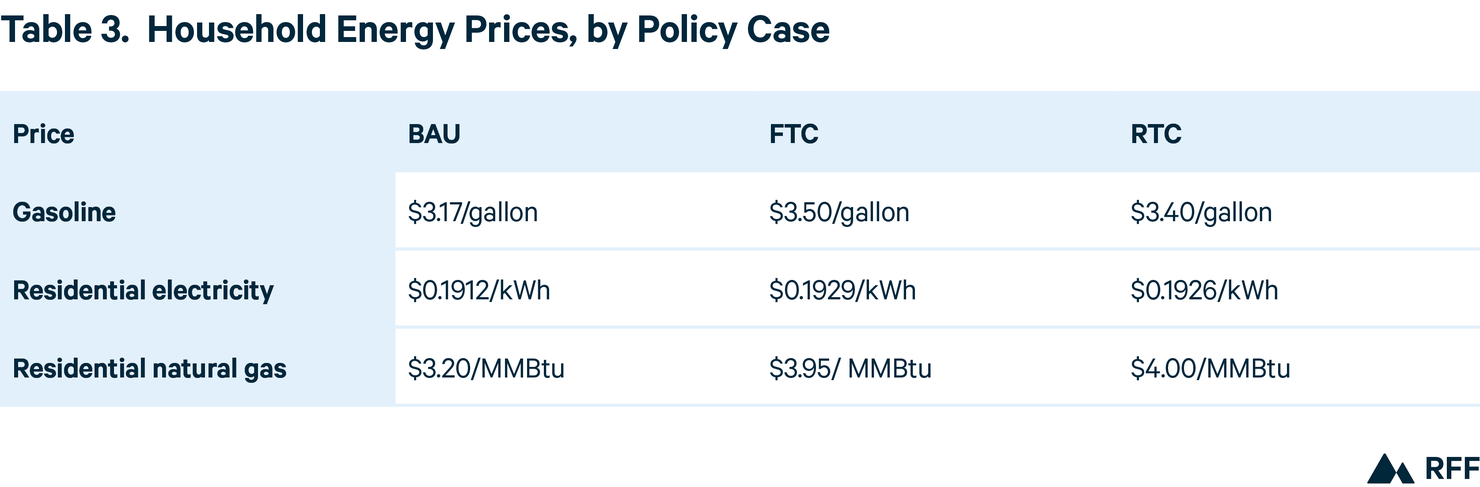
These prices, which drive household transportation and home energy costs, may have varying effects on different income groups. For the 10 regions (the residential model divides New York State into geographic groupings from the US Census called Public Use Microdata Areas, or PUMAs) with the lowest income, the combination of heat pump subsidies and increased efficiency leads to slightly lower home heating costs (less than 1 percent) for the FTC and RTC relative to BAU. For the 10 highest-income PUMAs in the state, home heating costs increase (by about 15 percent) in both the FTC and RTC because access to electrification incentives is lower for higher-income groups, leaving them more exposed to increased natural gas prices. For both income groups, the FTC presents slightly lower costs than the RTC because the sector-specific cap in the RTC drives natural gas prices higher to achieve greater emissions reductions in the sector. Exposure to the higher natural gas price is relatively low due to large investments in residential electrification.
Low-income PUMAs see a small increase in home heating costs, averaging $1.77 per household per year in the RTC compared to the FTC. For the highest-income PUMAs, home heating costs rise $3.62 per year. At the same time, the lower gas prices in the RTC would mean that the average low-income drivers would save approximately $18 dollars per year in vehicle operating costs based on average consumption. This estimate is based on the average gasoline consumption across the policy cases for the bottom 25 percent of NY households by income. The savings on transportation for households that do not own a vehicle would be less than $18 annually, though lower gas prices may affect other costs they face. Households that live in smaller homes and spend less on home heating would also be less sensitive to higher natural gas prices in the RTC. These findings indicate that adjusting sectoral ambition can yield the same overall emissions reductions while mitigating some household costs. These findings are sensitive to the level of subsidization in the sector, which affects household costs. The New York State Climate Affordability Study goes into detail about how the Consumer Climate Action Account, funded by program revenue, may be used to further ameliorate consumer costs (NYSERDA and DEC 2023).
We find that both the FTC and the RTC can raise significant revenue, but neither raises sufficient revenue to cover the cost of the complementary policies modeled under the cap-trade-and-invest designs (see Appendix F). In the sectors we model, the FTC could generate approximately $2.2 billion in revenue in the year 2030 whereas the RTC could raise approximately $1.7 billion in revenue. For comparison, between 2025 and 2030 average state spending on subsidies and rebates in the residential and light-duty transportation sectors is about $2.7 billion per year for both policy cases. We do not have total revenue numbers between 2025 and 2030 because only some of our models run interim years. Unmodeled sectors that are anticipated to be covered under the program, like commercial buildings, would provide additional revenue, but free allocation of allowances in other sectors, like energy-intensive trade-exposed (EITE) industries, would limit opportunities to add to program revenue. These findings indicate that additional funds, beyond the cap-trade-and-invest revenue, would be needed to cover the modeled subsidies, provide consumer rebates, and keep allowance prices low. Additional analysis quantifying revenue and spending across all covered sectors in the program and details about the planned subsidies by the state will be valuable in assessing allowance prices and household costs.
5.4. Location of Emissions Changes
Relative to the BAU, we find that a cap-trade-and-invest program drives emissions changes across the state, but in some cases, reductions are concentrated regionally. For example, transportation and residential emissions reductions are concentrated in areas with more dense populations. The upcoming air quality report will investigate the net effect of emissions changes resulting from the sector-specific caps, which push for greater reductions in the residential sector while relaxing the pressure on the transportation sector.
Environmental justice advocates are particularly interested in the location of emissions changes for stationary emissions sources in the industrial and power sectors, and their proximity to DACs. Over two-thirds of emitting New York power plants in our data are within one mile of a DAC. Figures 4A and 4B show the location of the power sector’s direct PM2.5 emissions and NOx emissions, respectively. Red dots indicate power plants where emissions have increased as a result of the FTC, and green dots show locations where emissions have decreased (relative to the BAU). Changes less than 10 pounds over the course of 2030 are excluded so that more substantive changes are visible. The size of the dot reflects the magnitude of the change.
Relative to BAU, most power plants in New York State decrease PM2.5 emissions under the FTC, but 11 plants increase their emissions. Only six plants increase their emissions by more than one short ton of PM2.5, which is why they are hard to see on these maps relative to the large emissions decreases in green. In Figure 4B, a similar pattern is observed. Most plants in NY decrease NOX emissions in the FTC relative to the BAU, except for 16 plants.
Emissions increases can be seen in adjacent states, close enough to potentially impact New York’s air quality. Although a carbon border adjustment is included for imported electricity, these red dots indicate that emissions leakage is present. Our model estimates power sector leakage rates over 100 percent across all cap-trade-and-invest policy cases (106 percent for FTC and 108 percent for RTC). Community impacts in New York is the focus of this analysis, but emissions leakage is an important consideration for climate policy. The pollution impact of these out-of-state increases on New York communities will be covered in the upcoming air quality report.
Figure 4A. Changes in Direct PM2.5 Emissions, by Electric Power Generator, BAU to FTC, 2030

Figure 4B. Change in Direct NOx Emissions by Electric Power Generator, BAU to FTC, 2030

Relative to the historical baseline, we find that under BAU (without the FTC or RTC), seven generating units increase their emissions between 2016 and 2030, and 43 fall short of the economy-wide emissions reduction trajectory forced by the carbon cap. Under the FTC, three generating units increase their emissions from 2016, and 10 fall short of the economy-wide emissions reduction trajectory (6 of which are within a mile of a DAC).
A key goal of the mandatory emission reductions at power-generating facilities included in the RTC is to more evenly distribute emissions reductions across facilities, to avoid contributing to or creating pollution “hot spots,” or concentrated pollution increases in a small area, particularly in or near DACs. The mandatory emissions reductions in the RTC force all power plants to decrease their emissions relative to 2016 levels in line with the economy-wide trajectory (which the CLCPA mandates to be a 40 percent reduction from 1990 levels by 2030).
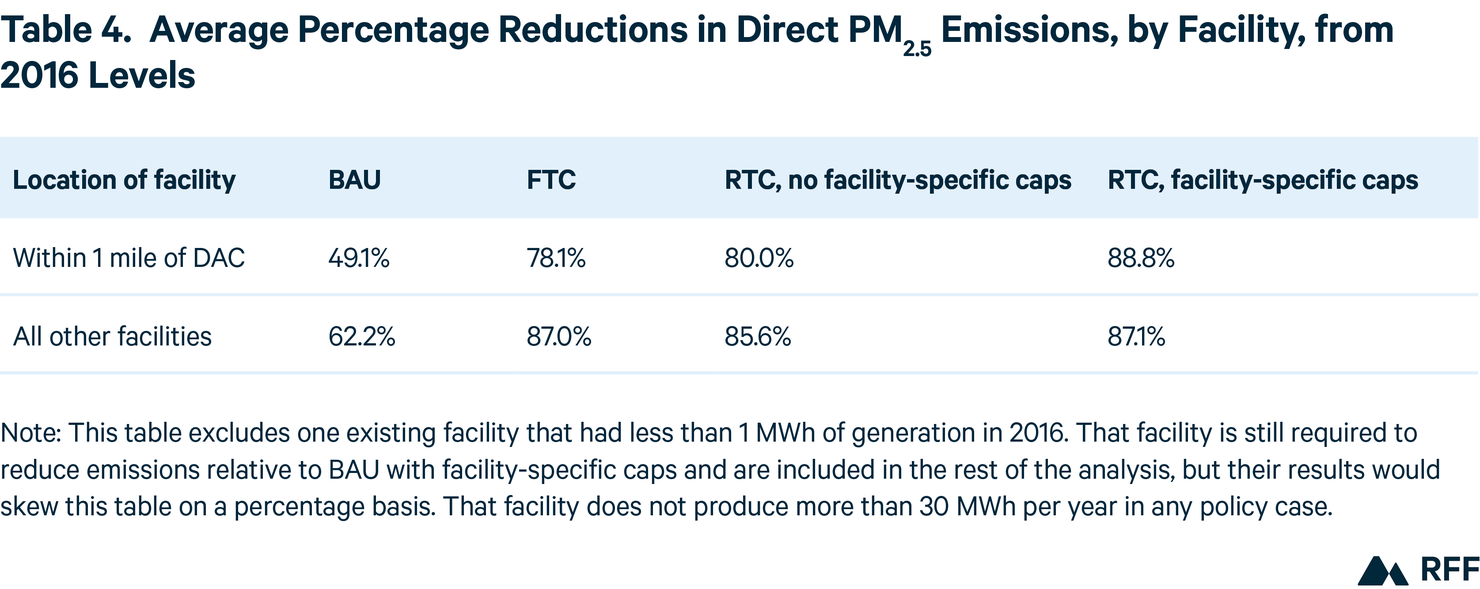
Table 4 shows the average percentage reductions in emissions from 2016 to 2030 at DAC-adjacent and non-DAC facilities under each policy case. In the BAU, which includes the clean energy standard and new clean generation mandates in the CLCPA, the average emissions reductions from the historical baseline are lower for DAC-adjacent facilities (which we define as any facility within one mile of a DAC) compared with all other facilities. This pattern persists under the FTC as well as the RTC with no facility-specific caps, though the disparity between DAC-adjacent facilities and all other facilities decreases. The table shows that once facility-specific caps are added (RTC, facility-specific caps) the disparity is slightly reversed.
Increases in the average percent reduction with facility-specific caps are driven largely by the restrictions on the facilities that do not meet the 40 percent reduction standard without the caps in place (those at the “tail end” of the distribution), indicating that facility-specific caps do serve to control pollution outliers. These percentage reductions are nearly identical for SO2 and NOX emissions.
As mentioned above, adding facility-specific caps to the RTC has almost no impact on residential electricity prices. Furthermore, even though the electricity price is higher under the FTC, average percentage reductions by facility are still slightly lower than in the RTC.
Although the average percentage emissions reductions across facilities are important, absolute emissions changes can be lost in those statistics. For example, a 40 percent reduction at a small facility is a minor change in absolute emissions relative to a 40 percent reduction at a large facility. Furthermore, a cluster of emissions reductions or increases concentrated in an area could be consequential for surrounding communities. To determine these granular details, we need to look at emissions changes by facility and location.
Figures 5A and 5B show the location of direct PM2.5 emissions and NOx emissions changes, respectively, when facility-specific caps are added (compared with sector-specific caps alone). Red dots indicate power plants where emissions increase (28 units in the region, 14 in New York) and green dots show locations where emissions decrease because of the caps (38 in the region, 17 in New York). Changes less than 10 pounds over the course of 2030 are excluded so that more substantive changes are visible. Emission increases may happen when the reduced supply from generators that hit their caps is substituted by supply from other emitting facilities that were below their caps. Out-of-state facilities are not subject to any mandatory emissions reductions, but they are subject to a carbon border adjustment for imports.
5A. Change in Direct PM2.5 Emissions When Facility Caps are Added, 2030

Figure 5B. Change in Direct NOx Emissions When Facility Caps are Added, 2030

Figure 5 shows that the facility-specific caps result in significant annual emissions reductions at some facilities and small, distributed emissions increases to compensate for the reduced supply. For reference, for the New York State facilities that increase emissions, the average annual increase is 22 pounds of PM2.5 (1,480 pounds in all). Among facilities that reduce emissions, the average annual reduction is 581 pounds of PM2.5 (60,429 pounds in all). For DAC-adjacent facilities that increase emissions, the average increase is 25 pounds of PM2.5 (1,246 pounds in all). For DAC-adjacent facilities that reduce emissions, the average reduction is 707 pounds of PM2.5 (45,972 pounds in all).
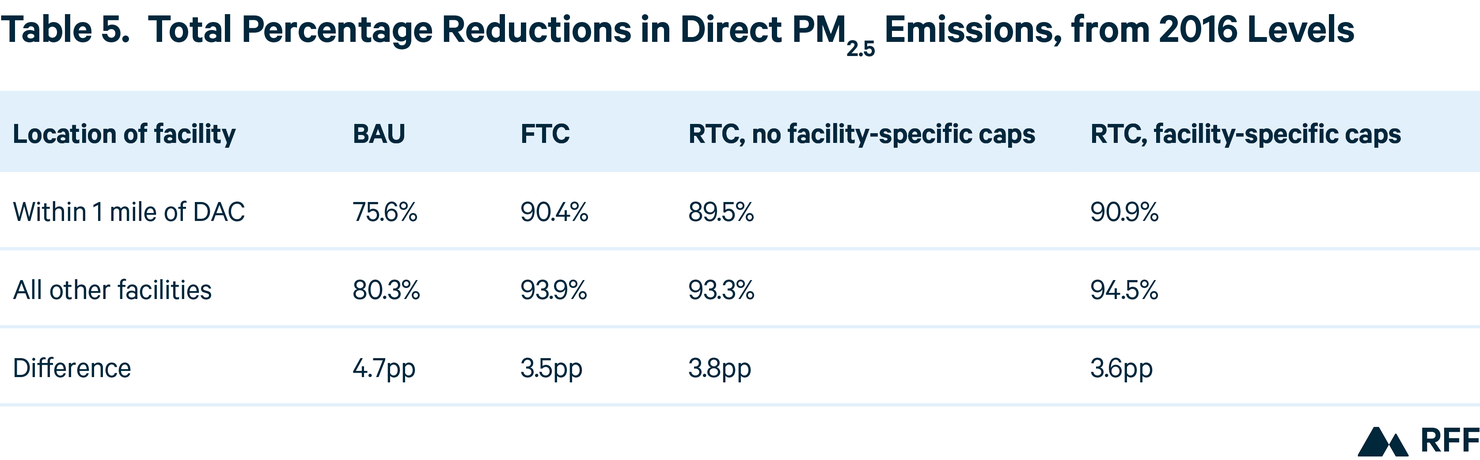
Consequently, adding facility-specific caps to the RTC reduces direct PM2.5 emissions near DACs on net by over 44,000 pounds. As shown in Figure 5, emissions also increase at some facilities outside the state when facility-specific caps are introduced, particularly in Pennsylvania, as New York electricity suppliers face higher restrictions on emissions. Direct PM2.5 emissions within one mile of a DAC are still lower on net (by over 51,000 pounds) when emissions in neighboring states are considered. About 76 percent of the PM2.5 emissions reductions associated with adding facility-specific caps occur within a mile of a DAC (at DAC-adjacent facilities). This is in part because most power sector facilities (69 percent) are located within a mile of a DAC.
Our analysis indicates that the facilities in DACs and non-DACs experience similar total percentage reductions in direct PM2.5 emissions. As shown in Table 5, when we sum emissions by (a) DAC-adjacent facilities and (b) all other facilities and calculate the percent reduction from 2016 emissions levels, the addition of facility-specific caps increases percent reductions for both groups of facilities. However, the change in emissions reductions on a percentage basis is virtually the same for DAC adjacent facilities and all other facilities. This means the difference in percent emissions reduced from 2016 between DAC adjacent facilities and all other facilities (around 3.5 percentage points in the FTC) remains even with the facility-specific caps in place. The difference in emissions reductions between the two regions is greatest in the BAU, without any carbon pricing or facility-specific caps.
The importance of these emissions changes for air quality in DACs will be quantified more directly in the upcoming air quality modeling report, which analyzes how precursor emissions combine and migrate to affect local air quality in New York. In the meantime, our emissions work provides insights on direct pollutants and their proximity to disadvantaged communities, particularly in the power sector.
6. Conclusion
Any cap-trade-and-invest policy in New York State must meet Section 7(3) requirements of the CLCPA by preventing disproportionate burdens and prioritizing copollutant emissions reductions (direct PM2.5, SO2, and NOX) in disadvantaged communities. Without considerations for low-income communities and communities of color, the path to meeting the CLCPA mandates in New York State may leave disadvantaged communities to continue suffering from health-harming air pollution for longer than their privileged neighbors. For the climate and environmental stakeholders we partnered with and consulted, a cap-trade-and-invest program that prioritizes communities of color and low-income communities would ban, or severely restrict, GHG allowance trading and ensure that copollutant emissions reductions and the related air quality benefits are distributed equitably across the state, with greater improvements realized in historically overburdened communities.
This research quantifies the cost and emissions (GHG and copollutants) effects of different cap-trade-and-invest policy designs in New York State, including various environmental justice (EJ) guardrails, as well as a business as usual (BAU) case without a cap-trade-and-invest policy.
Our work in this phase looks specifically at how restricted trading through facility-specific caps and sector-specific caps on GHG emissions affect copollutant emissions levels and costs. A follow-up report will focus on ambient concentrations of PM2.5 throughout the state. The guardrails we test act as “backstops” or minimum performance standards for each sector and each power sector facility, while still achieving the same overall state GHG reductions. Overall, we find that if the state provides significant funds for electrification investments (such as heat pumps), the modeled guardrails (facility- and sector-specific caps) could secure additional PM2.5, SO2 and NOx emissions reductions near DACs and modest fuel savings for households.
We estimate that adding facility-specific GHG caps at each power plant increases the average direct PM2.5 emissions reduction from 80 to 89 percent for DAC-adjacent facilities, compared to a cap-trade-and-invest system with no facility-specific caps. SO2 and NOx emission percentage reductions are nearly identical to PM2.5 reductions. These caps lead to a total net reduction in PM2.5 emissions of over 44,000 pounds in the areas surrounding DACs, with large emissions decreases at a few facilities, and relatively smaller increases in emissions at other facilities to compensate for the reduced supply. The benefits of facility-specific caps accrue mostly to disadvantaged communities because they are the most exposed to power sector emissions, since over two thirds of facilities are within a mile of a DAC.
Furthermore, we find that when the power sector faces no price in the BAU, average emissions reduction rates at DAC-adjacent facilities fall far behind facilities outside 1 mile of a DAC. In a cap-trade-and-invest program where the power sector is exempted from the requirement to purchase allowances (a scenario New York State is considering), high electrification could exacerbate this divide even as it drives emissions reductions in other sectors. In a cap-trade-and-invest program, where prices are uncertain, facility-specific caps could ensure a minimum standard for improvement at each facility.
We find that mandatory GHG emissions reductions for specific sectors rather than economy-wide trading can influence some household costs without affecting overall GHG emissions outcomes. Setting lower ambition in the power and transportation sectors reduces gasoline prices and electricity prices; setting higher ambition in the residential sector has a small upward effect on natural gas prices. For the same economy-wide emissions reductions, pushing for more ambition in the residential sector could mean more pollution reductions in populous areas (see forthcoming air quality report) while allowing lower gasoline prices in the transportation sector. When generous subsidies for electrification are included, sector specific caps could reduce salient energy costs (including gasoline and electricity) for the average low-income household.
The inclusion of sector-specific and facility-specific caps in the cap-trade-and-invest program could help the state meet CLCPA requirements to not disproportionately burden DACs, but complementary policies and additional funding could also play a key role in meeting the CLCPA mandates. Subsidies to support electrification and investments in infrastructure in DACs can provide direct benefits to New Yorkers. The complementary policies we model in the light duty vehicle and residential buildings sectors would require $2.7 billion in average annual investment in subsidies and rebates. This exceeds the revenue raised by cap-trade-and-invest in each of the policy cases. Significant funds would also be needed to cover the subsidies in the medium- and heavy-duty vehicle sectors. If investments are limited to revenue from the cap-trade-and-invest program, we would expect higher prices in the program and higher fuel costs for households. Other policies that specifically support equity goals of the CLCPA include capping harmful copollutants in addition to carbon emissions, enforcing mandatory GHG or copollutant emissions reductions in the industrial sector, and targeting investments to improve local air quality to those communities that need it most.
In short, this part of our research finds that including facility-specific caps in the power sector can ensure a minimum level of reductions for each facility with no increase in electricity prices compared with not having facility-specific caps. Additionally, sector-specific GHG caps with no trading between sectors can help ensure a minimum level of GHG and copollutant emissions reductions in each sector while mitigating key household costs. Based on the results of this analysis and other research , NYC-EJA believes that setting a minimum GHG emissions reduction standard for all facilities is one critical protection for DACs and an essential component of any cap-trade-and-invest system.
However, this report still does not give us a complete picture of the various effects of a cap-trade-and-invest program. In our next report, we will analyze the air quality implications of these policy scenarios and resulting emissions changes. We will specifically quantify the secondary PM2.5 concentrations in communities and report which communities, including DACs, benefit, and to what extent.
Note: A previous version of this issue brief incorrectly listed the units of Figures 4 and 5 and of corresponding references in the text.
Authors


Molly Robertson
Associate Fellow
Molly Robertson is an associate fellow at Resources for the Future.


Eddie Bautista
New York City Environmental Justice Alliance

Eunice Ko
New York City Environmental Justice Alliance


