What Are the Climate, Air Pollution, and Health Benefits of Electric Vehicles?
This working paper models the climate and health benefits of plug-in vehicles under five different policy and market scenarios.
1. Introduction
The transportation sector accounts for 27 percent of US greenhouse gas (GHG) emissions, more than any other sector of the economy. Passenger cars and light trucks emit most of the transportation sector’s GHGs, and they are also major contributors to local air quality problems; at least 125 million US residents live in areas that violate air quality standards. See https://www.epa.gov/ghgemissions/sources-greenhouse-gas-emissions for GHG emissions by sector and https://www3.epa.gov/airquality/greenbook/popexp.html for the population living in areas that violate National Ambient Air Quality Standards.
Public and media attention has focused on the potential for plug-in electric vehicles (PEVs), which include electric vehicles like the Tesla Model 3 and plug-in hybrids like the Chevrolet Volt, to substantially reduce pollution from passenger vehicles. PEV subsidies in the 2022 Inflation Reduction Act are intended to help achieve the Biden administration’s GHG emissions goals. The Biden administration and many states have set economy-wide GHG emissions targets for the coming decades, and the larger the environmental benefits of PEVs, the more that purchase subsidies and other policies contribute to achieving those targets. The efficacy of the PEV subsidies depends on their environmental benefits. Standard economic theory indicates that emissions taxes are economically efficient in the absence of other market failures. Because taxes may not be politically feasible, subsidies may be cost-effective among available options. Other market failures also affect the economically efficient subsidy. For example, learning spillovers in battery production would provide economic justification for subsidizing PEVs (Linn and McConnell 2019).
The environmental benefits of PEVs remain uncertain, however. Compared with gasoline- and diesel-powered vehicles, PEVs reduce emissions from vehicle fuel combustion but increase emissions from electricity generation. Many consumers state that environmental concerns affect decisions to buy PEVs, yet one-quarter of US consumers think PEVs have little or no environmental benefit, and another quarter think those benefits are moderate (Krosnick and MacInnis 2020). Use of fossil fuels for power generation varies temporally and spatially; at most times and locations, electricity generation for PEV charging increases emissions of CO2 and local air pollutants, such as sulfur dioxide (SO2) (Yuksel et al. 2016; Holland et al. 2019). Some research indicates that, given the current reliance on fossil fuel use in the electricity sector, on average PEVs reduce carbon dioxide (CO2) emissions. Research that accounts for the expected shift away from fossil fuels for electricity generation over the coming decades tends to conclude that PEVs will reduce emissions, but under certain assumptions, PEVs may increase emissions (Babaee et al. 2014).
Several shortcomings in the literature have contributed to the confusion about the emissions benefits of PEVs. First, when someone buys a PEV, environmental benefits depend on what the consumer would otherwise have done. For example, buying a PEV instead of a large sport utility vehicle has greater environmental benefits than buying a PEV instead of a fuel-efficient hybrid. Much research has assumed that PEVs replace fuel-efficient hybrids, which may be a reasonable assumption for some consumers but not all (Xing et al. 2021). Different policies that promote PEV sales have different effects on the sales and use of other vehicles. Those effects must be estimated in order to estimate the effects of the different policies. Second, environmental benefits of PEVs also depend on electricity sector emissions. Much of the literature makes simplifications, such as using average current emissions rates, and most studies ignore temporal and spatial variation in emissions rates. The emissions effect of additional electric vehicles may differ from the average emissions rate of electric power generation because incremental or marginal emissions rates are a more appropriate measure than average emissions rates and because PEVs are not charged uniformly across time and space—that is, temporal correlation between PEV charging and fossil generator utilization as well as transmission constraints can cause marginal emissions rates to vary spatially. Also, some studies estimate electricity sector emissions for a single (usually historical) year, but consumers and policymakers care about future benefits over lifetimes of the vehicles. Nearly all the literature fails to account for how PEV adoption will affect the mix of generators in the electricity system and the utilization of those generators. For estimates of regional variation in emissions, see Holland et al. (2016). Third, nearly all research has focused on emissions outcomes, but the optimal PEV subsidies depend on the monetary value of the avoided climate and health damages.
Policymakers need a clear understanding of the environmental benefits of PEVs. In this paper, we estimate the environmental and human health benefits for 2022 to 2035. We address the shortcomings of prior research by combining three models: (a) an economic model of passenger vehicle purchases and driving; (b) an engineering and economic model of the electricity sector; and (c) an air pollution fate-and-transport model that yields monetary valuation of the emissions. In the passenger vehicle model, policies, consumer preferences, and vehicle manufacturer strategies determine pollution from on-road vehicles. Consumers choose vehicles to maximize subjective well-being, and vehicle manufacturers choose prices and attributes to maximize profits. Manufacturers comply with the zero-emissions vehicle (ZEV) requirements in California and 12 other states where the ZEV program essentially requires manufacturers to meet PEV sales targets. Manufacturers also choose whether to introduce new electric vehicles to the market based on expected profitability of entry. Households choose whether to scrap or sell their older vehicles and how much to drive their vehicles. The model estimates emissions of CO2, SO2, nitrogen oxides (NOx), and fine particulate matter (PM2.5) from production and consumption of gasoline and diesel fuel through 2035.
The power sector model is the Engineering, Economic, and Environmental Electricity Simulation Tool (E4ST) model of the United States and Canada. Drivers charge PEVs according to historical charging patterns, and the electricity system operator dispatches generators and electricity storage devices to minimize costs. Firms build and retire generators based on anticipated profitability. We include electricity sector policies adopted as of 2021. The power sector model estimates emissions of the same pollutants as the transportation model by year, county, and smokestack effective height category.
We use the Co-Benefits Risk Assessment Health Impacts Screening and Mapping Tool (COBRA; EPA n.d.), which is an air pollution fate-and-transport model. For each scenario, COBRA projects each county’s ground-level airborne PM2.5 concentration based on projected emissions. PM2.5 accounts for most of the damage from poor air quality (Institute of Medicine 2011). The concentrations include directly-emitted PM2.5 as well as PM2.5 that forms from NOx and SO2. We project vehicle and power sector emissions from both fuel production and combustion. The model estimates the premature deaths and illness in each scenario and calculates the monetary value of these effects.
To estimate environmental benefits of PEVs between 2022 and 2035, we compare a baseline scenario with scenarios that reduce battery costs, increase gasoline prices, tighten ZEV requirements, increase PEV subsidies, and a combination of all these changes simultaneously. We also consider the sensitivity of the results to assumptions about electricity sector environmental policy and PEV charging profiles. In each scenario, the vehicle model predicts how policies and market conditions affect vehicle purchases, driving, and tailpipe emissions. The additional PEV charging affects electricity demand in the E4ST model, which predicts the retirement, construction, and operation of generators, and the consequent emissions. The COBRA model projects the resulting changes in PM2.5 air pollution concentrations, mortality and illness from that air pollution, and the monetary values those health changes in the US.
Across the scenarios, PEV market shares range from 3 to 15 percent and PEVs account for 2 to 8 percent of on-road vehicle miles traveled (VMT) by 2035. The scenarios other than the baseline scenario all have higher PEV sales. Here is a preview of the main results:
- For vehicles sold in 2022, across the scenarios, the estimated net lifetime climate benefits vary from $3,100 to $34,000 per additional PEV. The lifetime US health benefits vary from $690 to $3,300 per additonal PEV. These estimates use 2022 as a case study. They are estimates of the effects of the additional PEV sales that would have occurred in 2022 if the alternative scenarios had been in effect in 2022.
- Across the scenarios, benefits depend on where and when consumers buy PEVs, the fuel economy of the gasoline-powered vehicles they would otherwise have purchased, and how much they drive their vehicles.
- Higher gasoline prices produce the largest benefits per additional PEV, followed by higher ZEV requirements.
- PEV benefits decline between 2025 and 2035 because gasoline vehicle emissions decrease over time as new, lower-emitting vehicles replace older, higher-emitting vehicles. In our modeling results, incremental emission rates in the electric sector do not decline fast enough to counteract this, although we conducted our modeling before the passage of the Inflation Reduction Act, so our results do not reflect its strong clean generation incentives.
- Emissions rates of the incremental generation for PEV charging differ substantially from the average emissions rates of generation.
- An electricity sector policy that reduces the average emissions rate of electricity generation may considerably increase PEV benefits, depending on the policy’s design and other circumstances.
The remainder of the paper summarizes the modeling framework, describes the scenarios, and presents the results. The analysis includes gasoline- and diesel-fueled vehicles. For brevity, we refer to them together as “gasoline” vehicles because diesels accounted for less than 0.4% of light-duty vehicle sales in the US in 2021 (EIA 2022).
2. Modeling Framework
We integrate three models to estimate the effects of PEVs on GHGs and local air pollution: (a) light-duty vehicle purchases, fuel consumption, and emissions; (b) electricity sector investments, retirements, operation, and emissions; and (c) air pollution fate and transport. This section summarizes the structure of the models and how we integrate them.
2.1. Light-Duty Vehicles
The model for light-duty vehicles contains two components: new-vehicle sales and on-road fuel consumption. The first component characterizes vehicle sales by year (2018 through 2035) and region (California, other ZEV states, and all other states, to enable an explicit representation of the ZEV program). Because the model parameters are estimated using data from 2010–2018, the simulations begin in the year 2018. We report results beginning in 2020. See Appendix A and Linn (2022) for details about the model. Each consumer in the model chooses the new vehicle that maximizes subjective well-being, which depends on vehicle prices, fuel costs, and other factors; preferences vary across demographic groups based on income, age, urbanization, and region. Each manufacturer chooses vehicle prices and fuel economy to maximize profits while meeting regional ZEV standards. Each year, manufacturers also choose whether to introduce new electric vehicles, depending on the expected profitability and entry costs of those vehicles. An important feature of the model is that all consumer preference parameters and manufacturer costs (including electric vehicle entry costs) are estimated from observed choices between 2010 and 2018.
The modeling does not include federal fuel economy and GHG standards. Including these standards, and assuming that they do not vary across scenarios, would reduce estimated benefits of PEVs. The standards determine the market-wide average GHG emissions rate, and selling additional PEVs would cause the average GHG emissions rate of gasoline-powered vehicles to increase, offsetting the emissions benefits of the PEVs. See Linn (2022) for analysis of emissions reductions from PEVs accounting for interactions among PEV subsidies, ZEV program, and federal GHG standards. However, modeling the GHG standards may cause us to understate environmental benefits of PEVs. Certain scenarios we consider, such as higher gasoline prices, could cause Congress or the regulatory agencies to tighten fuel economy and GHG standards. The PEV benefits we estimate for each scenario are the same as if we were to assume that EPA tightens GHG standards exactly by the amount that each scenario reduces GHG emissions.
The output of the new vehicle sales component feeds into the on-road fuel consumption component of the model. The model tracks ownership of vehicles by county, vehicle class (car or light truck), and vehicle age. Each year, households purchase new vehicles and decide whether to scrap their older vehicles. They decide how much to drive their vehicles, depending on driving preferences and fuel costs. Fuel consumption and tailpipe emissions are computed from estimated miles traveled and emissions rates of the vehicles. Annual electricity consumption by electric vehicles and plug-in hybrids is computed by county and year. Linn (2022) describes the vehicle choice component in more detail, and Appendix A provides additional information about both components of the light-duty vehicle model.
2.2. Electricity Sector
We use E4ST to simulate the electricity sector in 2025, 2030, and 2035. E4ST is a spatially detailed capacity expansion and operation model of the North American electricity sector that simulates approximately 5,000 generation and consumption locations and 17,000 transmission segments. It forecasts the type and location of future generator investment and retirement, as well as the hourly operation of each generator and the electricity grid. Inputs include detailed generator data, hourly locational wind and solar resource data, hourly locational electricity consumption data, and consumption growth projections. Appendix A part A2 further describes the model and references peer-reviewed research journal papers that have used the model.
The light-duty vehicle model provides estimates of PEV electricity consumption by county and year to the E4ST model. We disaggregate each county’s annual PEV electricity consumption spatially and temporally. In this analysis, E4ST uses state-level load projections from the medium electrification and moderate technological advancement scenario in the National Renewable Energy Laboratory (NREL) Electrification Futures Study (Mai et al. 2020). We replace the light-duty electric vehicle electricity consumption projections from NREL with our own county-level projections from the light-duty vehicle model. Appendix A part A2 explains how the county-level projections are mapped to consumption locations in E4ST, which yields projections of future consumption by location, year, and hour.
The next step involves allocating annual electricity consumption at a particular location across hours of the year. The charging profile is the distribution of hourly charging over the day, which depends on the owners’ habits and the availability of public charging. See https://afdc.energy.gov/evi-pro-lite/load-profile for a tool developed by the California Energy Commission and the National Renewable Energy Laboratory for exploring charging behavior. We adopt the daily charging profile from the Idaho National Lab (INL) EV Project (INL 2014), which is an empirical profile based on data from multiple states, and we use the Electrification Futures study to account for seasonal variation in charging behavior. We chose to use the INL profile for the majority of our study because it derives from collected charging data rather than modeled behavior. We also run scenarios using an alternative charging profile from the Electrification Futures study. See Section 4.7 for an illustration of both charging profiles.
2.3. Model of Air Pollution Dispersion, Transformation, Health Effects, and Value
The light-duty vehicle model and the electricity sector model project emissions of NOx, SO2, and PM2.5 by year, county (or county equivalent), and height at which the emissions effectively enter the atmosphere. We feed the combined vehicle and electricity emissions into the Environmental Protection Agency’s COBRA air pollution fate-and-transport model. COBRA is a reduced-complexity air pollution model that uses a source-receptor matrix in one stage of estimating air quality effects of pollution emissions. Although reduced-complexity models may be less accurate than more detailed models, they generally produce similar results (see Appendix A of the COBRA manual for details: https://www.epa.gov/cobra/users-manual-co-benefits-risk-assessment-cobra-screening-model). COBRA estimates county-by-county premature mortality, illness, and the dollar value of the health damages caused by changes in the PM2.5 concentrations in ground-level air. There are approximately 3,000 counties and county equivalents in the contiguous United States, and there are four effective emissions height categories in each county (including ground level), for a total of approximately 12,000 potential emissions locations. Some counties have zero emissions from certain effective emissions height categories. In addition to direct emissions from the transportation and electricity sectors, all scenarios include upstream emissions from production and transportation of gasoline, diesel fuel, natural gas, and coal consumed in the transportation and electricity sectors. To model the locations at which these upstream air pollutants are emitted, we use COBRA’s built-in emissions inventory. For each scenario, we assign incremental upstream emissions proportionately to the emissions inventory. For example, the national estimated upstream emissions from natural gas are allocated across emissions sources categorized by COBRA that belong to the natural gas production sector, according to their relative emissions amounts in COBRA’s 2028 projected emissions inventory. Appendix A part A3 provides more details on estimating upstream emissions and assigning them to COBRA sectors and locations. We assume that air pollution from sectors other than transportation, electricity, and their upstream fuel activities remain at their projected 2028 levels. We use the emissions inventory from 2028 because that year is partway through our analysis period.
There are two leading studies of the strength of the relationship between air pollution exposure and risk of death: Krewski et al. (2009) and Lepeule et al. (2012). The risk estimated in Lepeule et al. (2012) is approximately 2.2 times as great as the risk in Krewski et al. (2009). We use the midpoint between the estimates.
2.4. Estimating the Value of Climate Damages
To estimate the dollar value of harm from the global climate change caused by CO2 and methane emissions, we use the global social cost of carbon values from Rennert et al. (2022) and the global social cost of methane values from Prest et al. (2022). Social cost of carbon per metric ton is $205.50 in 2025, $226.00 in 2030, and $244.50 in 2035. Methane damage cost per short ton is $2,427.50 in 2025, $2,915.00 in 2030, and $3,591.51 in 2035. All values are in 2020 dollars and assume a 2 percent real discount rate. These values and very similar recent EPA (2022) values, update prior update estimates by the US government’s Interagency Working Group on the Social Cost of Greenhouse Gases (2016) in accordance with the recommendations of a National Academy of Sciences expert panel (2016), and they are considerably higher than the prior estimates. The estimated benefits of GHG reductions would be approximately one third as large using the prior estimates.
For all pollutants, we estimate direct tailpipe and power plant emissions and the emissions associated with upstream fuel processes. We use distinct social costs of carbon and methane when calculating damages. When we report CO2-equivalent (CO2e) emissions, we use a CO2e value of 32 for methane, which is the estimated 100-year global warming potential of methane. This value is closer to the estimated ratio of carbon and methane damages in Rennert et al. (2022 and Prest et al. (2022) than the 20-year global warming potential. The appendices present our assumptions about methane leakage rates associated with natural gas, oil, and coal production.
3. Scenarios
We compare a baseline scenario that includes a low level of PEV sales against five scenarios that cause higher PEV sales (Table 1). The baseline scenario assumes no ZEV program and that federal subsidies of up to $7,500 per vehicle are phased out after each manufacturer surpasses 200,000 cumulative sales. The federal subsidies are provided as tax credits, and we assume that all consumers are eligible for the full credit. The baseline scenario also assumes that battery costs decrease by $40 per kilowatt-hour (kWh) between 2018 and 2030 and then remain constant after 2030. We use gasoline prices from the Annual Energy Outlook (AEO) 2021 reference case. See Table A1 in Appendix A for gasoline prices. The battery costs are expressed as a change from 2018 levels because 2018 is the initial simulation year for the vehicle model, and for each vehicle, marginal costs decrease in proportion to the vehicle’s range and the assumed battery cost reduction. In the model, vehicle manufacturers choose vehicle prices to maximize profits given the marginal costs of producing the vehicles, consumer demand, and policies such as ZEV standards. Lower battery costs reduce marginal costs, which causes manufacturers to reduce vehicle prices. The price change may differ from the marginal cost change in accordance with demand conditions (in general, the less sensitive consumer demand is to prices, the larger the price change caused by a marginal cost change). This feature of the model is different from many other models used to project emissions, such as the models that the Environmental Protection Agency uses for benefit-cost analysis of the passenger vehicle GHG standards, which assume fixed markups over marginal costs.
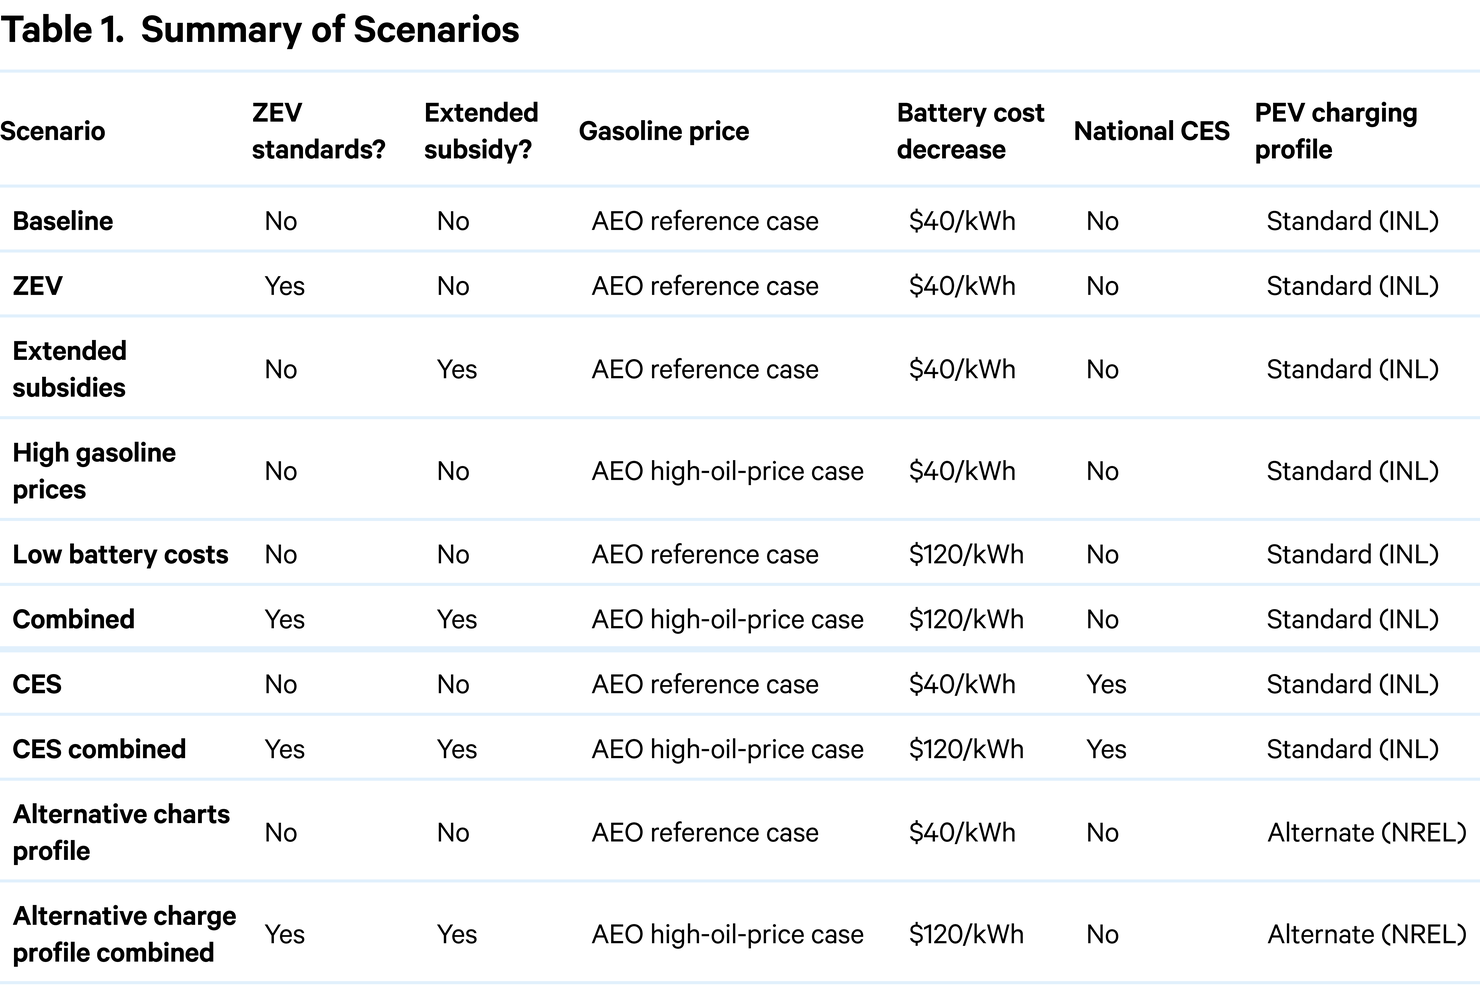
The first two scenarios after the baseline focus on policies aimed at increasing PEV sales. The ZEV mandate scenario is the same as the baseline but includes ZEV requirements that increase through 2025 and then remain constant between 2025 and 2035.California is preparing to continue tightening standards after 2025, and other ZEV states will decide whether to adopt the post-2025 standards. We do not include these standards because they were not finalized before we began the modeling. The ZEV program credits PEVs according to their range in all-electric mode. For example, a Nissan Leaf with a range of 226 miles receives 2.76 credits per vehicle, and a Tesla Model 3 with a range of 272 miles receives 3.22 credits per vehicle. Because the number of credits depends on range, the PEV market share depends on the mix of vehicles sold. For context, in the baseline scenario the sales-weighted average range is about 200 miles.
The second scenario eliminates the phase-out provision of the federal PEV subsidy. Consequently, vehicles are eligible for subsidies regardless of the manufacturer’s historical sales. Tesla and GM vehicles, which are not eligible in the baseline, can receive the subsidy in this scenario. The subsidy amount is $7,500 per vehicle, which is similar to the new-vehicle subsidies included in the Inflation Reduction Act, although we do not include domestic content and battery requirements because of data limitations.
The next two scenarios consider changes in market conditions that affect PEV sales. First, we replace the gasoline price forecasts in the AEO reference case with the gasoline price forecasts in the AEO high-oil-price scenario. Compared with the reference case, high oil prices increase 2030 gasoline prices by about $1.30 per gallon (47 percent) in 2030. In the second alternative market condition scenario, we assume that battery costs decrease $120 per kWh between 2018 and 2030, rather than $40 per kWh as in the baseline. This cost reduction is roughly consistent with recent battery price forecasts. See https://about.bnef.com/blog/battery-pack-prices-fall-to-an-average-of-132-kwh-but-rising-commodity-prices-start-to-bite/ and recently announced manufacturer targets. The combined scenario combines the four policy and market condition scenarios: expanded ZEV requirements, extended PEV subsidies, high gasoline prices, and large battery cost reductions.
The scenarios below the blue bar in Table 1 are additional sensitivity cases. Environmental policies that affect the electricity sector’s generation, investments, and retirements can also affect the benefits of PEVs. The above scenarios incorporate environmental policies affecting the electricity sector that were adopted before the bipartisan infrastructure law, which Congress passed in late 2021, and the Inflation Reduction Act, which Congress passed in late 2022. Omitting these or any future policies, while standard in forecasts such as the AEO, may cause us to underestimate the emissions benefits of PEVs because electricity sector emissions may be lower than our model estimates. To provide a sense of the magnitude of this underestimation, we model a clean electricity standard (CES), which effectively reduces the emissions intensity of electricity generation over time. Two other sensitivity scenarios use an alternative electric vehicle charging profile that includes more daytime and early evening charging and less charging during sleeping hours.
Note that all scenarios, including the combined scenario, reflect modest changes in policies or market conditions for PEVs. The expanded ZEV mandate scenario includes current ZEV requirements but does not include the higher ZEV requirements that California and many other states are adopting through 2035. In the modeling, PEV purchases respond positively to charging station availability. Because the number of stations does not vary across scenarios, the level of charging stations does not affect the results. Gasoline prices in the high-oil-price scenario are just 25 percent higher than gasoline prices that prevailed in late 2021. The battery cost reductions in the low-cost scenario are no more optimistic than current forecasts.
We use those modest magnitudes, rather than more aggressive ones, for two reasons. First, as we noted, consumers and policymakers are interested in the environmental effects of PEVs. Modest changes in future PEV sales—rather than, say, 100 percent market shares—are the most relevant for many policy decisions such as choosing the level of purchase subsidies. Notwithstanding the PEV goals of the Biden administration and certain states, policymakers in many states (and a potential future Republican Congress or president) are considering only modest changes to existing policy.
Second, nearly all parameters in the new-vehicle market component of the transportation model are estimated from recent consumer and manufacturer decisions. This yields plausible responses to future changes in policies or market conditions, since we do not rely on ad hoc assumptions about consumers’ and manufacturers’ behavior. In fact, the model predicts PEV market shares accurately in 2022, even though the most recent data come from 2018.
A potential downside to this approach is that large changes in market or policy conditions could affect consumers’ preferences. For example, consumer demand in one year could depend on past vehicle ownership if consumers hear that recent PEV buyers have had positive experiences with their vehicles. Such dynamics could reduce the model’s accuracy at predicting future sales, particularly in scenarios with PEV market shares that far exceed current levels.
Two factors mitigate this concern about accuracy. First, we model manufacturers’ behavior dynamically by allowing PEV entry to respond endogenously to market and policy conditions and by allowing entry costs to fall over time as manufacturers learn how to design PEVs at lower cost. Second, given the funding for public charging stations included in the Bipartisan Infrastructure Law, greater availability of public charging stations is one of the main factors likely to increase consumer demand. To capture this effect, all scenarios include a doubling of the number of charging stations by 2035. Notwithstanding the two mitigating factors, we consider modest increases in PEV market shares to reduce concerns about out-of-sample accuracy of the model.
4. Results
This section presents the results from the scenarios in Table 1. The subsections discuss the transportation results (4.1), electricity sector results (4.2), the combined climate and health effects (4.3 through 4.5), and the sensitivity cases (4.6 and 4.7).
4.1. Transportation Sector Results
Figure 1 shows sales of electric vehicles (Panel A) and plug-in hybrids (Panel B) from 2020 through 2035 for each scenario. Note the differing vertical scales in the two panels. In the baseline scenario, total PEV sales are about 250,000 units in 2035, which is roughly consistent with the AEO 2021 reference case. The AEO 2021 reference case includes assumptions for policies and market conditions that are similar to the baseline. The main difference is that the reference case includes federal fuel economy standards, and our baseline does not. Despite that difference, average fuel economy in the baseline is similar to average fuel economy in the AEO. Note that PEV sales decrease in the early 2020s, largely because the subsidies are phased out for most companies as they exceed the 200,000 sales threshold. Rising fuel economy of gasoline vehicles, caused by manufacturers’ adoption of fuel-saving technologies, also contributes to the decrease in PEV demand. Whereas electric vehicle sales are about three times higher than plug-in hybrid sales in 2020, they are about five times higher in 2035. This is primarily because battery costs ($/kWh) decline over time, reducing the cost of producing an electric vehicle versus a plug-in hybrid because of the former’s larger battery packs.
Figure 1. Sales of New Plug-in Vehicles
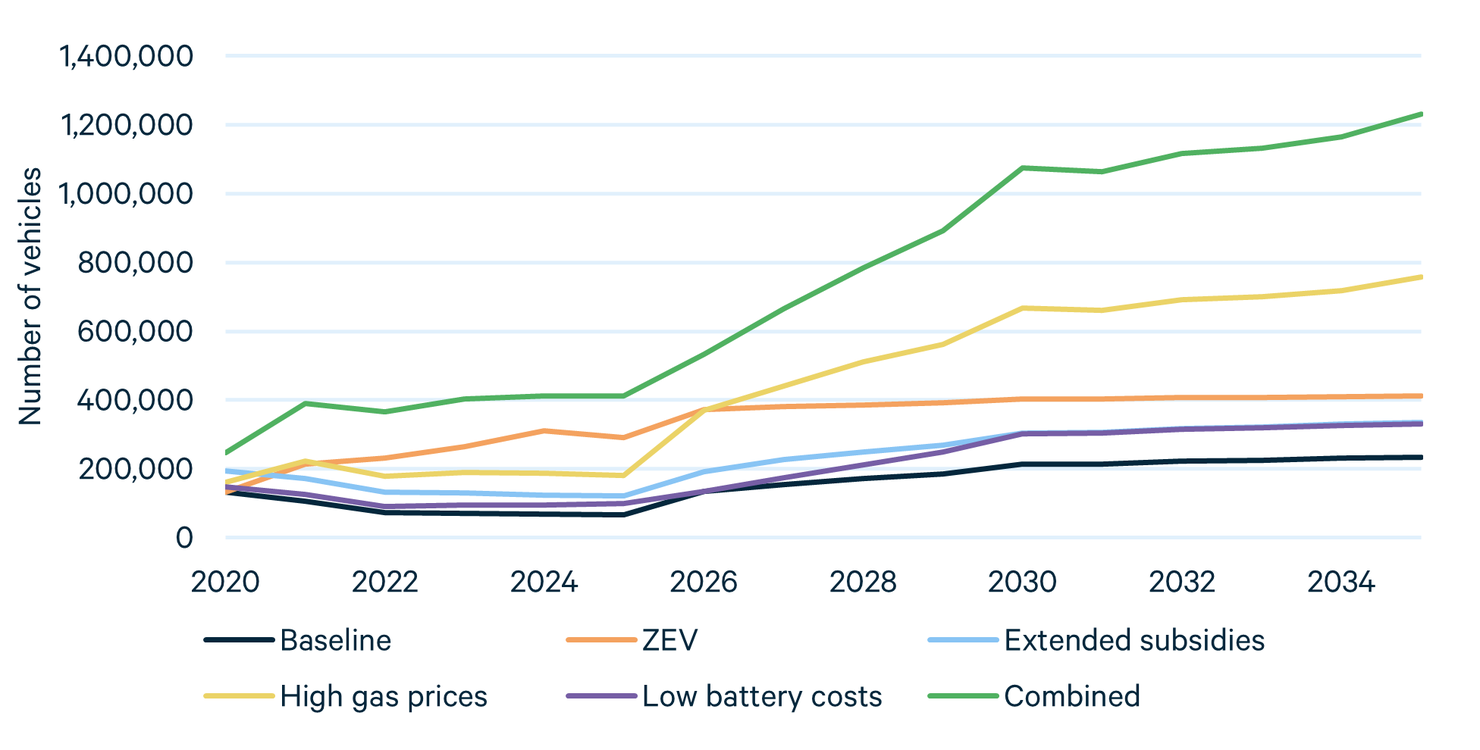
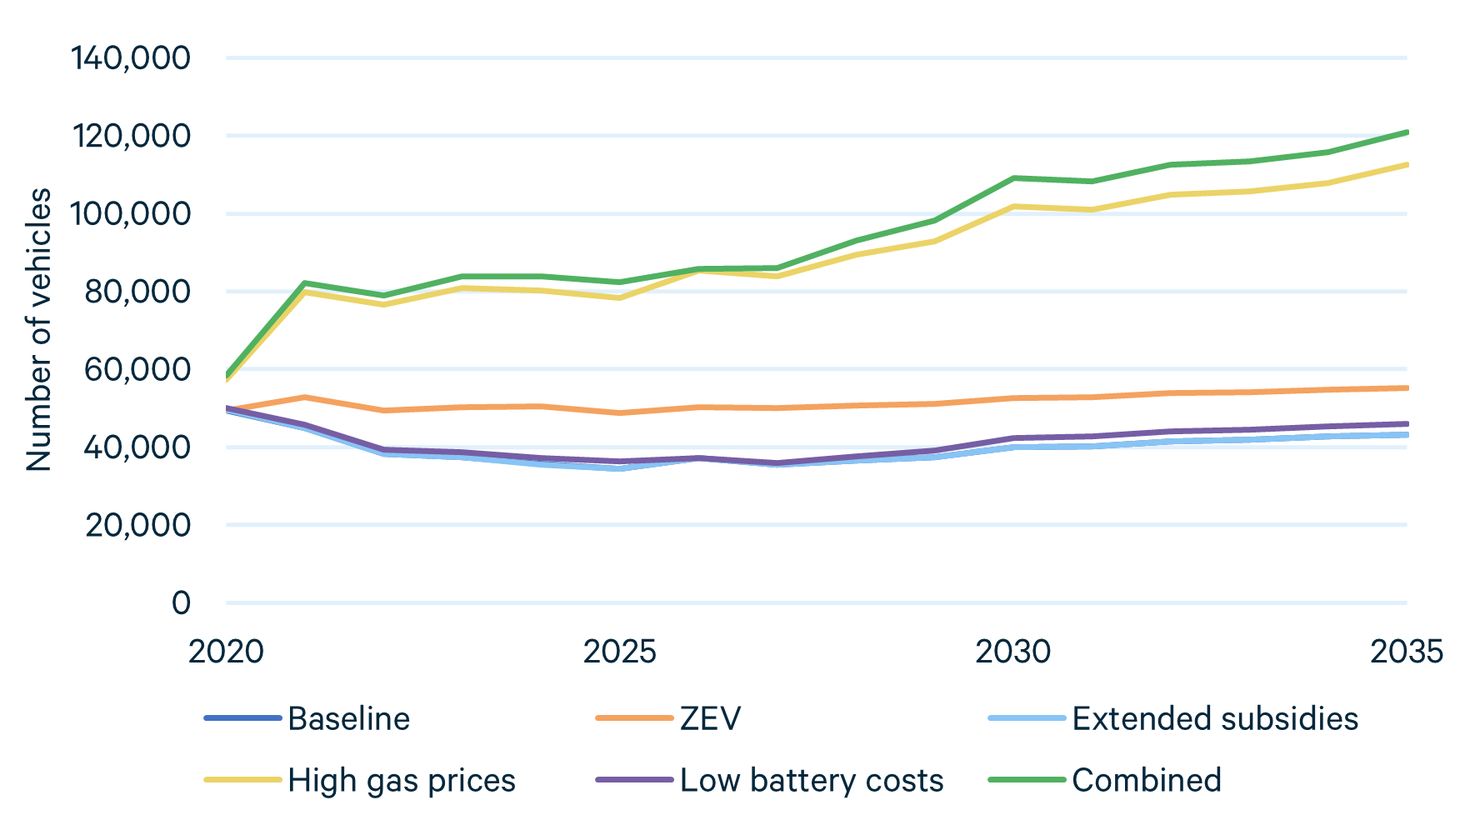
In the extended subsidy scenario, the subsidy amounts are similar for plug-in hybrids and electric vehicles. Despite having similar values, the subsidies affect sales of electric vehicles more because they cause manufacturers to introduce new electric vehicle models to the market. In other words, if there were no electric vehicle model entry, the subsidy would have more similar effects on sales of both PEV types. Note that the model includes the simplification that manufacturers can introduce only new electric vehicles and not new plug-in hybrids; this assumption is broadly consistent with manufacturers’ recent announcements of new electric vehicles.
After 2025, high gasoline prices have a larger effect on PEV sales than the ZEV standards do. This is primarily because the ZEV requirements do not continue to strengthen after 2025. Between 2020 and 2025, when ZEV standards are tightening, their effect on PEV sales is larger than the effect of the high gasoline prices. The ZEV standards have a smaller effect on plug-in hybrid sales because they receive fewer ZEV credits than do electric vehicles. In contrast, higher gasoline prices increase demand for plug-in hybrids and electric vehicles by more similar proportions. The combined scenario yields total PEV sales about six times higher than in the baseline; PEVs account for about 10 percent of total sales in this scenario. In the combined scenario, as well as the other scenarios considered, electric vehicles represent a much larger share of total PEV sales than in the baseline. This is because most scenarios favor electric vehicles over plug-in hybrids and also because of the entry of new electric vehicle models in response to the demand and policy drivers.
Figure 2 shows the number of PEVs on the road by scenario and year, in millions of vehicles. The numbers increase steadily in all scenarios. In the on-road fuel consumption component of the model, new vehicles replace older ones as they are scrapped, and the increases in on-road PEVs accord with the sales results in Figure 1.
Note that in all scenarios and years, the share of PEVs in new-vehicle sales is higher than the share of PEVs in on-road vehicles. For example, in the combined scenario in 2035, PEVs account for about 10 percent of total new-vehicle sales, whereas PEVs account for about 5 percent of on-road vehicles. For context, in 2017, US households had approximately 250 million vehicles.
The share of PEVs on the road is lower than the share of PEVs in new-vehicle sales because, in a typical year, roughly 5 percent of older vehicles are scrapped and replaced by new vehicles. The share of PEVs in new-vehicle sales is higher than the share of PEVs in scrapped vehicles, which increases the share of PEVs in on-road vehicles over time. This increase is gradual because such a small percentage of on-road gasoline vehicles is replaced each year.
In Figure 3, the percentage of PEVs in total miles traveled is higher than the percentage of PEVs in total vehicles on the road. For example, in the combined scenario in 2035, PEVs account for about 8 percent of VMT but less than 5 percent of on-road vehicles. This is because, in the simulations, PEVs on the road tend to be younger than gasoline vehicles on the road, and younger vehicles are driven more miles per year than older vehicles.
Figure 2. Number of On-Road Plug-in Vehicles
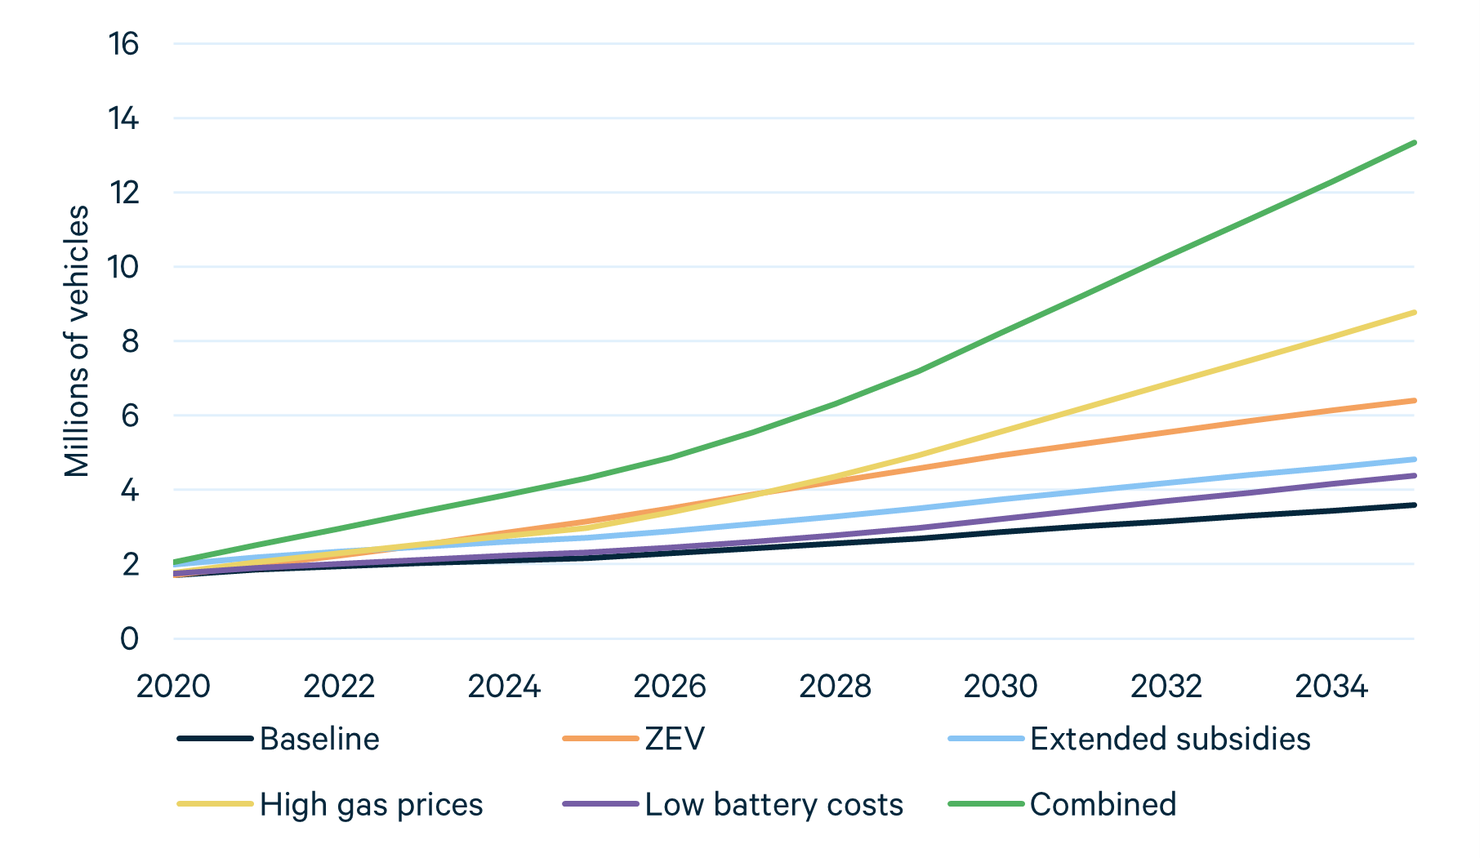
Figure 3. Percentage of Vehicle Miles Traveled by Plug-ins
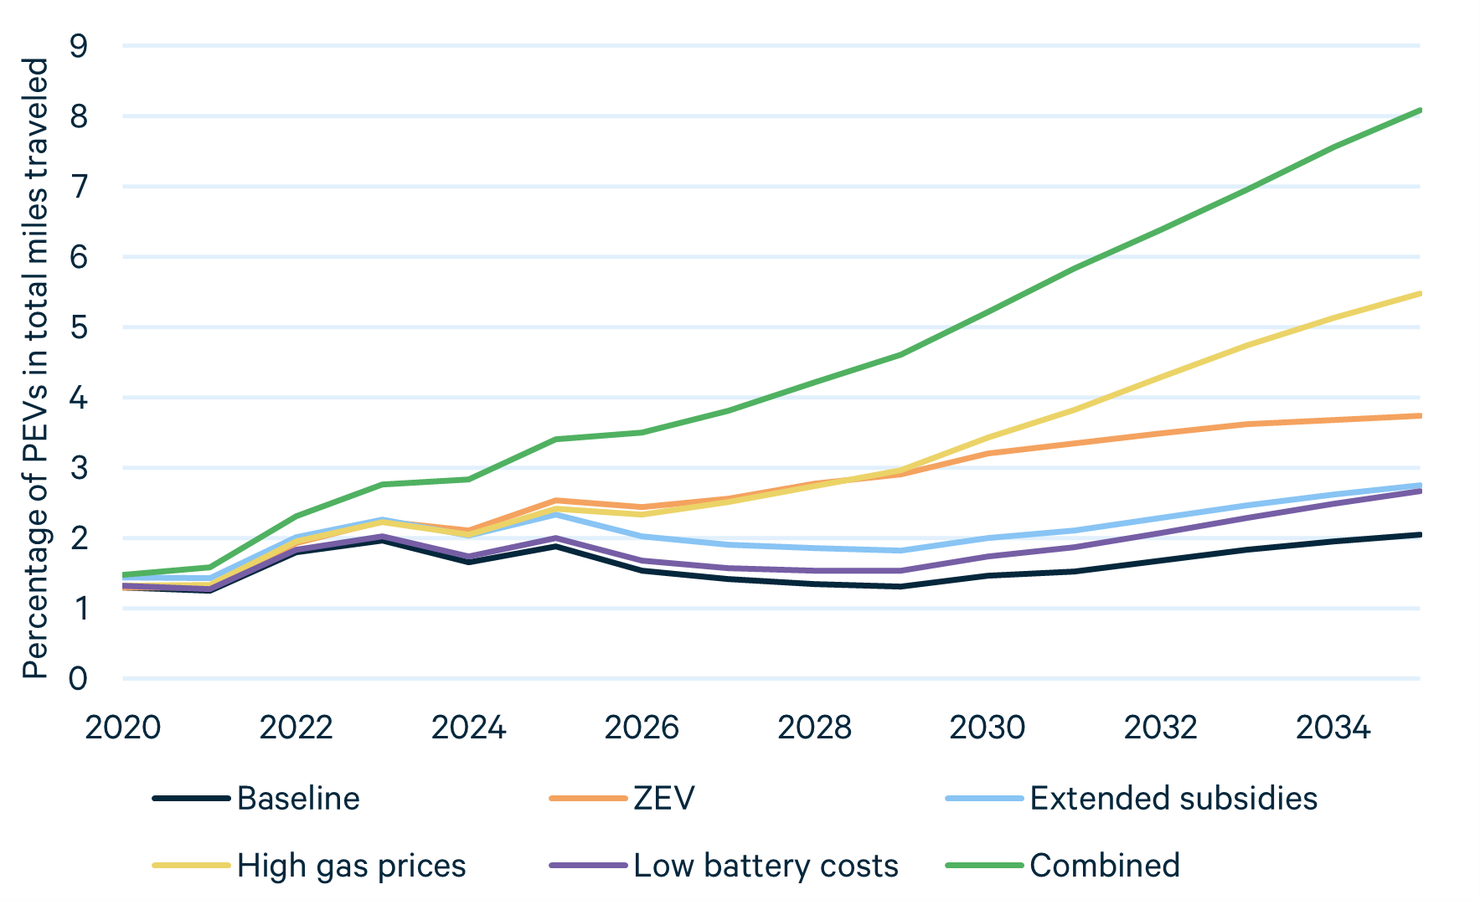
The number of PEVs increases steadily in all scenarios (Figure 2), but the percentage of PEVs in total miles traveled does not increase steadily in the baseline, low battery cost, and extended subsidy scenarios (Figure 3). For the most part, the percentage of PEVs in total miles traveled decreases in Figure 3 for scenarios and years when PEV sales are low (see Figure 1). In the model, vehicles are scrapped in accordance with their age and class (light trucks typically last longer than cars, and older vehicles are more likely to be scrapped than younger vehicles). After those vehicles are scrapped, households choose how much to drive the remaining vehicles. When PEV sales are low, fewer new PEVs replace scrapped gasoline vehicles, which reduces the share of PEVs in total miles traveled.
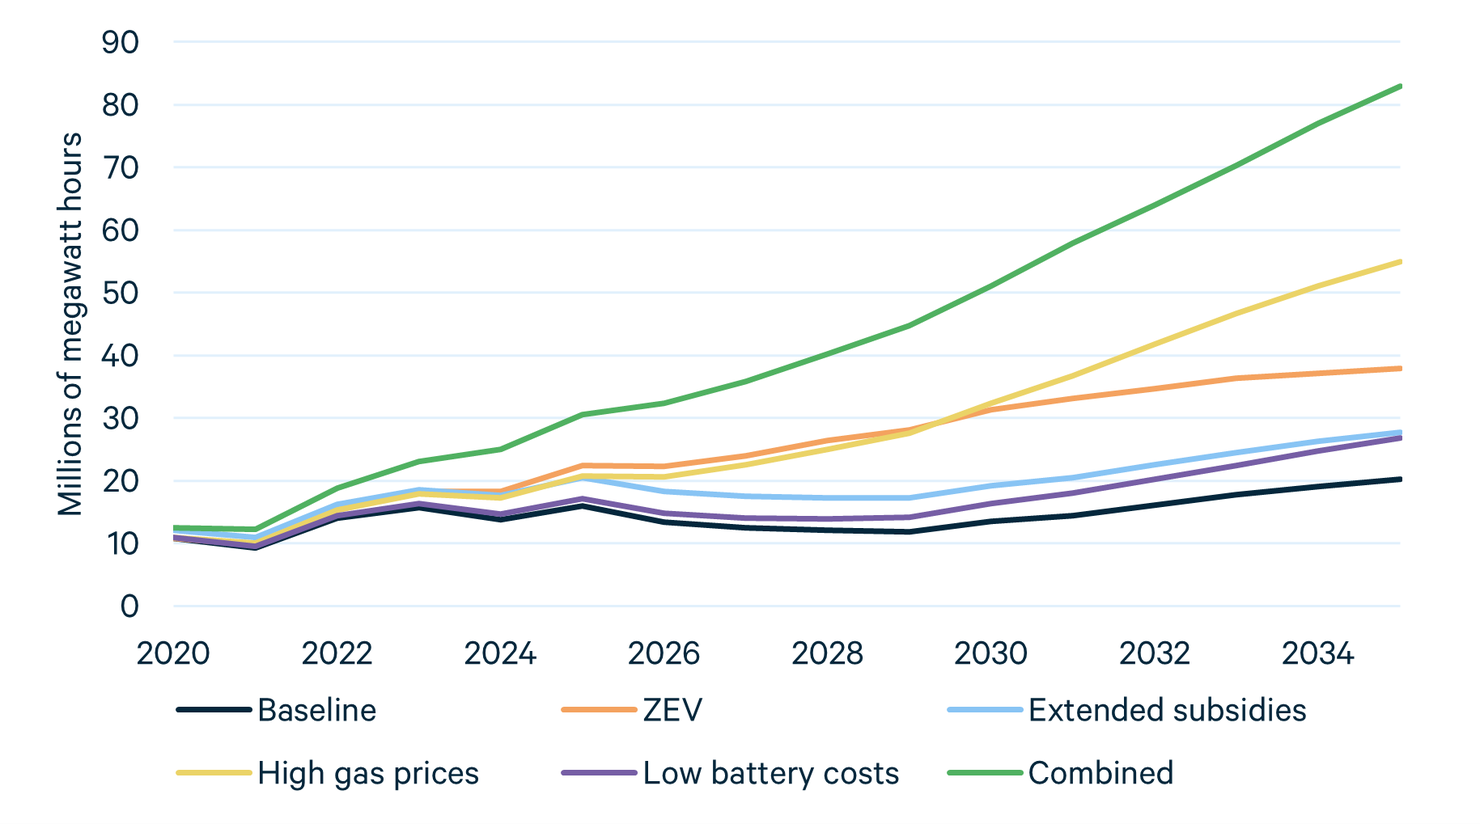
Figure 4 shows electricity consumption for each scenario in millions of megawatt-hours (MWh). The electricity consumption is an input to the E4ST model, and a comparison of Figures 3 and 4 shows that electricity consumption increases proportionately to the share of VMT by PEVs. For context, US retail electricity sales in 2020 totaled 3,700 million MWh. For the combined scenario, plug-ins account for 1.9 percent of electricity consumption in 2035.
Figure 4. Electricity Consumption by Plug-ins
4.2. Electricity Sector Results
In the baseline scenario, the US generation mix consists of 30 percent nonemitting generation in 2025, 33 percent in 2030, and 36 percent in 2035. The national average CO2 emissions rate of generation is 323 g/kWh in 2025, 304 g/kWh in 2030, and 287 g/kWh in 2035. As Appendix Table B1 shows, these emissions rates are 5–7 percent higher than in the 2022 AEO high oil and gas supply case (EIA 2022) because our model predicts more nuclear plant retirement. We assume that nuclear energy will not be subsidized in most states. Consequently, in most states and years, nuclear generators cannot cover their future costs and are more likely to retire than under the AEO assumptions. Importantly, although this difference in nuclear capacity affects average emissions rates, it has little effect on the incremental emissions caused by PEV charging because those benefits depend on the additional emissions caused by charging rather than on the average emissions rate per se.
The remainder of this subsection and the next subsection report results of each scenario relative to the baseline. Figure 5 shows per-kWh emissions of the additional generation caused by PEV charging. For total incremental emissions, rather than incremental emissions per kWh of PEV charging, see Figure B1 in Appendix B. The incremental emissions rates of PEV charging are much lower in response to the ZEV mandates than in response to the extended subsidies and low battery costs. The reason is that states with ZEV mandates also tend to have low marginal emissions rates (i.e., emissions caused by each kWh of additional charging). More than half the additional generation in response to the ZEV mandates is from wind and solar, whereas the additional generation in response to the extended subsidies and low battery costs is mostly from natural gas (see Figure B3 of Appendix B).
Figure 5. Additional Electric Sector Emissions per Additional kWh of PEV Charging, Relative to Baseline Scenario
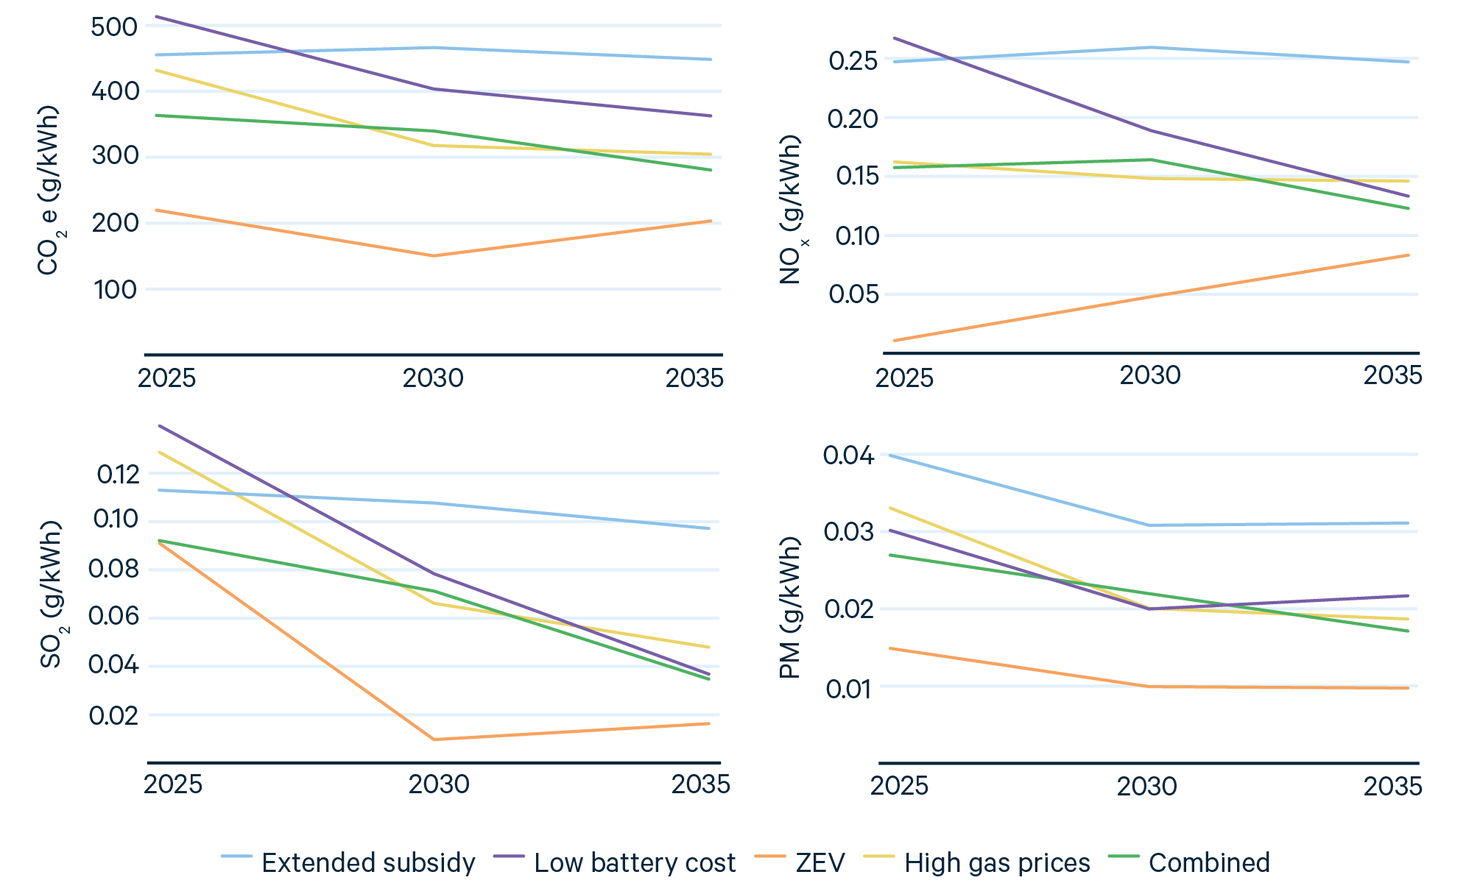
In Figure 5, the incremental emissions rates of the combined scenario resemble an average of the incremental emissions rates in the other scenarios. This is unsurprising, since the combined scenario includes the conditions from the other four scenarios.
Endogenizing generator investments and retirements in the model reduces the incremental emissions caused by PEV charging. Without endogenous construction and retirement, the additional generation for PEV charging would come almost entirely from increased generation by natural gas- and coal-fueled generation, since those are the main generator types that can increase their output. With endogenous construction and retirement, almost all of the additional generation comes from additional generation capacity powered by natural gas, solar, and wind that is built in response to the additional PEV charging (Figures B2 and B3 in Appendix B). These results are different from the effects of PEV charging on generation mix and emissions in Holland et al. (2016, 2019), who estimate emissions from PEV charging without including generator investment and retirements.
4.3. Combined Transportation and Electricity Sector Emissions per PEV
Here we compare and combine the emissions changes in the transportation and electricity sectors. Figure 6 shows the emissions changes in the transportation and electricity sectors for each pollutant and scenario, relative to the baseline. For each pollutant type and scenario, the small black horizontal line shows the total emissions change that is the sum of the electricity and transportation changes (both direct and upstream). Relative to the baseline, every scenario reduces total CO2e emissions in all three years, except the extended subsidy scenario in 2035 and low battery cost scenario in 2035.
Consumer preferences explain why total CO2e emissions increase in 2035 in the low battery cost and extended subsidy scenarios. Compared to other scenarios, these two scenarios cause consumers to shift from more fuel-efficient gasoline vehicles to PEVs, resulting in smaller emissions reductions per PEV sold.
In contrast, high gasoline prices and ZEV standards cause substitution from less efficient gasoline vehicles to PEVs, and the emissions reductions are greater for these scenarios. Both the ZEV and gasoline price scenarios raise the cost of buying or operating gasoline-powered vehicles, incentivizing consumers to buy PEVs. In scenarios that include ZEV standards, manufacturers increase prices of gasoline-powered vehicles to help them comply with the standards. These incentives turn out to be more effective at causing consumers to substitute from fuel-inefficient gasoline vehicles than the battery cost and subsidy scenarios. The difference arises because the ZEV standards and gasoline price scenarios affect broader sets of consumers, who were considering purchasing fuel-inefficient vehicles.
Figure 6. Annual Transportation, Electricity, and Total Emissions Effects per Year per Additional PEV in Operation, Relative to Baseline
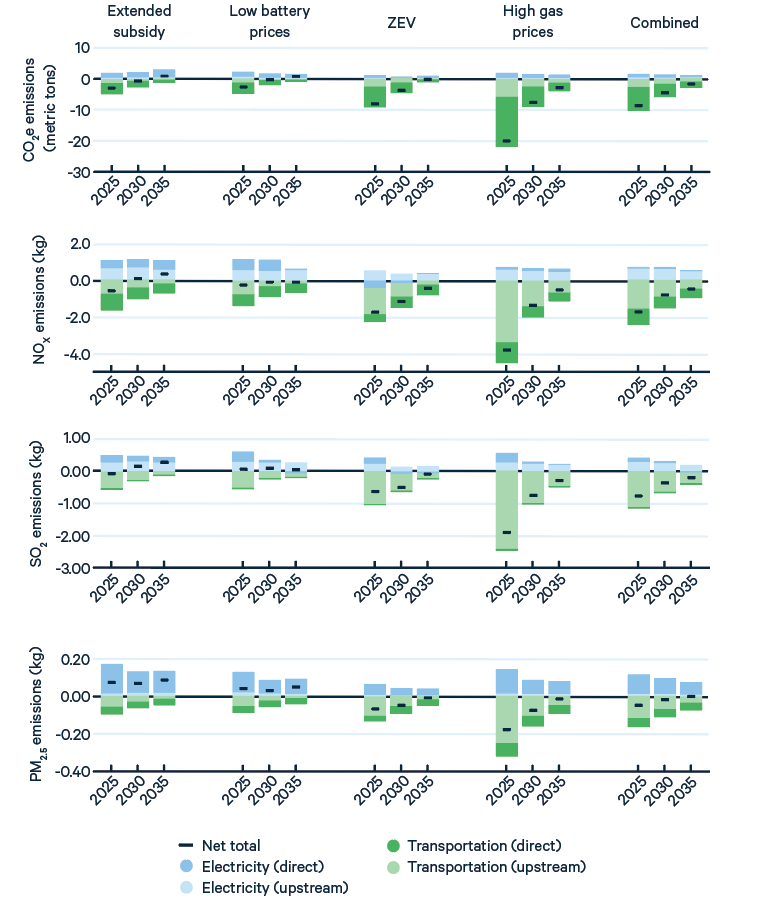
Unlike the other scenarios, the high gasoline price reduces emissions by causing consumers to buy PEVs instead of gasoline vehicles and to drive their gasoline vehicles fewer miles. Note that the overall emissions reductions from PEVs in this scenario arises more from the purchase effect than the driving effect, because miles traveled responds modestly to the gasoline price change.
These results illustrate that some policies and market conditions are likely to reduce emissions more than others. Consumer preferences play an important role in determining how much PEVs reduce emissions, which is consistent with Xing et al. (2021). In contrast, many other estimates of the climate and air quality effects of PEVs (e.g., Woody et al. 2022) make assumptions about which vehicles consumers would have purchased instead, without showing how the behavioral assumptions affect the results.
Less fuel efficient vehicles have higher CO2e emissions per mile driven, since CO2e emitted per mile is inversely proportional to fuel efficiency. Less fuel efficient gasoline vehicles also tend to have disproportionately higher NOx, SO2, and PM2.5 emission rates, mainly because they tend to be older; NOx, SO2, and PM2.5 emission standards have become more stringent over time. Similar to the effects on CO2e emissions, the other scenarios reduce total NOx, SO2, and PM2.5 emissions (or in a few cases cause them to increase by small amounts). The battery cost and extended subsidy scenarios increase emissions of these pollutants in some years, for reasons similar to those given in the discussion of the CO2e results: these scenarios cause substitution from relatively lower-emitting gasoline and diesel vehicles to PEVs, causing smaller reductions in tailpipe emissions per vehicle than the other two scenarios do. We discuss the NOX, SO2, and PM2.5 emissions changes more in the next subsection, in which we estimate the combined dollar value of their effects on mortality and illness.
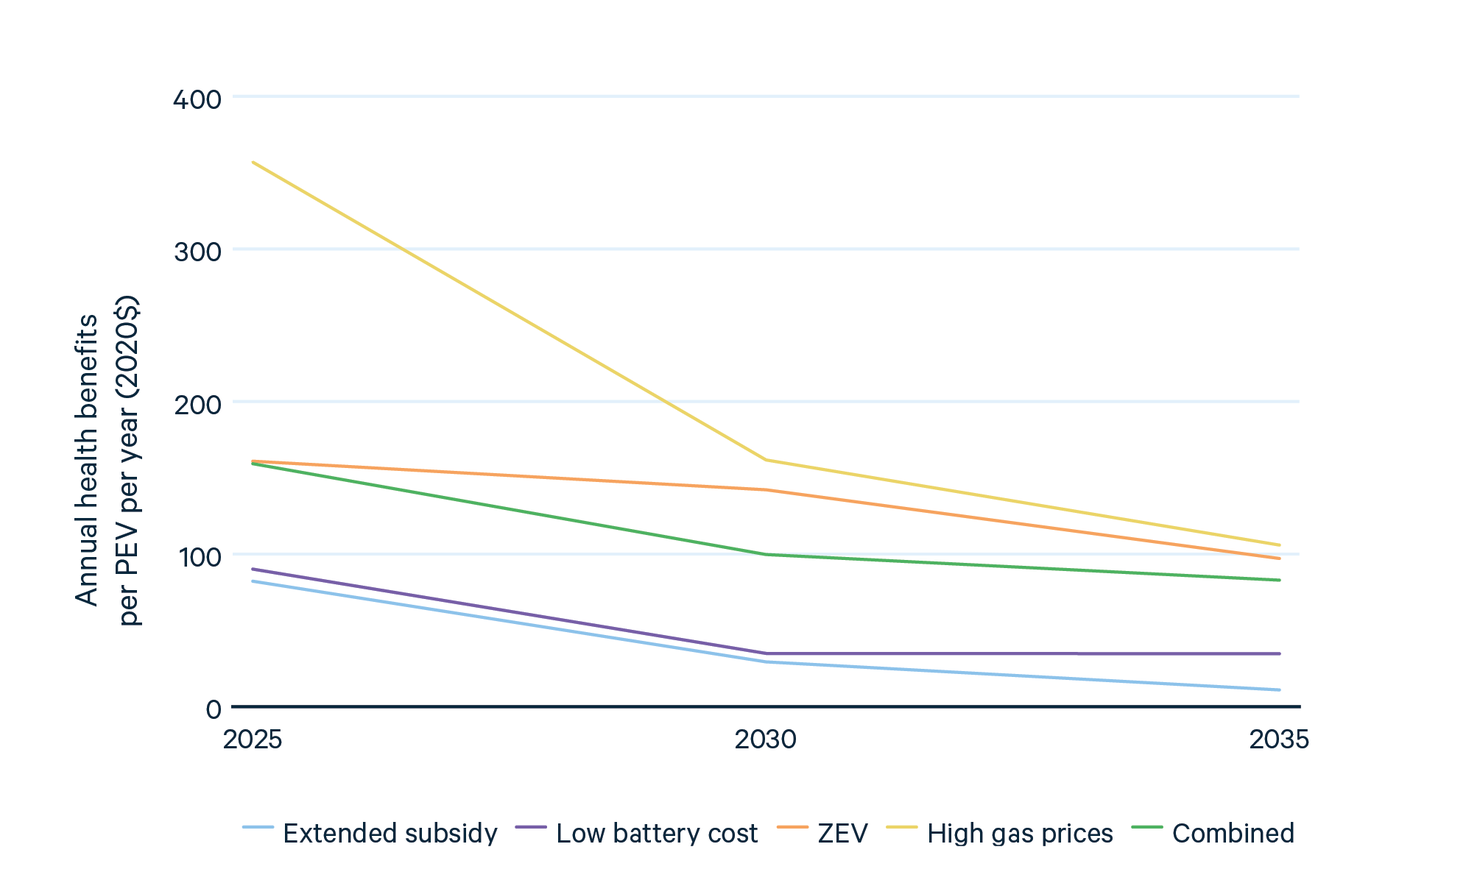
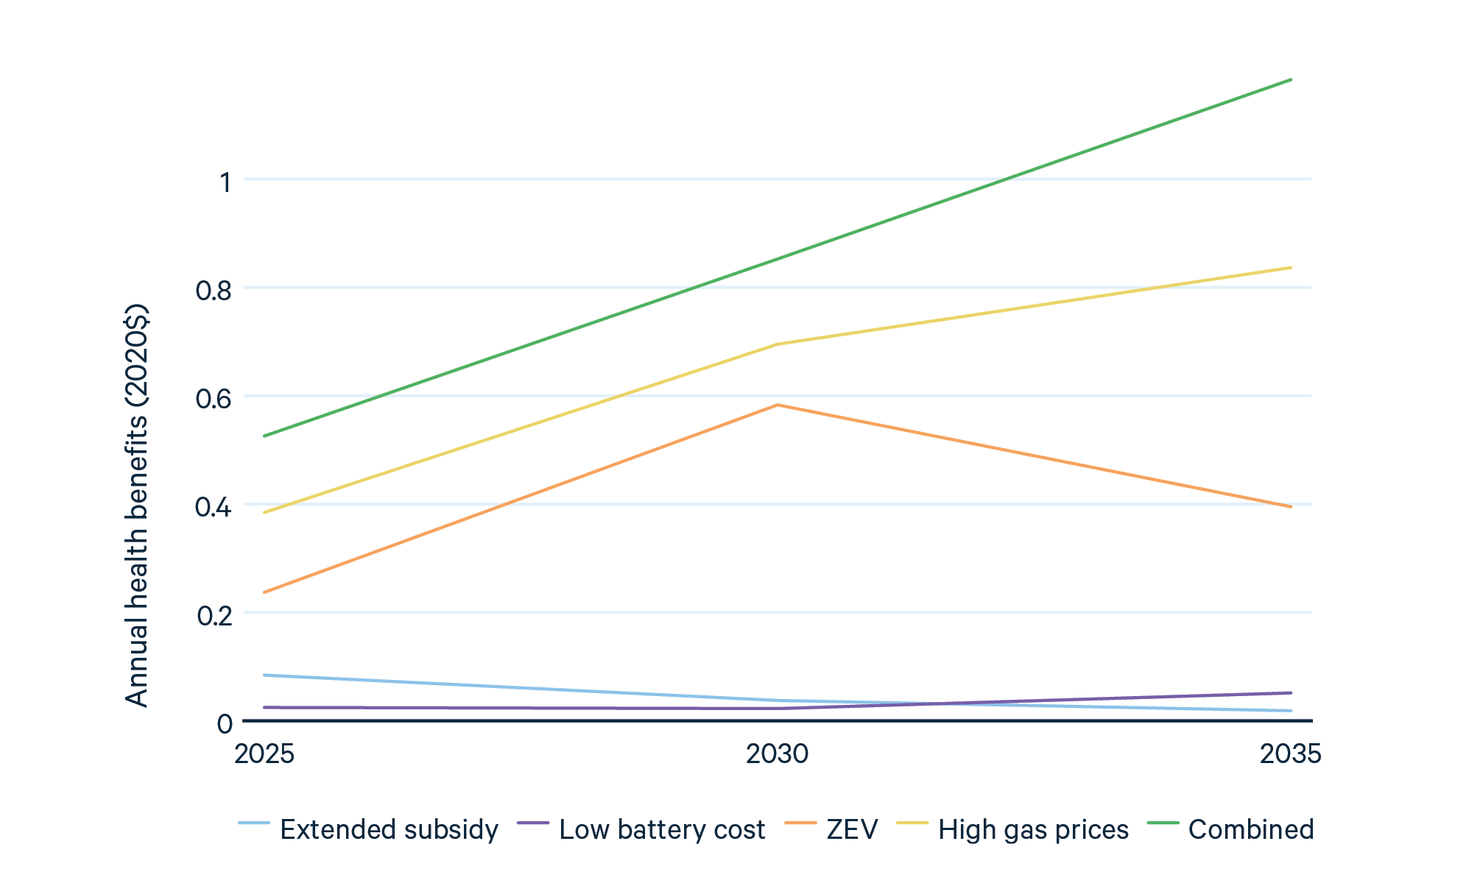
Figures 7 and 8 show the estimated annual net per-PEV climate and health benefits by year from 2025 to 2035 for each scenario, compared with the baseline scenario. Like the net emissions results in Section 4.3, these results include upstream and direct emissions from the transportation and electricity sectors. We estimate the dollar values of the emissions effects using the valuation methods described in subsections 2.3 and 2.4. To help interpret Figures 7 and 8, we explain one of the multi-part lines in Figure 7: The “Extended Subsidy” line indicates that an electric vehicle purchased by the beginning of 2025 as a result of the extended PEV subsidy produces an estimated annual climate benefit that is approximately $600 in 2025 and decreases to negative $200 in 2035, with a cumulative net estimated climate benefit of approximately $2,000 over those 11 years.
The annual benefits per additional PEV are highest in the high gasoline price scenario and second-highest in the expanded ZEV mandate scenario, for the reasons given above. Benefits per additional PEV decrease over time in all scenarios. The decrease occurs primarily because the stringency of the PEV policies does not change but the average fuel economy of all on-road gasoline vehicles increases in the baseline scenario as new fuel-efficient vehicles replace old, inefficient vehicles.
While Figures 6-8 show annual effects, Table 2 instead shows lifetime effects. It shows the estimated discounted present value of lifetime environmental benefits of each additional PEV purchased in 2022 compared with the baseline scenario, assuming the vehicle remains in operation for 15 years, and using a 2 percent real discount rate. In calculating these values, we assume that over their lifetimes, a fully electric vehicle charges 65,000 kWh and a plug-in hybrid vehicle charges 38,000 kWh (assumptions consistent with typical lifetime VMT and average kWh of charging per mile driven).
Figure 7. Net Annual Climate Benefits of Each Scenario, per Additional PEV in Operation, Relative to Baseline
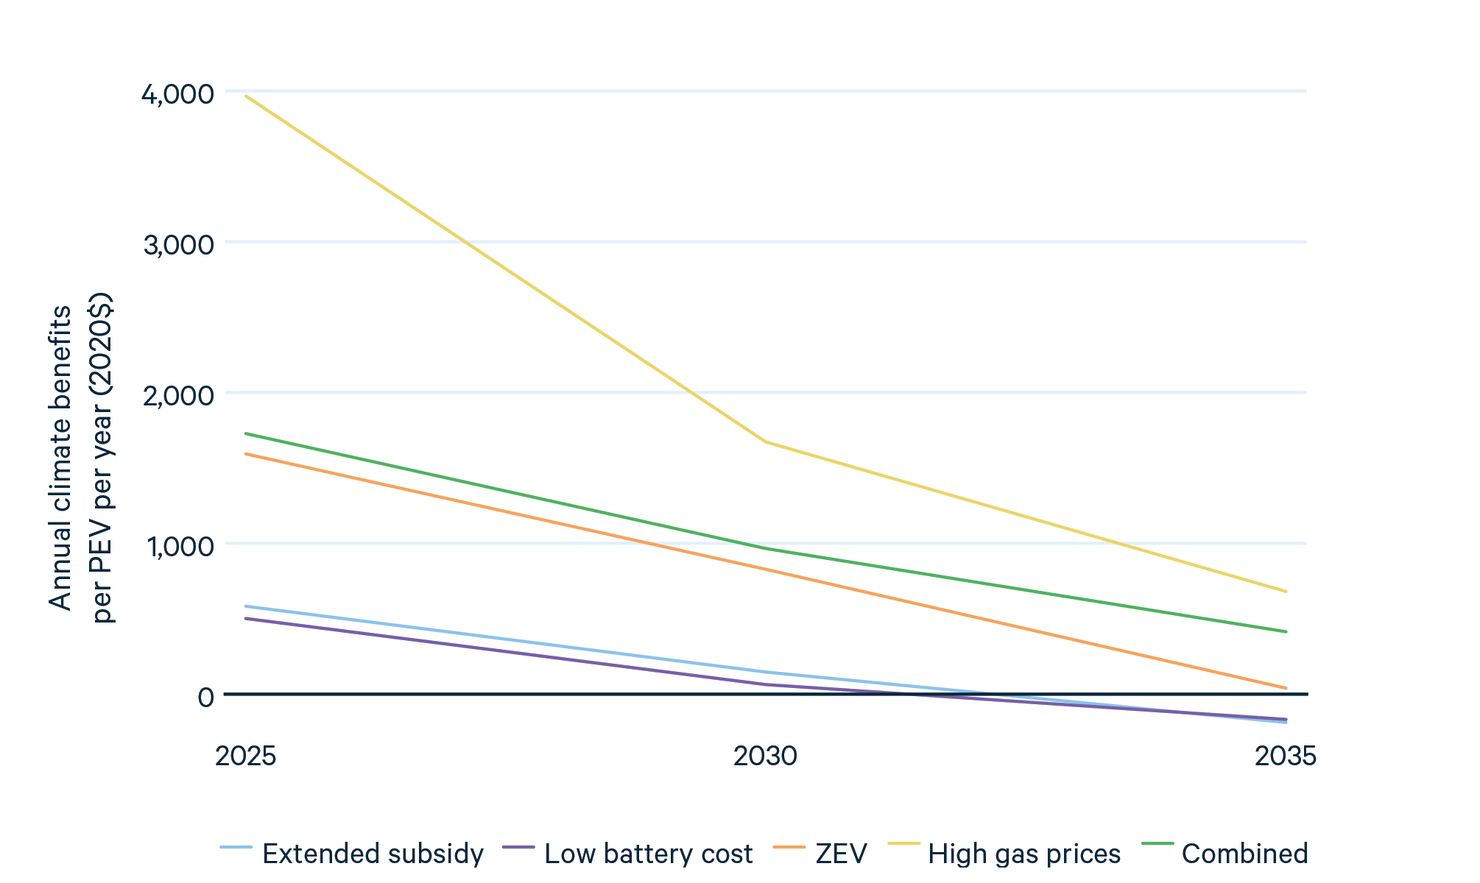
Figure 8. Net Annual Health Benefits of Each Scenario, per Additional PEV in Operation, Relative to Baseline
For all scenarios, the present estimated values of both climate and health benefits are positive. The net present value of lifetime estimated climate benefits per additional electric vehicle ranges from $3,100 to $34,000. The net present value of health benefits per additional electric vehicle ranges from $690 to $3,300. For each policy, the estimated climate benefits are three to 10 times larger than estimated health benefits. The extended subsidy of $7,500 per electric vehicles produces estimated net environmental benefits of $3,810 for climate and $687 for health, or approximately $4,500 in total, less than the $7,500 subsidy. This suggests that direct transportation sector and power sector emission reductions alone are not enough to justify a national subsidy of $7,500 per electric vehicle. However, as explained in the Introduction, there are other external benefits and costs of PEVs.
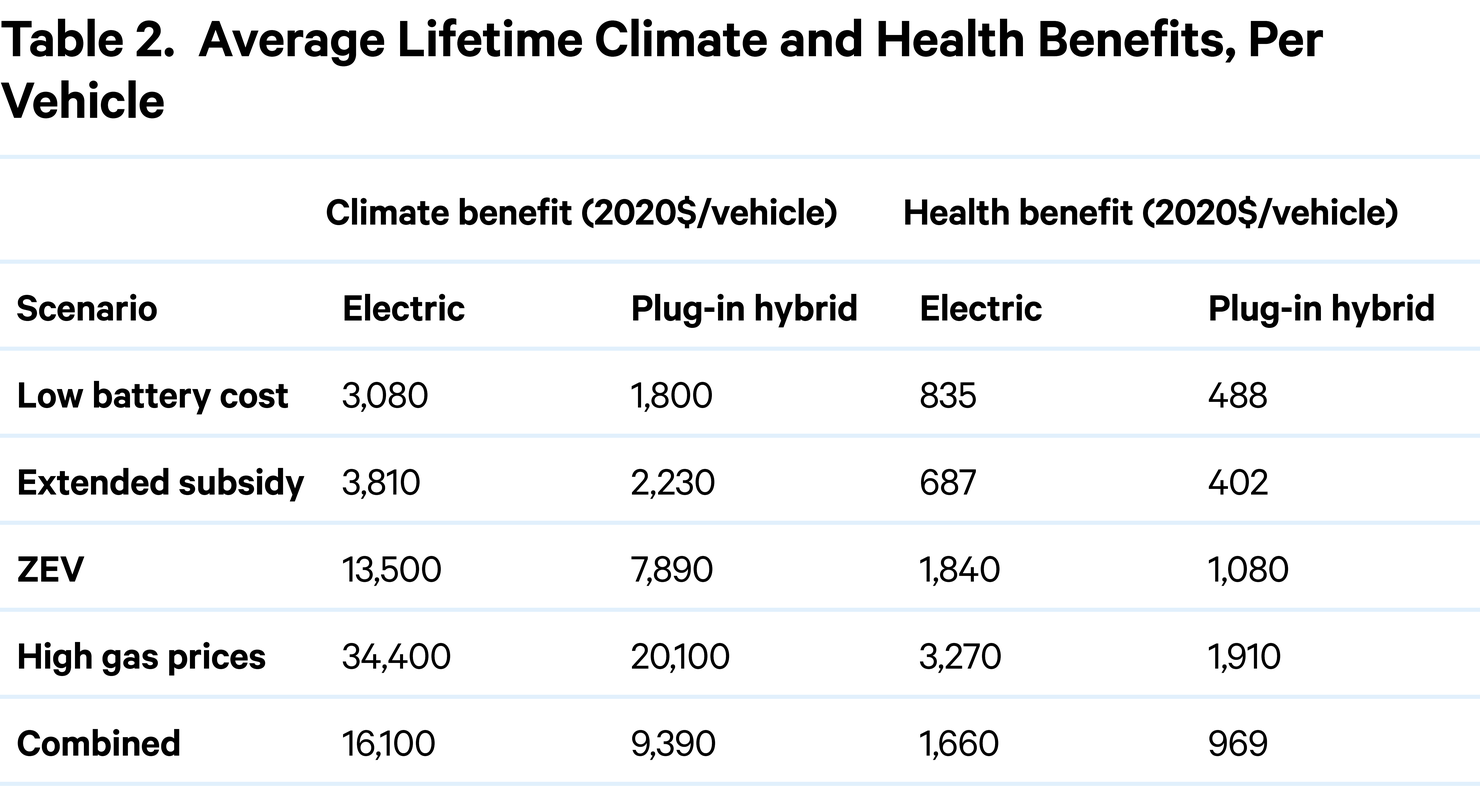
Table 2 shows the present value of net benefits for each scenario. For additional PEVs sold in 2022, the ratio of electricity emissions damages to reduced gasoline emissions damages, including upstream emissions, is 66 percent for the extended subsidy, 93 percent for the low battery cost, and 20 percent for the ZEV mandate.
These percentages can be compared with those in other studies. Woody et al. (2022a) reports an estimate that, in 2020, adding an electric vehicle instead of a similar new internal combustion vehicle would have resulted in a US national average CO2e power sector emissions increase over vehicle emissions decrease ratio of 42–46 percent. Daniels et al. (2022) report a current ratio of 32–40 percent, though they do not state their assumptions about the internal combustion vehicles displaced by electric vehicles. These ratios fall within the range of our estimates.
4.4. Total Net Environmental Benefits of PEVs
The preceding sections have presented average benefits per PEV, and in this subsection Figures 9 and 10 show total annual climate and health benefits. Total benefits are positively correlated with number of additional PEVs, and the combined scenario unsurprisingly yields the largest benefits, $5.7 billion to $8.3 billion per year (2020$). The high gasoline price scenario produces the next-largest benefits, followed by the expanded ZEV mandate. The extended subsidy and lower battery cost scenarios produce considerably smaller total benefits because of both the lower benefits per additional PEV and the fewer additional PEVs sold. In all five scenarios, annual total climate benefits (Figure 9) decrease between 2030 and 2035 because the additional PEVs are not enough to fully counteract the reduction in benefits per PEV. Total health benefits (Figure 10) decline in two of the scenarios, for the same reason.
Figure 9. Total Annual Estimated Climate Benefits, Relative to Baseline (Billion 2020$ per Year)
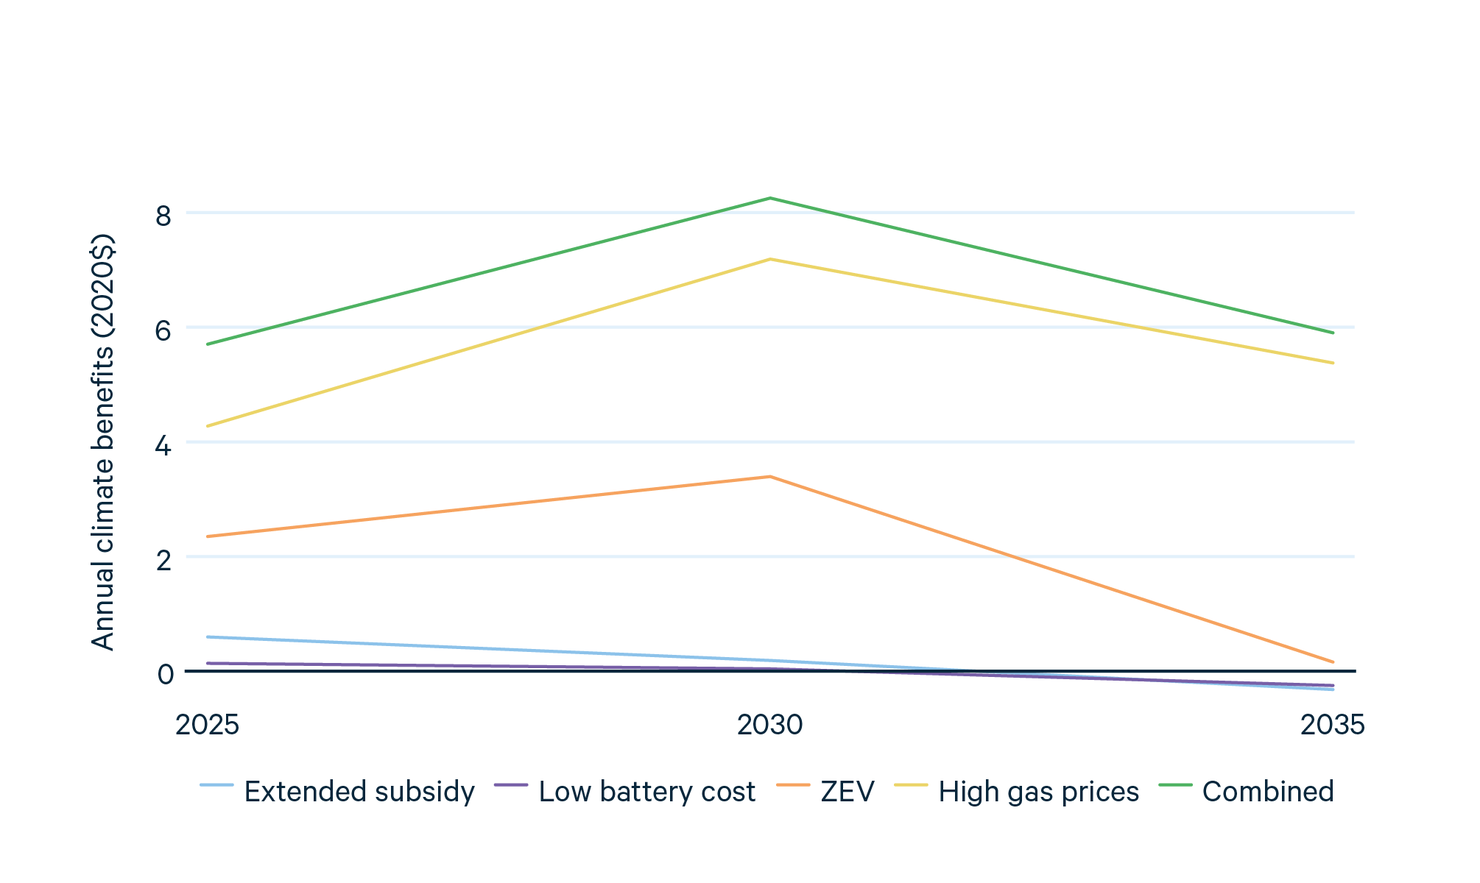
Figure 10. Total Annual Estimated Health Benefits of PEVs, Relative to Baseline (Billion 2020$ per Year)
4.5. Benefits of PEVs with Lower-Emitting Power Sector
The above results do not reflect any US electricity sector emission reduction policies adopted after the beginning of 2021. As noted above, this assumption may cause us to understate the benefits of PEVs. Consequently, it is useful to examine how policies that reduce power sector emissions affect the emissions benefits of PEVs.
The Inflation Reduction Act was enacted in August of 2022, and it includes several programs that will reduce electricity sector emissions, such as subsidizing wind and solar generator construction. Although we completed this analysis for this report prior to the law’s enactment, to illustrate the implications of electricity sector policies on the emissions benefits of PEVs, we report simulations that assume the passage of the CLEAN Future Act of 2021 (CFA).
The CFA is a CES that was proposed in the US Congress. It aimed to reduce GHG emissions by setting an enforceable, tradeable target for retail electricity suppliers to supply generation that is 57 percent clean in 2025, 75 percent clean in 2030, and 100 percent clean in 2035, where “clean” is defined as having an emissions rate below a benchmark CO2-equivalent GHG emissions rate. Generation earns credit in proportion to how far below the benchmark its emission rate is. As in the CFA bill, we use a decreasing benchmark carbon intensity of 0.82 metric tons per megawatt-hour in 2025 and 2030 and 0.4 metric tons in 2035. In our simulations, the US electricity supply achieves the CFA targets in 2025 and 2030, but in 2035, the clean electricity credit price is constrained by the CFA’s price ceiling of $54, resulting in a clean generation percentage of approximately 85 percent rather than 100 percent. The CFA does not completely eliminate coal-fueled power plants, partly because by 2035 it uses a lower benchmark emission rate that does not favor natural gas over coal. Nonetheless, the CFA reduces the US average electricity sector CO2 emissions rate by 25 percent in 2025 and 74 percent in 2035 compared with the baseline scenario without the CFA.
Table 3 reports climate and health benefits per PEV (similarly to Table 2), without and with the CFA in place. The CFA increases the benefits of PEVs but only slightly, even though it greatly reduces the average emissions rate of power generation.
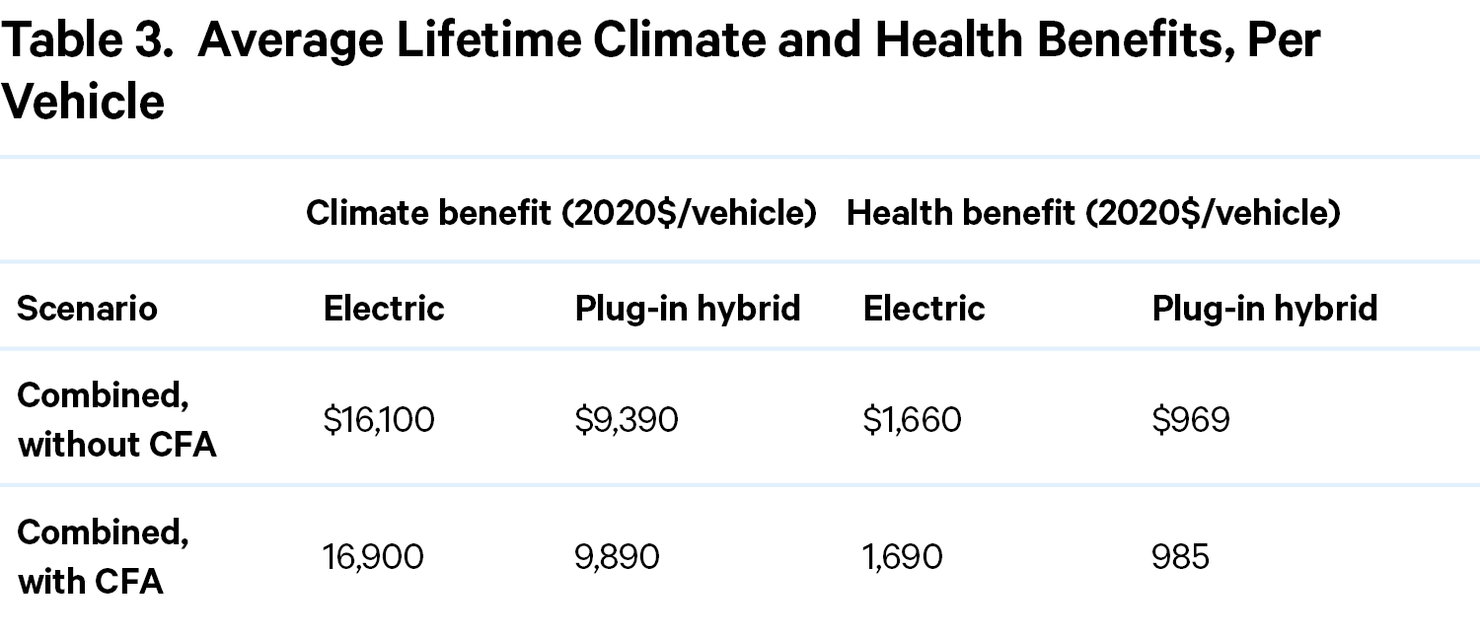
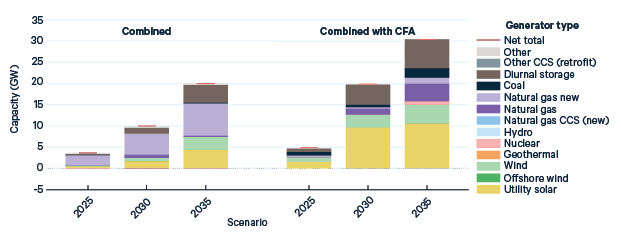
Figures 11 and 12 reveal the reason for this result. PEV charging with the CFA causes more incremental wind and solar generation than without the CFA. However, PEV charging with the CFA also causes more coal-fueled generation. Without the CFA, natural gas prices increase over time, which raises the profitability of coal-fueled generators, reducing the retirements of those generators. With the CFA, there is less coal-fueled capacity, but the profitability of more of the remaining coal-fueled capacity lies close to the threshold for retirement. Consequently, PEV charging has a larger (negative) effect on coal-fueled retirement with the CFA than without the CFA.
Figure 11. Effect of Combined Scenario on Capacity with Baseline Policy and with CLEAN Future Act of 2021
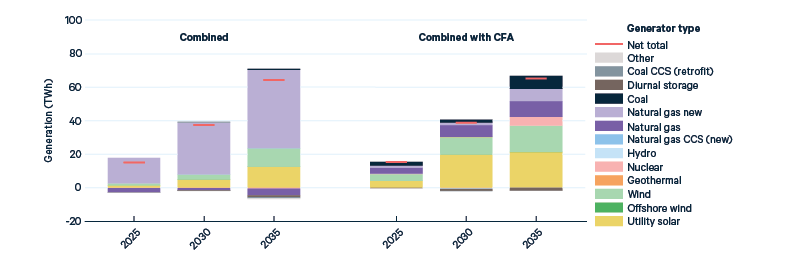
Figure 12. Effect of Combined Scenario on Generation with Baseline Policy and with CLEAN Future Act of 2021
Other clean generation policies could affect the environmental benefits of PEVs differently than the CFA does in our modeling. For example, a CES with a time-invariant benchmark emissions rate of 0.82 metric tons per MWh (rather than a declining benchmark as in the CFA) would result in less coal-fueled generation in 2035, and less scope for PEVs to increase coal-fueled generation. Furthermore, an electricity sector CO2 emissions cap could increase the environmental benefits of PEVs because the PEV charging would not affect total CO2 emissions. (The northeastern and mid-Atlantic ZEV states have such a program, the Regional Greenhouse Gas Initiative, which is present in our modeling.)
Economic and policy conditions may also affect the benefits of PEVs. For example, if future natural gas prices decline instead of increase, PEVs could increase coal-fired generation more without the CFA than with the CFA. The CFA would then increase the emissions benefits of PEVs by more than we estimate.
4.6. Effects of PEVs with Alternative PEV Charging Profile
There is uncertainty about how much of the charging of PEVs will occur in each hour of the day, known as the “daily charging profile.” The emissions intensity of additional PEV charging will depend largely on the extent to which PEV charging will be satisfied with additional wind and solar generation capacity rather than additional fossil fueled generation. That in turn depends on the daily charging profile, since the availability of wind and solar generators varies with the time of day.
An important variable in PEV charging is the extent to which it occurs overnight when additional electricity is inexpensive for the generation industry to produce, versus in the late afternoon when most driving commuters reach home. In most of the United States, the greatest generation scarcity occurs in the mid or late afternoon. As a result, a charging profile with more charging in the late afternoon is likely to result in a need for additional firm generation capacity, such as from additional fossil fueled generators or additional batteries. In this subsection, we examine the effects of such a charging profile, especially on the emissions intensity of charging additional PEVs.
The results presented so far in this paper use the charging profile from the Idaho National Laboratory EV Project (INL 2014), which aggregates real charging data from PEV owners in several US cities in 2013. The INL profile shows a relatively large share of charging in the evening and overnight. In this subsection, we will present results using an alternate charging profile, the light-duty electric vehicle charging profile in the NREL Electrification Futures (EF) study (Mai et al. 2020). Figure 13 shows these two daily charging profiles. The EF charging profile has more charging in the late afternoon than the INL charging profile does, and to a lesser extent has more charging earlier in the daytime (from 6 am onward) and in the early evening (until 7 pm). The times when it has less charging than the INL profile are from 7 pm through 5 am. The EF charging profile differs by state, so it is plotted as a range. See Appendix A2.2 for information on regional and temporal scaling of the charging profile. To study the effects of using the different charging profile, we run simulations using it.
Figure 13. Assumed Daily Charging Profiles of Plug-in Vehicles
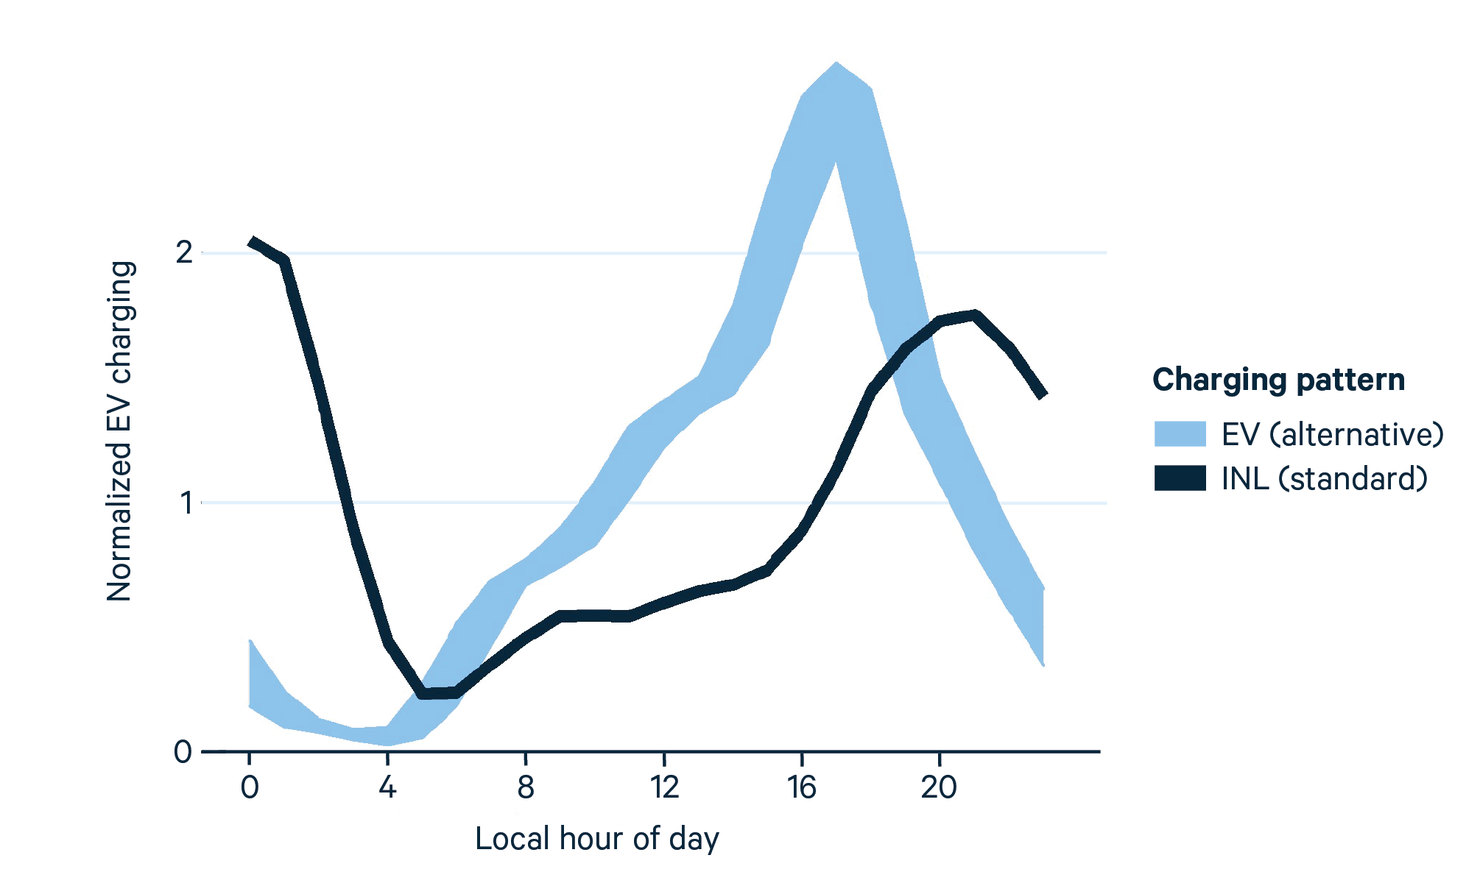
As mentioned above, the higher late afternoon charging in the EF daily charging profile is likely to necessitate more firm generation capacity. The main firm generation capacity types that can be built (or retired less) in the US are natural gas- and coal-fueled capacity and bulk electricity storage batteries. More batteries could also increase solar generation capacity and reduce coal-fueled capacity retirements, since batteries tend to increase the profitability of solar and coal-fueled capacity. As a result, changing the charging profile to one with more charging in the late afternoon could increase fossil fueled capacity, fossil fueled generation, electricity storage capacity, solar generation, or more than one of these. Such a change in the charging profile is likely to also reduce wind-powered generation capacity, since there tends to be wind at night in most of the US. The main purpose of this subsection is to test the extent to which changing to a charging profile with more late afternoon charging causes each of these changes and the extent to which it increases projections of the emissions associated with additional PEVs.
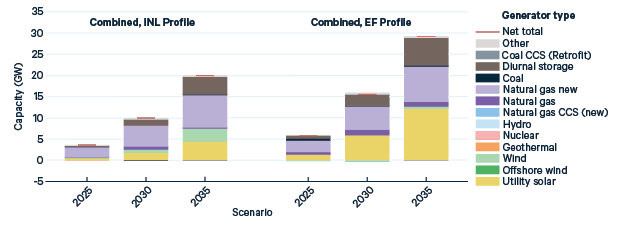
Figure 14 shows the effects of additional PEVs on generation capacity, with our standard (INL) and alternate (EF) charging profiles. Changing to the EF charging profile does indeed increase firm generation capacity, in the form of batteries, natural gas-fueled generators, and to a small extent coal-fueled generators. However, it also increases solar capacity, by more than three times as much as it reduces wind-powered capacity.
Figure 14. Effect of Combined Scenario on Generation Capacity, with Standard (INL) and Alternate (EF) Charging Profiles
Some of these capacity changes are likely to increase emissions and others are likely to decrease emissions. The larger amount of fossil fueled capacity could result in greater fossil fueled generation and greater emissions. However, Figure 15, which shows the effects of the additional PEVs on generation, shows that it does not in our modelling results. Instead, the added solar capacity increases solar generation enough to reduce natural gas–fueled generation.
Figure 15. Effect of Combined Scenario on Generation, with Standard (INL) and Alternate (EF) Charging Profiles
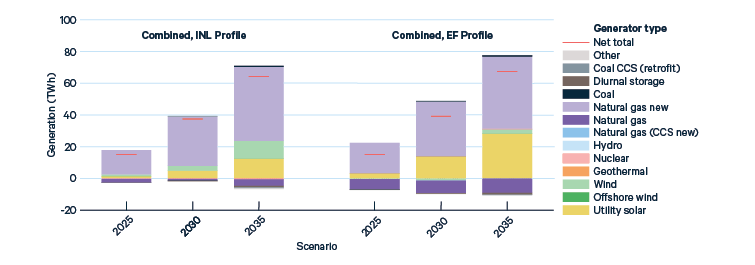
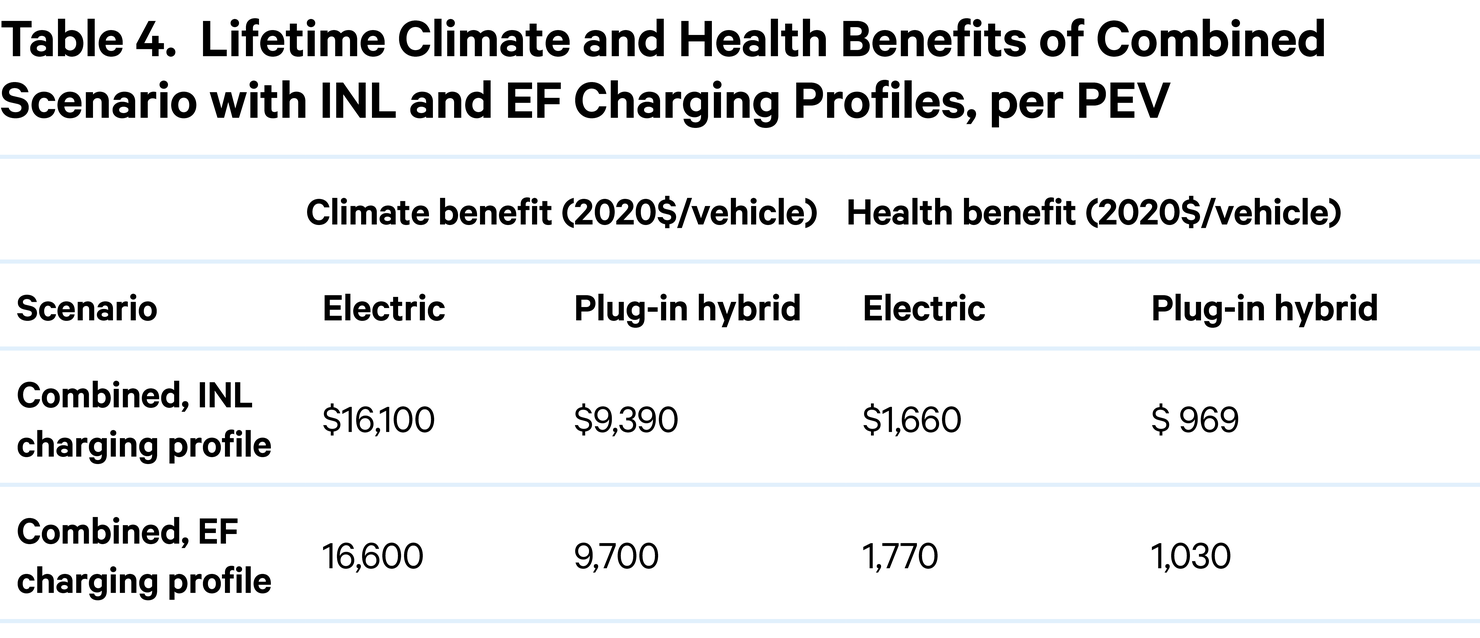
Table 4 shows that this reduction in natural gas-fueled generation translates into a reduction of estimated emissions damage. The small increase in coal-fueled generation is not enough to offset the reduction in natural gas-fueled generation. The combined scenario with the EF charging profile has a 2–3 percent greater climate benefit, and a 6–7 percent greater health benefit, than with the INL charging profile. This indicates that using the INL profile yields more conservative estimates of the climate and health benefits of PEVs.
Future charging profiles could be more favorable or less favorable for emissions reductions than the profiles considered here. Incentives to charge when low-emitting generation is on the margin can help.
5. Conclusions
The environmental benefits of PEVs are relevant to policymakers deciding how, and by how much, to incentivize them. Existing research on the environmental benefits of PEVs generally suggests that they reduce GHG emissions—especially in the future, as the electricity system’s reliance on fossil fuels diminishes. However, the existing estimates rely on assumptions about electricity sector emissions and consumer behavior, rather than estimating how vehicle consumers and the electricity sector will respond to future market and policy conditions. The literature has also failed to quantify the economic value of the emissions changes, making it difficult for policymakers to choose incentive levels.
We combine models of light-duty vehicles, electricity generation, and air pollution to predict how consumers, vehicle manufacturers, and the electricity sector respond to market and policy conditions that increase PEV penetration, and we quantify the resulting environmental benefits. The light-duty vehicle model characterizes how purchases of PEVs between 2020 and 2035 are affected by various factors, such as purchase subsidies, ZEV standards, battery costs, and gasoline prices. The model accounts for manufacturers’ choices of vehicle prices and introduction of new electric vehicles. The electricity sector model estimates the effects of the additional PEV charging, including changes in generator investments, retirements, and operation, and changes in emissions. For each scenario, we then estimate the economic value of changes in air quality and climate.
The estimated lifetime climate benefits per additional PEV sold in 2022 vary substantially across scenarios, from $3,100 to $34,000 per additional PEV. The lifetime US health benefits vary from $690 to $3,300 per additional PEV. The lower-cost battery and extended subsidy scenarios yield lower climate benefits largely because they induce consumers to substitute from relatively fuel-efficient gasoline vehicles to PEVs, whereas the ZEV standards and gasoline prices create broader signals for consumers to shift from relatively inefficient gasoline vehicles to PEVs. Another reason for the high effectiveness of the ZEV standards is that they increase PEV sales in states with policies and generator types that reduce emissions from additional electricity generation.
Our modeling projects that the environmental benefits of PEVs will be lower in later years, as indicated by the downward sloping benefit curves in Figure 7 and Figure 8. Benefits of PEVs diminish over time because the emissions rates of the gasoline vehicles they replace decrease over time, and this occurs more quickly than the declining power sector incremental emissions rates associated with PEV charging.
Because our approach isolates the effects of additional PEVs on emissions without including interactions with GHG standards, the results are relevant to the Environmental Protection Agency’s crediting for PEVs in the GHG standards. Our estimates of electricity emissions can help the agency if it decides to include electricity emissions in assessing compliance with passenger vehicle GHG standards, as it has implied it will as PEV market shares increase.
We note a few additional caveats, which point to possible directions for future research. First, we do not include the indirect emissions effects that would result globally from the increased learning-by-doing that PEV manufacturers would gain from producing more PEVs for the US market.
Second, we analyze the emissions benefits per PEV because of the relevance to certain policy decisions. Market failures associated with new technologies further justify subsidies for PEVs. For example, if there are learning spillovers in battery manufacturing, firms may underinvest in learning, and subsidies would increase social welfare (Linn and McConnell 2019). We are not aware of estimates of the magnitude of these market failures and effects, which future research could quantify.
Third, we do not explicitly model the federal GHG standards for new passenger vehicles. Because this approach allows us to isolate the effect of PEVs on emissions, without including interactions with GHG standards, the results are relevant to the Environmental Protection Agency’s crediting for PEVs in the GHG standards. See Linn (2022) for analysis of emissions reductions from PEVs accounting for interactions among PEV subsidies, ZEV program, and federal GHG standards.
Fourth, although our analysis includes upstream emissions from fuel production, our results do not reflect emissions associated with producing vehicles and new power plants. However, this caveat applies to both fuel and vehicle production, and ignoring them for one sector partially offsets the effect of ignoring them for the other sector. Furthermore, past studies have found that the emissions associated with manufacturing a vehicle, even an electric vehicle, are a small proportion of the life-cycle emissions of a gasoline vehicle—16 percent in the United States, according to Bloomberg New Energy Finance (2021). The emissions associated with building the generators account for a similarly small proportion, 10–20 percent of life-cycle power generation emissions in the United States (Gençer et al. 2020). Future work could incorporate emissions from vehicle manufacturing and power plant construction in the analysis.
Finally, the light-duty model includes dynamics in PEV entry but not consumer demand. In the model, manufacturers decide whether to introduce new vehicles to the market based on expected profits and entry costs. Profits may increase over time because of declining battery costs, and entry costs decrease over time because entry costs are assumed to decline with the manufacturer’s cumulative historical entry (which incorporates learning-by-doing in vehicle design). Entry causes market shares of PEVs to increase, but consumer preferences for fuel costs and PEVs do not vary over time. Future work could include dynamics in consumer preferences.
Authors

Christoph Funke
ETH Zürich


Steven Witkin
Former Research Analyst