Insurance Availability and Affordability under Increasing Wildfire Risk in California
An issue brief providing background and analysis of California’s wildfire insurance coverage as wildfires are becoming more frequent and damaging across the western United States
1. Introduction
In the past several decades, large wildfires in the western United States have become more frequent and more severe. Although many wildfires take place in forested areas far from where people live and work, some recent fires have had devastating consequences for communities. The 2018 Camp Fire, for example, caused 85 deaths and destroyed nearly 19,000 properties in the town of Paradise, California. Of the top 10 fires in insured losses in the United States, eight have occurred since 2017.
Insurance is an important tool for recovering from natural disasters, including wildfires. Unlike floods, which are covered through separate flood insurance policies, wildfire damage is covered primarily through standard property and casualty insurance policies (homeowners and renters insurance). Homeowners insurance policies cover damage to the property itself, loss of contents, such as furniture, clothing, and other personal items, and sometimes additional living expenses if a house is destroyed. Lenders require that any home with a mortgage have homeowners insurance.
California’s growing wildfire risks have created challenges for its insurance markets in recent years, characterized by rising premiums and deductibles, declines in coverage, and sometimes even policy discontinuance (Dixon et al. 2018). When homeowners are unable to obtain insurance through the private market, they can turn to the state’s Fair Access to Insurance Requirements (FAIR) Plan, a pool made up of all insurers authorized to operate in the state. Thirty-three states and the District of Columbia have FAIR Plans, which are generally considered insurers of last resort. In California until 2016, homeowners had to show that they had been turned down by three private insurance companies before they could get a FAIR Plan policy. FAIR Plan policies tend to be high cost and provide substantially less coverage than standard policies. For example, they typically do not offer liability coverage.
In this issue brief, we provide background information and analysis of insurance coverage in California, including policy nonrenewal rates, the number of FAIR Plan policies in force, and average premiums for both private insurance and FAIR Plan policies. We analyze these data at the ZIP code level for 2003–2019 and provide summaries of insurance outcomes by wildfire risk classifications to better understand the extent of the problems in high wildfire risk areas vis-à-vis other areas of the state. Finally, we analyze insurance nonrenewals by four alternative measures of social vulnerability.
2. Background: Wildfire Risk and Insurance in California
Insurance coverage for damage from wildfire in California may be obtained in three ways. Most households cover their primary residence through standard homeowners insurance policies provided by insurers in the “admitted” market, which are those that follow a state’s department of insurance rules and regulations. Claims filed with them will be covered by a state’s guaranty fund if the company fails, and homeowners who believe a claim has not been handled properly can appeal the decision with the state department of insurance. When homeowners are not able to find coverage in the admitted market, they might purchase a policy from the excess or surplus line market, which contains insurers that are not regulated by the state. Surplus line policies tend to be more expensive and are generally less preferred; they make up a very small proportion of total policies. Last, households who cannot find coverage through these traditional markets can get basic fire coverage through a FAIR Plan policy, which is mandated by the state and backed jointly by all admitted insurers in the state. FAIR Plan policies tend to be significantly more expensive for the limited coverage they provide because the properties covered tend to be high risk. Therefore, the FAIR Plan is an option of last resort by design and in practice.
We examine two main datasets obtained from the California Department of Insurance (CDI). The first includes ZIP-code-level information on insurance take-up and total premiums collected from 2003 to 2018. This information comes from insurers who wrote $1 million or more in total premiums and covers the vast majority of the voluntary market (excluding surplus line policies) and FAIR Plan policies. The second dataset includes information on ZIP-code-level renewed and nonrenewed policy counts during 2016–2019. The nonrenewal data are separated into insured (initiated by the policyholders) and insurer (initiated by the insurance company). We merge ZIP-code-level observations with five-digit ZIP Code Tabulation Area (ZCTA) to map and measure wildfire hazard faced by properties in each ZIP code. Whereas ZIP codes represent postal routes and thus have no defined spatial boundaries, the US Census Bureau created ZCTAs as generalized areal representations of ZIP codes. ZCTAs cover only populated areas and were designed to represent ZIP codes that are assigned to census blocks. The ZCTA code is usually the same as the ZIP code for an area. We use a crosswalk developed by John Snow, Inc. for this conversion; see https://udsmapper.org/zip-code-to-zcta-crosswalk/ for more information.
To examine how insurance conditions are correlated with fire hazard, we classify each ZIP code into categories based on the average Wildfire Hazard Potential (WHP) in the corresponding ZCTA. WHP is a measure of wildfire hazard from the USDA Forest Service that uses satellite data, wildfire simulation models, and historical wildfire ignition locations to quantify the relative potential for large and difficult-to-contain wildfires at any point on the landscape. Using the 2020 WHP data set, The 2020 WHP data are the most recent available at the time of publication. This data set uses satellite vegetation mapping from the 2014 LandFire data release; changes in fire hazard due to changes in vegetation as a result of fires or other disturbances since 2014 may not be reflected in the 2020 data. Information is available at https://www.fs.usda.gov/rmrs/datasets/wildfire-hazard-potential-united-states-270-m-version-2020-3rd-edition. we calculate the mean WHP within each ZCTA. We then categorize each ZIP code as “very high,” “high,” “moderate,” “low,” or “very low” fire hazard according to breakpoint values from Dillon et al. (2015). Wildfire hazard categories correspond to the following percentile ranges for WHP within the United States overall: very low (0–44), low (44–67), moderate (67–84), high (84–95), and very high (95–100). Our spatial analyses use ZCTA-level data, but for simplicity, we use “ZIP code” throughout.
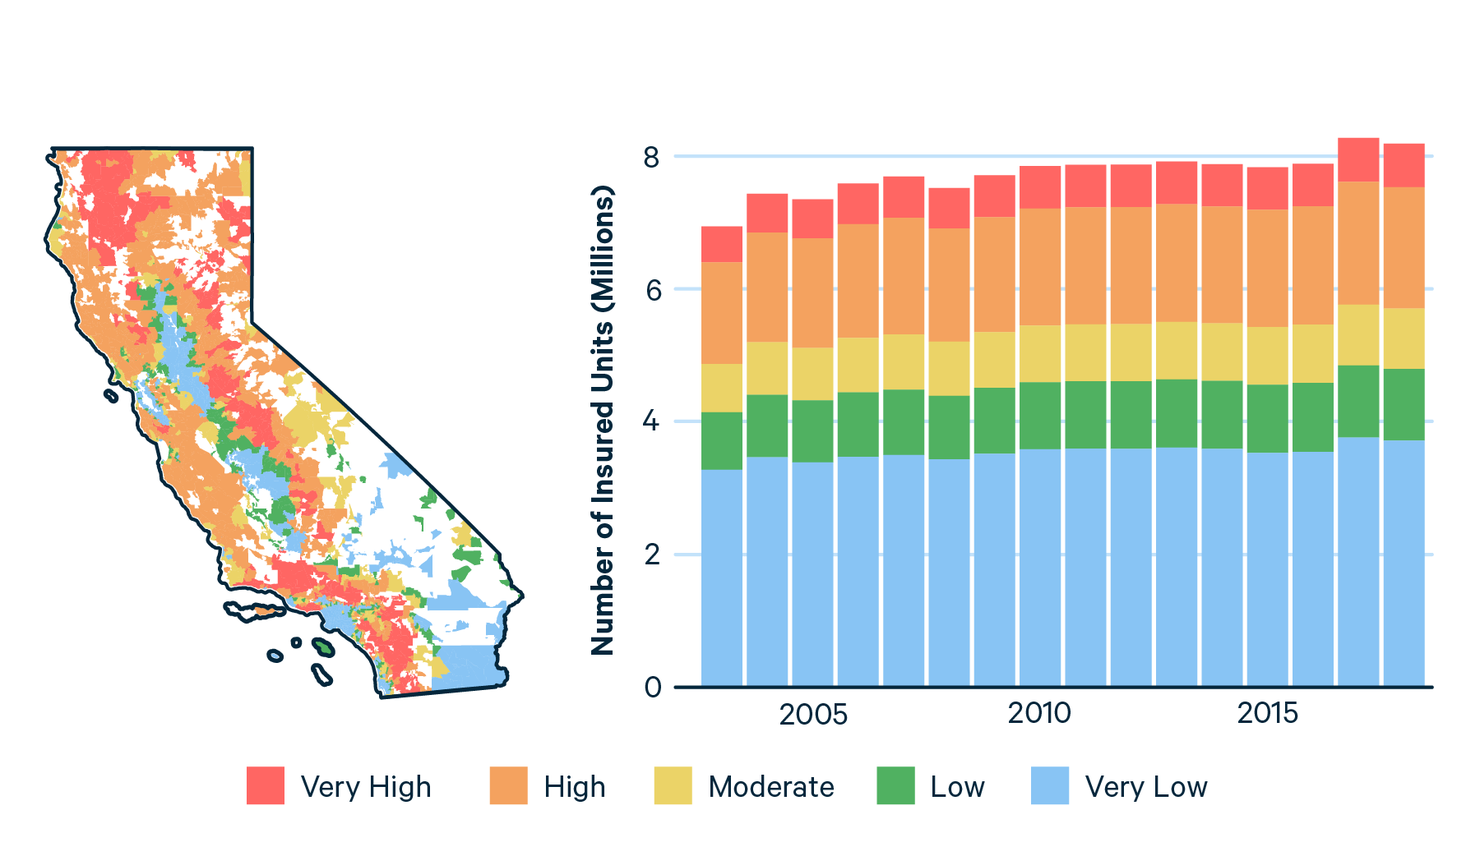
The left panel of Figure 1 shows California ZIP codes colored according to risk category. The white areas are unpopulated and not included in the data. A large share of land is at relatively high risk for wildfire, as represented by the red and orange areas; the ZIP codes with very high and high risk account for 22 percent and 41 percent, respectively, of the total land area. These areas are typically suburban or rural; many have medium- or low-density development mixed with vegetation and include the area commonly known as the “wildland-urban interface” (WUI). About a quarter of the land area is in ZIP codes with low and very low risk, but those tend to be much more populous urban locations. The major metropolitan areas, such as the San Francisco Bay Area, Los Angeles, San Diego, and the Central Valley, are generally considered low and very low risk. The distribution of population is reflected in the composition of insurance policies (right panel of Figure 1). Across 2003–2018, as the number of housing units insured has grown in all risk categories, more than half of all insured units have consistently been in the low and very-low-risk ZIP codes. However, the approximately 2.5 million insured units in high-risk and very-high-risk ZIP codes have made up roughly 30 percent of insured units over this timespan.
Figure 1. The Number of Housing Units Insured in California by Fire Risk Category, 2003–2018
3. Insurance Availability and Affordability
In 2017, a CDI report documented an increase in consumer complaints on both renewal issues and premium increases over the 2010–2016 period (Cignarale 2017). In 2018, California experienced its most destructive wildfire season in history—insured losses totaled $12 billion —which may have exacerbated the situation. In this section, we examine both the long-term trends and recent conditions of insurance availability and affordability.
For availability, we examine two aspects of insurance market conditions: (1) nonrenewals and (2) take-up of FAIR Plan policies. For both, we analyze the number of nonrenewals in a given year as a share of total policies in force in the previous year. About 10 percent of policies are discontinued by the insured (homeowners and renters) each year, which could be due to homeownership change or households switching insurance companies. Fewer policies are discontinued by insurers, averaging 2.3 percent over 2016–2018 and rising to more than 3 percent in 2019. When insurers initiate nonrenewals, households often must look for alternative options that are costlier and/or provide less coverage.
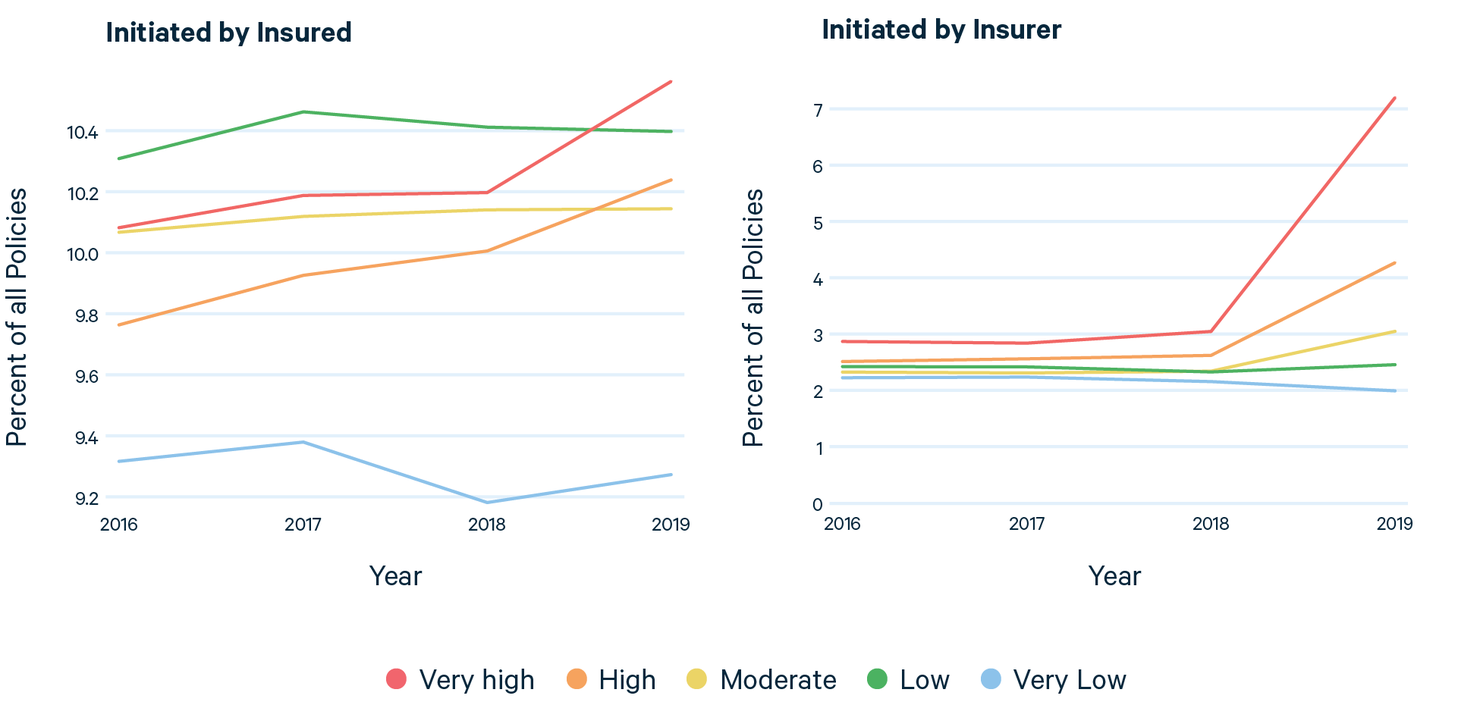
The left panel of Figure 2 shows that the rate of nonrenewals by the insured remained stable over the four-year period for ZIP codes with moderate, low, and very low wildfire risks but trended slightly upward in high-risk and very-high-risk ZIP codes. The right panel of Figure 2 reveals that insurer-initiated nonrenewal rates have been consistently higher in ZIP codes with higher risk. Furthermore, between 2018 and 2019, the rate of insurer-initiated nonrenewals in very-high-risk ZIP codes jumped by more than 4 percentage points, to 7.3 percent. High- and moderate-risk ZIP codes also saw increases, to 4.3 and 3 percent, respectively. Nonrenewals in low-risk and very-low-risk ZIP codes stayed constant and declined slightly, respectively. The sharp increases in the relatively higher-risk areas were likely a response to the catastrophic losses in the 2018 wildfire season.
Figure 2. Insurance Nonrenewals Initiated by Insurers in California by Fire Risk Category, 2016–2019
In 2020, a one-year moratorium took effect on insurer nonrenewals in ZIP codes within or adjacent to a fire perimeter and after a declared state of emergency. Because this is after the period of our data, we are unable to assess its impact. However, a December 2021 CDI report shows that insurer-initiated nonrenewals in these ZIP codes dropped by 20 percent between 2019 and 2020 compared to 2.5 percent in all other ZIP codes (CDI 2021). Data from 2021 are not yet available, to our knowledge.
Figure 3 maps the 2019 insurer-initiated nonrenewal rate by ZIP code, showing significant differences across locations: it was more than 20 percent in many ZIP codes in eastern San Diego County and on the western slope of the Sierra Nevada Range and more than 10 percent in the Shasta Cascades region but quite low in most urban centers and coastal areas. We top-coded the values to highlight variation in the plot: the 11 ZIP codes colored as bright yellow had nonrenewal rates exceeding 30 percent. In general, the map illustrates that a substantial fraction of households in some communities were dropped. Appendix Figure A1 presents a companion map showing the absolute number (rather than the rate) of 2019 insurer-initiated nonrenewals, which indicates a prevalence in a similar set of locations but highlights higher numbers in more populous areas.
Figure 3. Map of Insurer-Initiated Nonrenewal Rate in California in 2019 by ZIP Code

Next, we turn to FAIR Plan policy take-up as an indicator for the number of households unable to find traditional coverage. Figure 4 plots the time series of two measures of the market share of FAIR Plan policies within each fire risk category. The left panel shows the percent of all insured units covered by FAIR Plan policies, and the right shows the percent of premiums collected from FAIR Plan policies.
In the early 2000s, more than 5 percent of units in the very-low-risk ZIP codes were covered by FAIR Plan policies, which was higher than all other risk categories. As the blue line shows, this share dropped significantly in 2007 and continued to decrease to below 2 percent in 2018. In contrast, the red line shows that the share of FAIR-Plan-insured units in very-high-risk areas was initially around 2 percent but grew to more than 3 percent by 2018. The FAIR Plan market share stayed relatively low in the rest of the ZIP codes, with a slight upward trend in the high-risk category as well.
The right panel shows that in 2003, the FAIR Plan only accounted for about 1.7 percent of the premiums collected in the very-low-risk ZIP codes despite being more than 5 percent of policies. The very-high-risk ZIP codes, on the other hand, collected about 3 percent of the premiums and accounted for 3 percent of all policies. This difference across risk categories indicates that average FAIR Plan premiums are much higher in very-high-risk ZIP codes, a fact we explore further below. When the market share is based on premium, we see a similar divergence between the very-high-risk and very-low-risk ZIP codes, but the upward trend within high-risk ZIP codes is also more pronounced.
To measure insurance affordability, we calculate the average annual cost of insuring a housing unit for each fire risk category and adjust premiums to 2018 dollars. For the inflation adjustment, we use the “Annual Average Consumer Price Index Retroactive Series” based on all items from the Bureau of Labor Statistics. The insurance data contain information on premiums collected but not characteristics of the units insured. Therefore, if buildings in high-risk areas are more expensive than those in low-risk areas, they might have a higher insurance cost due to higher building value. We cannot disentangle higher values from higher risks as causes of the differences in the level of the premium. Nevertheless, the trend in premiums over time still provides meaningful insight into how insurance affordability has changed.
Figure 4. Market Share of FAIR Plan Policies in California by Fire Risk Category, 2003–2018

Figure 5 presents the average premium (in 2018 US dollars) for standard homeowners insurance policies between 2003 and 2018 in the left panel and FAIR Plan policies in the right panel. The latter are cheaper on average because their coverage is more limited: in 2018, the state average annual premium was $1,095 for homeowners insurance and $663 for the FAIR Plan. Overall, premiums have been relatively stable for homeowners insurance in real terms since 2003. However, in recent years, premiums in very-high-risk areas increased and those in low-risk areas decreased slightly (see Table 1 for a summary of the overall percent change over the 16-year period). FAIR Plan premiums have been increasing steadily since 2011, and the increase is much faster in dollar terms in higher-risk areas. The average cost of FAIR Plan policies for a unit in the very-high-risk areas was $700 in 2003. By 2018, it was $1,098, higher than the cost in the low-risk areas, which have much more comprehensive coverage.
Figure 5. Average Annual Premium per Unit in California, by Fire Risk Category, 2003–2018

Table 1. Premium Increase Percentage, 2003–2018, in California

In summary, we find a sizable surge in insurer-initiated nonrenewals in 2019 and a longer-run trend of increasing FAIR Plan policy take-up since 2010. We also find that FAIR Plan premiums have been increasing at a faster rate than standard homeowners insurance premiums, especially in ZIP codes with high fire risk. Together, the evidence suggests that the availability and affordability of homeowners insurance have been on the decline in the past decade but further worsened beginning in 2018, a year of catastrophic wildfires.
4. Geography and Demographics
This section addresses how the nonrenewal rate varies by geography. First, we overlay wildfire risk with nonrenewal rates to see the correlation between risks and nonrenewals by area of the state. Second, we analyze how nonrenewal rates in high-risk ZIP codes vary with community demographic characteristics. Identifying the demographic distribution of insurer-initiated nonrenewals is important for understanding the extent to which nonrenewals are harming vulnerable populations. Relationships between various demographic variables and nonrenewal rates could be driven by multiple factors, including bias in insurer decisionmaking or underlying correlations between community demographics and wildfire risk (see e.g., Wibbenmeyer and Robertson 2022).
Figure 6 shows a map with a bivariate color scale; the pink shades represent wildfire risk in the ZIP code, light blue shades represent the insurer-initiated nonrenewal rate in 2019, and dark blue shades indicate that a ZIP code has both high risk and a high nonrenewal rate. The breaks that define the shades are the 33rd and 67th percentiles of each variable. A large percent of lands with the highest risk are dark blue, most notably in the coastal mountain ranges of Southern California, the western slope of the Sierra Nevadas, and northern California’s Shasta Cascades region. Other areas have high risk but relatively low nonrenewal rates (shown in pink), mainly along the coastal range from the Central Coast through the North Coast (north of San Francisco). Overall, however, the patterns suggest that high-risk areas tend to have high nonrenewal rates, consistent with our findings in Figure 2.
Figure 6. Bivariate Map of Insurer-Initiated Nonrenewals and Wildfire Risk in California in 2019

Next, we examine how the insurer-initiated nonrenewal rate correlates with the demographics of the communities. We focus on only the 705 ZIP codes that have high and very high risk, because our findings suggest that insurance availability and affordability issues are more concentrated in these areas and our objective is to understand whether these areas also differ in their demographic characteristics. This restriction excludes most urban areas and selects a set of ZIP codes more similar and comparable to each other in terms of development density. For the demographic variables, we obtain data at the Census tract level from CalEnviroScreen 4.0 (CES), California’s mapping tool for identifying disadvantaged populations. We aggregate these data to the ZIP code level for this analysis.
Figure 7 shows the bivariate maps of nonrenewal rate with four demographic variables. The top left panel features the population characteristic score, which is a composite score representing vulnerability based on education, linguistic isolation, poverty, unemployment, and housing burden for low-income populations. Three vulnerability metrics are measured as the percent of the population that is a) over age 25 with less than a high school education (Education), b) living below twice the federal poverty line (Poverty), or c) over age 16, unemployed, and eligible for the labor force (Unemployment). Linguistic isolation is measured as the percent of limited English-speaking households. Housing burden is the percent of households in a census tract that are both low income (making less than 80 percent of the Housing and Urban Development area median family income) and severely burdened by housing costs (spending more than 50 percent of their income on housing). The other component of CalEnviroScreen is a measure of the pollution burden, which is created from information on air and water pollution, toxic releases, hazardous waste cleanup sites, traffic, and lead in homes. Because these problems are generally more urban, we restrict our analysis to the population characteristics variables. The other three panels feature poverty, percent of the population that is people of color (identifies as other than non-Hispanic white), and housing burden. The darkest blue areas have both the highest nonrenewals and the highest values for each vulnerability measure.
Figure 7. Bivariate Maps of Demographics and Insurer-Initiated Nonrenewals in California in 2019
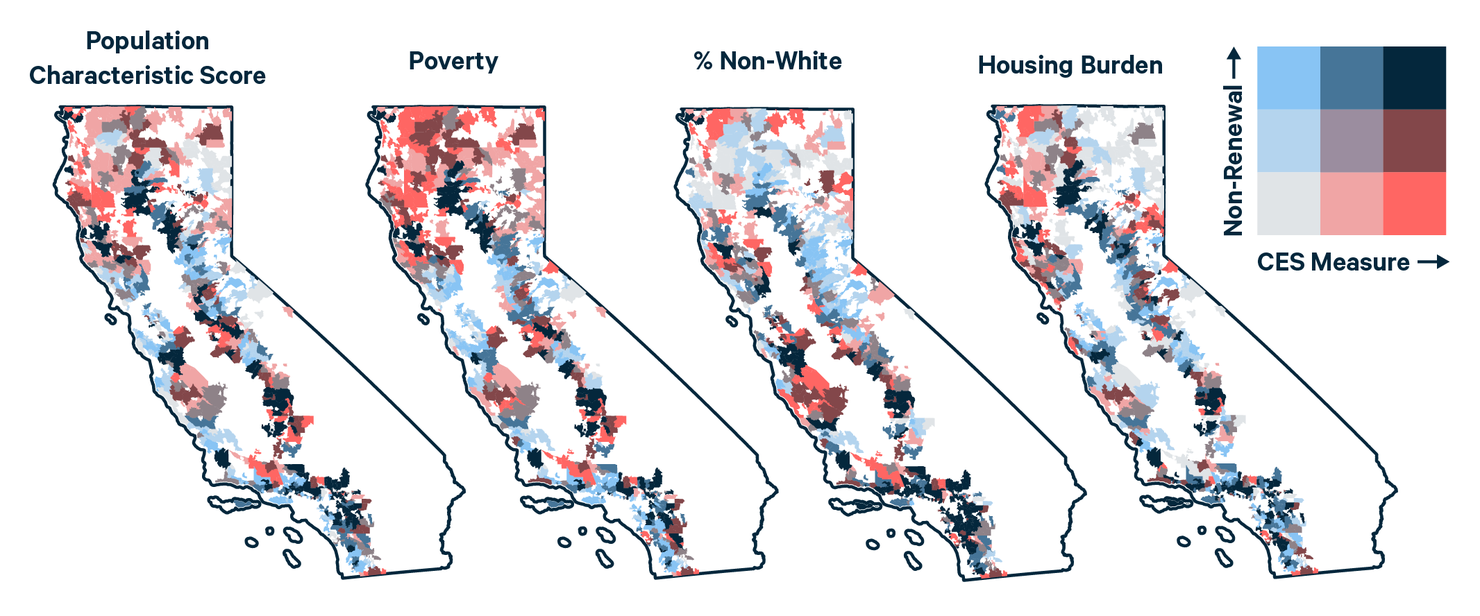
Our first observation is that none of the maps show large areas of dark blue—there are no large swaths of the state with high insurance nonrenewal rates and high social vulnerability as captured by these four metrics. However, some dark blue ZIP codes appear in the Shasta Cascades region and also, to a lesser extent, Southern California, most notably in the poverty map. These are ZIP codes with a relatively high percentage of the population with incomes below twice the federal poverty line and relatively high rates of nonrenewals (and high wildfire risk).
To establish these relationships more formally, Figure 8 presents their corresponding bin scatter plots. In each panel, we plot the demographic variable on the x-axis and the percent of insurer-initiated nonrenewals on the y-axis. To allow for a cleaner visual representation, we group the 705 ZIP codes into 20 bins based on their demographic variable and calculate the mean of their nonrenewal share. Each black dot represents one bin. Each plot also presents a linear regression line in green showing the relationship between the two variables and the corresponding 95 percent confidence band in light green. The regression line and confidence bands rely on the underlying data rather than the binned values.
Figure 8. Bin Scatter Plot of Demographics and Insurer-Initiated Nonrenewals in California in 2019

We find a nearly flat relationship for the population characteristic score and housing burden, suggesting no correlation, positive or negative, between these variables and the nonrenewal rate. In the top right panel, the nonrenewal rate appears to be higher in communities with a higher poverty rate. In contrast, the bottom left panel shows a strong negative correlation between the fraction nonwhite population and nonrenewal rate. This relationship is the strongest of the four, with that negative relationship holding across the distribution.
Our use of the insurer-initiated nonrenewal rate, rather than the absolute number of nonrenewals, as the main measure has its limitations. It captures well the likelihood of an average household in each ZIP code being dropped by an insurer, but it does not necessarily represent a high number of nonrenewals in each ZIP code. In fact, populous ZIP codes tend to have lower nonrenewal rates but nonetheless a large number of nonrenewals.
Overall, our findings in this section suggest that the insurance nonrenewal issues are not predominantly experienced by communities with more vulnerable or minority populations. However, communities with higher poverty levels do tend to face a higher nonrenewal rate, which might affect the ability of lower-income populations to continue living in those areas. Furthermore, the statistical relationships in Figure 8 help in identifying overall relationships but mask many hot spot areas scattered across the state, which show up in Figure 7. Some ZIP codes across the state have communities that are vulnerable and face insurance availability concerns.
Our cursory assessment can help to identify areas of concern, but to fully assess the impact of insurance nonrenewals (and other changes in insurance markets) on vulnerable populations, a deeper analysis is required, especially to account for local conditions within individual communities. Moreover, a complete understanding of the mechanisms that drive any identified relationship between demographic characteristics and insurance outcomes is beyond our scope but worthy of study.
5. Discussion and Conclusion
Insurance is an important tool for managing risks and recovering from disasters. However, in California, concern is growing over insurance availability and affordability, especially in areas that have experienced severe wildfires. In recent years, wildfires have increased in frequency and severity—15 of the top 20 fires in the state’s history, in terms of structure damage, have occurred since 2015. If this trend holds, and population in the WUI continues to grow, these concerns about insurance coverage will increase.
We summarized CDI data on insurance nonrenewals, enrollment in the state’s FAIR Plan (generally considered insurance of last resort), and insurance premiums by ZIP code to analyze trends over time in availability and affordability of insurance and how those trends vary by a measure of wildfire risk. We also combined these data with four demographic measures from CalEnviroScreen, the state’s mapping tool that helps identify disadvantaged communities. Specifically, we analyzed how insurance nonrenewals initiated by insurance companies vary across ZIP codes based on poverty rates, percent people of color in the population, housing burden, and a composite index based on eight population characteristics that include health outcomes, linguistic isolation, and unemployment.
Our key findings are as follows:
- Insurer-initiated nonrenewal—the share of the total number of policies in a ZIP code in a given year that are not renewed by insurance companies—is highly correlated with wildfire risk. Areas with the highest wildfire risk have the highest nonrenewal rates.
- Nonrenewal rates more than doubled in 2019 in ZIP codes with the highest wildfire risk.
- Although only 10.5 percent of policies across all the highest-risk ZIP codes were not renewed in 2019, 11 ZIP codes had nonrenewal rates above 30 percent.
- The market share of FAIR Plan policies has increased significantly since about 2010 in ZIP codes with the highest wildfire risk while remaining unchanged in other ZIP codes.
- Average insurance premiums have stayed roughly constant or declined, in inflation-adjusted terms, since about 2008 in all ZIP codes except those in the highest wildfire risk category, where they have increased by approximately 14 percent.
- FAIR Plan premiums have risen slightly since 2008 in all ZIP codes, but the greatest increase is for those ZIP codes in the highest-risk category.
- The ZIP code nonrenewal rate is not positively correlated with four measures of social vulnerability that we analyzed, save for some evidence that the rate is higher for high-risk ZIP codes with a greater share of the population below two times the federal poverty line.
- Our maps identify a few ZIP code hot spots where some measures of social vulnerability are high and nonrenewals are also high. Further analysis of exactly who is being harmed by nonrenewals, and other changes in insurance markets, seems in order.
Overall, our analysis confirms some of the problems in California that have been widely discussed in the media and elsewhere in recent years. By looking systematically at nonrenewal rates by a measure of wildfire risk, we document that areas with the highest risks have higher nonrenewals, FAIR Plan enrollments, and insurance premiums. Although the overall average rate of nonrenewals—10.5 percent in 2019—may not seem excessive, some ZIP codes have a significantly higher rate, indicating some hot spots of insurance problems.
Our analysis has a few important limitations. First, we analyzed nonrenewals but not other possible changes in insurance, such as higher deductibles and changes in coverage, including lower limits or eliminating fire coverage. We do not have data on these outcomes. Second, our data do not include 2020 and 2021, which may have seen important changes due to heavy wildfire damages in recent years and also some changes in insurance regulatory requirements in California. Third, our analysis by demographic characteristics is only suggestive of the burden of insurance on vulnerable populations. It serves to highlight which ZIP codes, as characterized by some average measures of vulnerability, may be seeing a greater share of their households losing insurance through insurer-initiated nonrenewals. Further analysis of insurance and various measures of vulnerability are needed.
California has taken a few approaches to address its insurance problems. In 2018, the legislature passed Senate Bill 824, which prohibits insurance companies from canceling or refusing to renew a policy for one year after a state of emergency is declared, if the sole reason for cancelation is that the structure was within a wildfire area. When a state of emergency is declared, CalFire provides CDI with information on fire perimeters. CDI then determines the ZIP codes that are within or adjacent to the fire perimeter and announces the one-year moratorium for them. Since the law passed, CDI has issued 24 moratoria covering multiple fires and ZIP codes.
CDI has also taken several steps to address concerns about FAIR Plan policies. The most significant was an order adopted in September 2021 that FAIR Plan offer a more comprehensive homeowners policy—a so-called HO-3 option (similar to the private market)—that covers dwelling damage, loss of personal property, and liability. The insurers that operate FAIR Plan are fighting the new requirements in court, claiming they violate the state insurance code. In February 2022, the Los Angeles Superior Court denied FAIR Plan’s request of a stay to the CDI order; FAIR Plan is appealing that decision. For information on more actions CDI is taking to improve FAIR Plan, see https://www.insurance.ca.gov/01-consumers/200-wrr/upload/FAIR-Plan-Investigatory-Hearing-Presentation-Final-Public.pdf
Finally, in October 2022, CDI adopted regulations requiring insurance companies to adopt rates that reflect homeowner and community wildfire mitigation activities. On the homeowner side, insurance companies are required to consider clearing of brush and debris, removal of combustible structures, and various building-hardening measures. On the community side, rates are required to reflect whether a community is in the National Fire Protection Association’s FireWise program or on the California Board of Forestry and Fire Protection’s Fire Risk Reduction Community list. These voluntary programs require communities to meet a set of best practices for local fire planning. The new regulations also require CDI approval of any wildfire risk model that an insurer uses to determine rates.
As wildfire losses in California increase, the cost of insuring homes in high-risk areas will also continue to rise, posing continuing challenges for insurers and policyholders. Nonrenewal moratoria can create stability in the short term, but they may not provide a long-term solution to California’s insurance affordability and availability challenges, as insurers facing rising costs may eventually exit the market. Policies that encourage premiums to better reflect risk and also encourage activities that mitigate risk may be part of the long-run solution. However, affordability challenges will remain, and more research is needed to better understand how affordability burdens are distributed across households and what can be done to ease these for the most vulnerable households and communities.
Appendix
Figure A1. Map of Insurer-Initiated Nonrenewals in California in 2019