Global Energy Outlook 2021: Pathways from Paris
Resources for the Future’s annual Global Energy Outlook report finds that current trends fall far short of meeting emissions reduction targets, despite the economic slowdown of the COVID-19 pandemic.
Abstract
As parts of the world begin to recover from the COVID-19 pandemic, a fundamental shift in the global energy system is needed to avoid the worst impacts of climate change. Despite efforts by policymakers in some nations to stimulate a “green” recovery, far greater effort will be required to spur the scale and speed of technological change necessary to limit warming to 1.5° or 2° Celsius by 2100. In this annual report, we review and compare—on an apples-to-apples basis—recent long-term projections from some of the world’s leading energy institutions. These projections range widely from those that assume little to no change in energy and climate policies to those that lay out technological feasible yet politically challenging pathways to limit climate change, improve energy access, and reduce air pollution. This year’s report provides particular insight into the differences between pathways aligned with the 1.5° and 2° Celsius climate targets; the effects of COVID-19 on future population, GDP, and energy demand; and the energy intensity of the global economy.


1. Introduction
Long-term energy projections vary widely, depending on underlying assumptions and methodologies. This report provides a unique apples-to-apples comparison of projections and addresses the full scope of potential changes to the energy system as envisioned by some of its most knowledgeable organizations. Table 1 shows the historical datasets, outlooks, and scenarios.
Table 1. Outlooks and scenarios examined in this report

A brief description of our methodology is provided under Data and Methods (Section 4), with select data indicators under Statistics (Section 5). For the full methodology, data set, and interactive graphing tools, visit www.rff.org/geo.
We include 2020 energy demand and emissions figures based on estimates provided in the IEA’s Global Energy Review 2021. However, most of our analysis compares future energy and emissions levels with those seen in 2019, which we choose as a baseline because it was relatively unaffected by the COVID-19 pandemic.
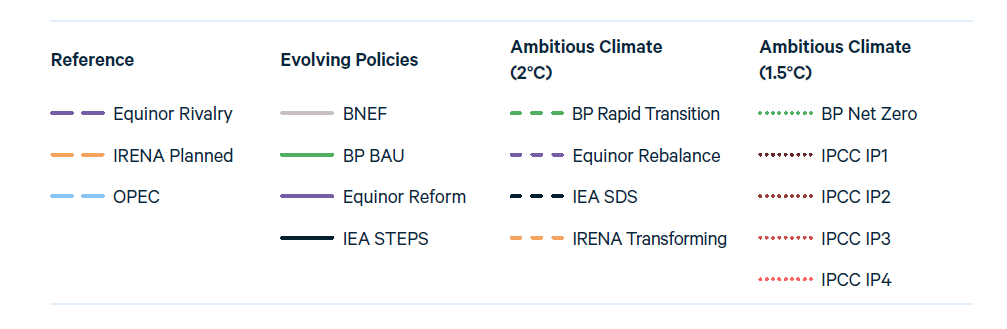
We use a consistent labeling system that distinguishes among the different scenarios (see Table 2):
- For “Reference” scenarios, which assume limited or no new policies, and for Equinor’s Rivalry scenario, which assumes continued geopolitical challenges, we use a long-dashed line: this set comprises Equinor’s Rivalry, IRENA’s Planned Energy Scenario, and OPEC’s Reference.
- For “Evolving Policies” scenarios, which assume that policies and technologies develop according to recent trends and/or the expert views of the team producing the outlook, we use solid lines: this set comprises BNEF, BP BAU, Equinor Reform, and IEA STEPS.
- For “Ambitious Climate” scenarios, which are built around limiting global mean temperature rise to 2°C by 2100, we use short-dashed lines: this set comprises BP’s Rapid Transition, Equinor’s Rebalance, IEA’s SDS, and IRENA’s Transforming Energy Scenario.
- Finally, we include an additional set of Ambitious Climate scenarios designed to limit global mean temperature rise to 1.5°C by 2100, which we illustrate with a dotted line: BP’s Net Zero and the four Illustrative Pathways (IPs) published in the IPCC’s 2018 Special Report on 1.5°C. For additional detail on scenarios, see Table 5.
Table 2. Legend for Different Scenario Types
Figures and tables in this report frequently refer to regional groupings of “East” and “West.” In the figures and tables that follow, we aggregate these regional groupings for all scenarios that provide sufficient data to do so. Table 3 provides those regional groupings.
Table 3. Regional definitions for “East” and “West”

2. Key Findings
Figure 1. Global carbon dioxide emissions
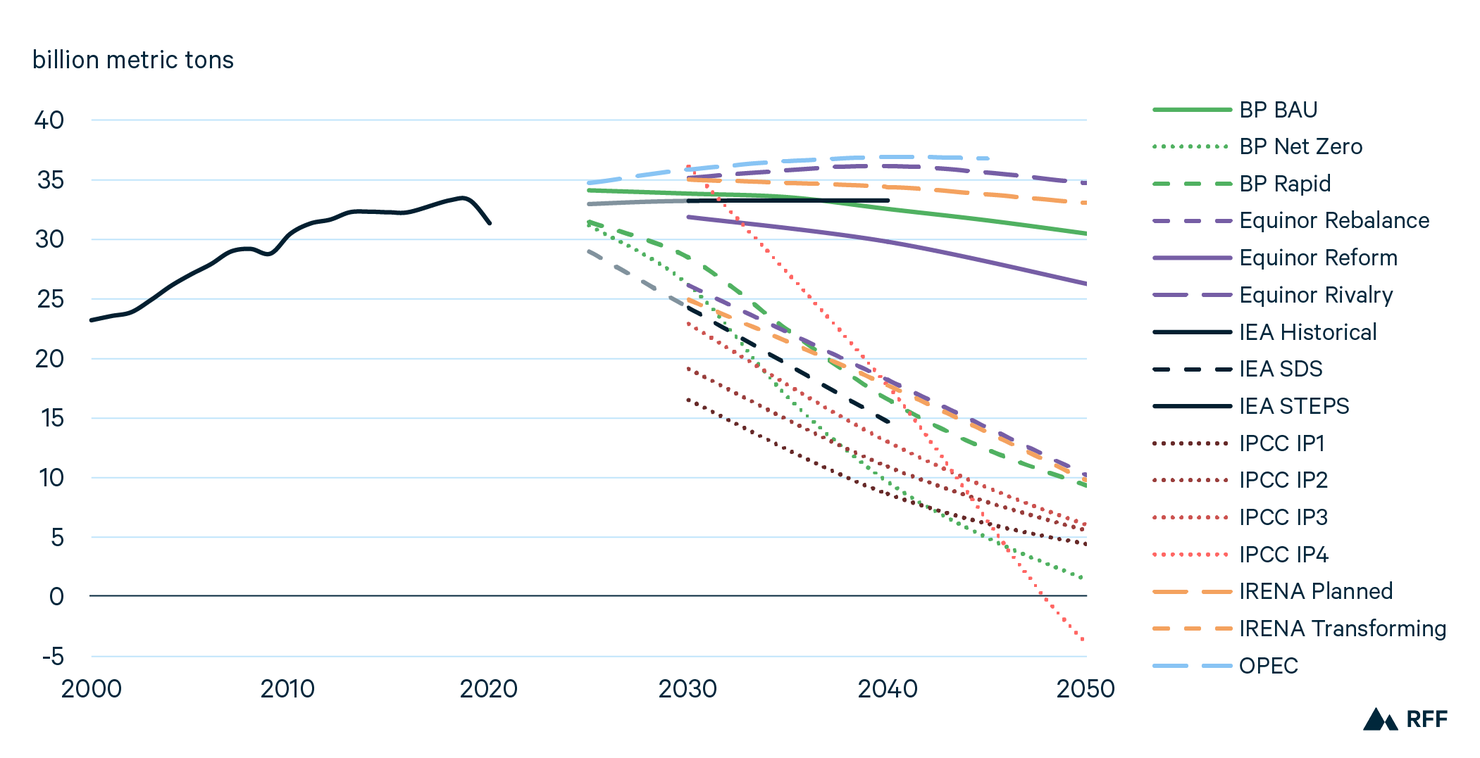
The global energy system lies at an inflection point. To achieve the long-term climate targets articulated in the 2015 Paris Agreement, energy-related carbon dioxide (CO2) emissions will need to decline dramatically. Reference and Evolving Policies scenarios show that current efforts fall well short of the reductions needed to achieve stated targets.
While 2020 saw roughly a 6 percent decrease in global CO2 emissions, the IEA projects that 2021 will see a rebound to 2019 levels or above. Emissions roughly plateau over the next 2–3 decades under most Reference and Evolving Policies scenarios, and global CO2 emissions range from 4 percent above to 21 percent below 2019 levels by 2050.
Ambitious Climate scenarios that target limiting the 2100 temperature rise to “well below 2°C” project CO2 emissions falling to roughly 10 billion metric tons (BMT) by 2050, or about 70 percent lower than 2019 emissions. For scenarios that seek to limit global temperature rise to 1.5°C by 2100, emissions fall to 5 BMT or lower by 2050. In one scenario, IPCC’s IP4, global emissions rise considerably from 2018 levels (when the scenario was published), then fall below zero by 2050, as negative emissions technologies reduce atmospheric CO2 concentrations to limit temperature rise by 2100.
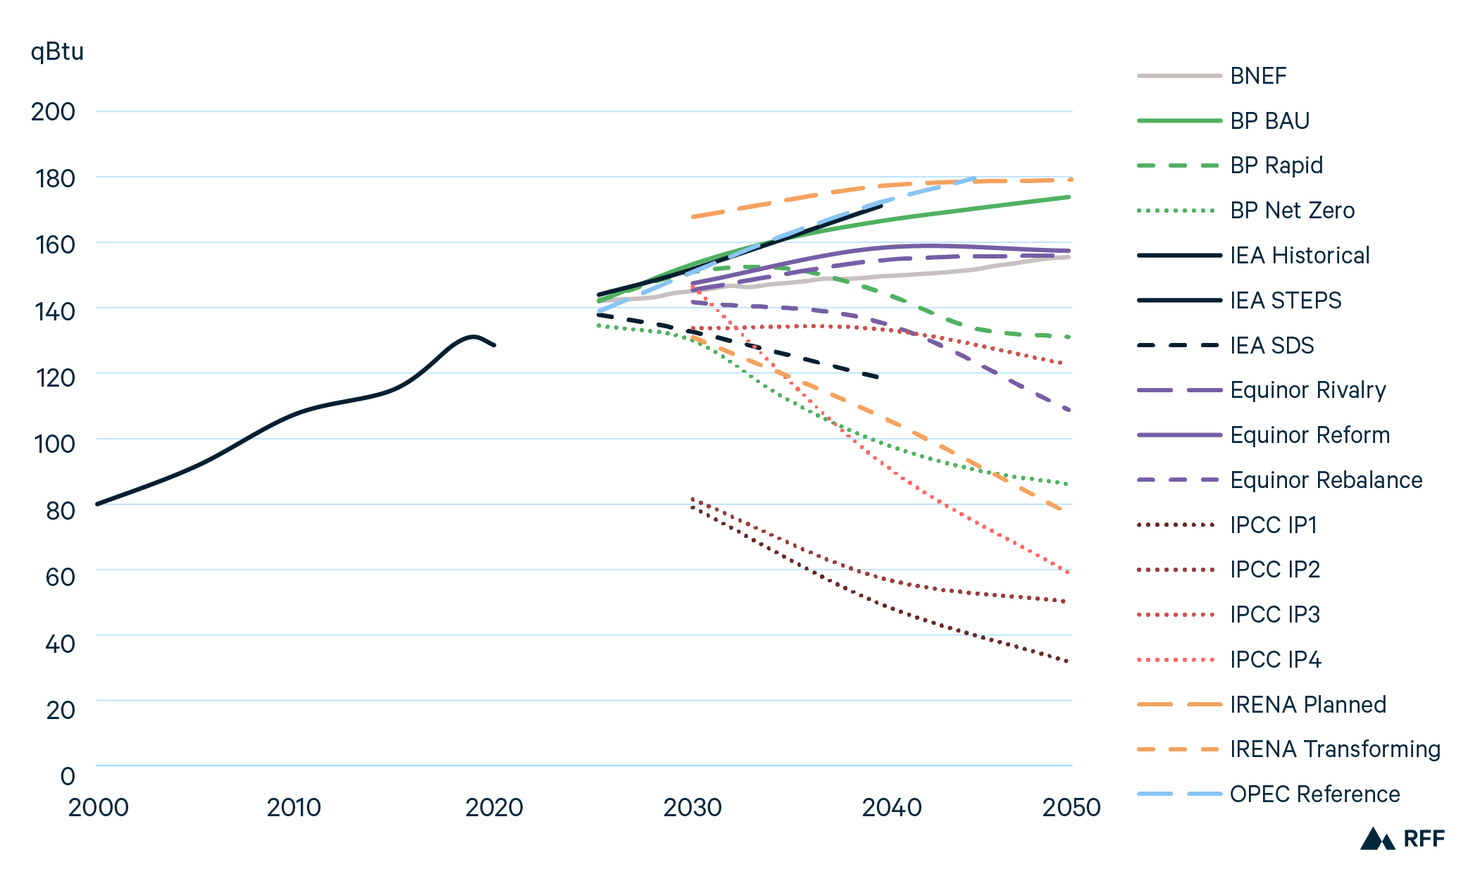
Figure 2. Global primary energy consumption

Scenarios envision a wide range of potential future growth of global primary energy demand, even within scenario types. Compared with 2019, energy consumption increases by as much as 47 percent under the highest-growth scenario (IPCC IP4) and decreases by as much as 44 percent under the lowest-growth scenario (IPCC IP1) by 2050.
The majority of Reference and Evolving Policies scenarios project that global energy demand will grow more modestly than the increases seen since 2000 and begin to level off toward midcentury. However, projections vary across these scenarios. In 2019, global primary energy demand totaled 572 quadrillion (1015) British thermal units (QBtu). BNEF projects that by 2050 demand falls modestly to 551 QBtu, whereas OPEC’s Reference Case reaches as high as 709 QBtu by 2045.
Ambitious Climate scenarios vary more widely, largely due to the high-energy-demand scenarios from the IPCC: under IP3 and IP4, energy consumption accelerates in the next several decades as the carbon intensity of the energy mix declines, allowing for emissions to fall even as energy consumption grows. Most other Ambitious Climate scenarios, however, anticipate a decline in global energy consumption as energy efficiency measures reduce the energy intensity of the economy. Under BP’s Net Zero scenario, for example, global demand falls to 420 QBtu by 2050, and IPCC IP1 decreases to 322 QBtu.
Figure 3. Global primary energy fuel shares in 2040
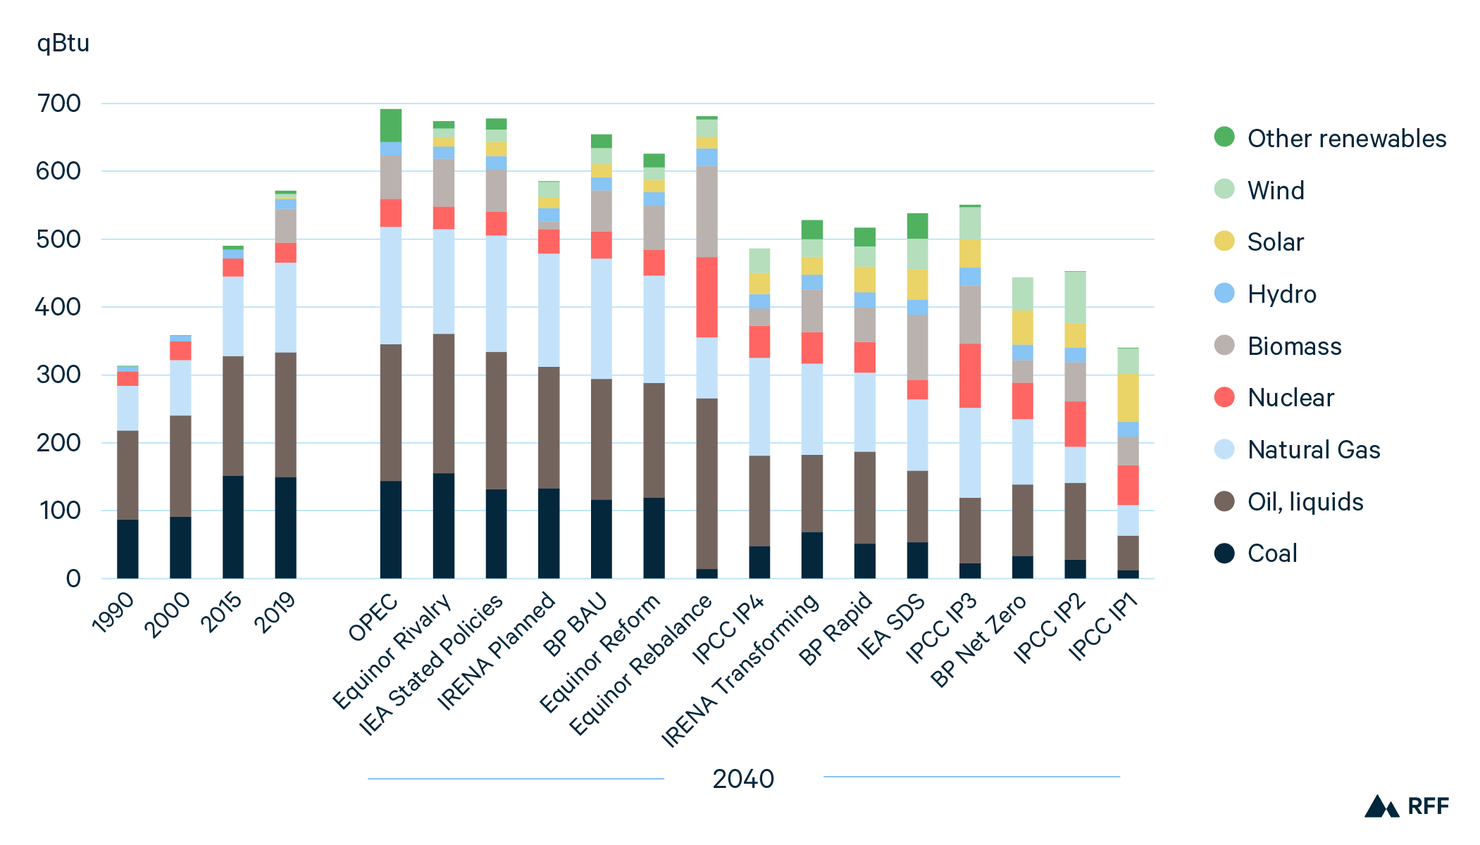
Note: “Other renewables” includes wind and solar for OPEC.
Under most Reference and Evolving Policies scenarios, aggregate fossil fuel consumption in 2040 is similar to, and in some cases substantially higher than, 2019 levels. Under Ambitious Climate scenarios, fossil fuel use declines dramatically, with the possible exception of natural gas, which is the only fossil fuel that grows across the majority of scenarios, including some Ambitious Climate scenarios. Renewable energy resources see substantial growth in all scenarios, particularly in deep decarbonization scenarios (Figure 3).
While varying regionally, global coal use declines in the coming decades across almost all scenarios. Under IPCC 1.5 scenarios, it approaches zero in 2040. Natural gas use grows by 35–52 percent under Evolving Policies and Reference scenarios, but under Ambitious Climate scenarios, 2040 demand ranges widely: stable at 2019 levels under the IEA’s SDS and falling by more than 60 percent under IPCC IP1. Liquids (which includes oil) use grows more modestly in central scenarios, by just 2 percent under BP’s BAU and as much as 17 percent under Equinor’s Rivalry. Most Ambitious Climate scenarios show liquids demand falling by 20 percent or more by 2040, although IPCC IP4 has growth of more than 40 percent.
Nuclear and hydropower both rise under all scenarios, but with wide variation. Nuclear more than doubles under all IPCC 1.5 scenarios and ranges from 85 percent growth under BP Net Zero to just 1 percent under IRENA Transforming. Hydropower grows by 48–81 percent under Ambitious Climate scenarios, with a range of 26–38 percent growth under Reference and Evolving Policies scenarios.
Figure 4. Global electricity mix in 2040

The full range of outlooks project global electricity generation to increase through 2040 by between 37 percent (BNEF) and 104 percent (IP2) over 2019 generation. In some Ambitious Climate scenarios (e.g., BP Net Zero, IPCC IP2) the electrification of new sectors, such as transportation and heating, lead to higher levels of overall electricity generation. In others (e.g., IEA SDS, IPCC IP1), energy efficiency gains play a larger role, leading to relatively low levels of electricity demand (Figure 4).
Fossils fuels continue to produce a significant portion of global electricity in Reference and Evolving Policies scenarios; between 30 (BNEF) and 52 (Equinor Rivalry) percent in 2040. Coal use remains virtually constant in these scenarios, whereas oil use approaches zero across the board. Natural gas use grows substantially in most Reference and Evolving Policies scenarios, by as much as 48 percent (BP BAU) between 2019 and 2040, with only BNEF projecting a decrease of 20 percent. Ambitious Climate scenarios see overall fossil fuels, particularly coal, significantly diminish through 2040, though some predict a persistent use of natural gas.
Both nuclear and hydro see growth in all projections, with 1.5°C scenarios having the largest. Non-hydro renewable energy resources vary dramatically across the spectrum of scenarios, yet all involve substantial growth. Other renewables can grow as much as 10–11 times from 2019 to 2040 in the 1.5°C scenarios BP Net Zero and IP2, respectively, but Reference and Evolving Policies estimates do not exceed 3.7 (IRENA Planned) or 5.0 (BNEF) times 2019 levels.
Figure 5. Global oil demand

Note: Right-hand y-axis assumes a constant conversion factor of 1.976 QBtu per mbd.
The volatility and declines of 2020 in global oil markets are expected to be short-lived, and as we look forward, the current suite of energy projections are split on future oil demand. Reference and Evolving Policies scenarios cast a fairly narrow band of long-term oil demand futures: IEA STEPS lies near the center of these projections, showing oil demand in 2040 roughly 7 percent above 2019 levels. Ambitious Climate scenarios all show contraction in oil demand by midcentury, ranging from a decrease of 39 (IPCC IP4) to 88 (IPCC IP1) percent by 2050 (Figure 5).
Globally, oil demand growth has been driven primarily by the transportation sector. If public policies and continued technological advancements accelerate the electrification of transportation, oil will become less significant, particularly for light-duty transportation. However, considerable demand for oil will likely persist for the foreseeable future due to its comparative advantages for heavy-duty and long-distance transportation and the petrochemicals sector.
This growth continues to be concentrated in the Global East, where expansion is projected through at least the next decade. Under Reference and Evolving Policies scenarios, India and Africa are projected to see sustained growth, and Ambitious Climate scenarios would see this trend reverse in the long run.
Figure 6. Global natural gas demand
Demand for natural gas varies widely across scenarios. Even within the subset of Ambitious Climate scenarios, demand in 2050 ranges from a high of 130 (BP Rapid) to a low of 27 (IPCC IP1) QBtu. All Reference and Evolving Policies scenarios project global growth to continue through 2040, although several of them envision a plateau or modest decline for 2040–2050 (Figure 6).
Natural gas demand has grown dramatically in recent decades, displacing coal in the power sector and becoming more widely used in buildings and industry around the world. Looking forward, global gas demand will need to decline to achieve the 1.5°C or 2°C goals of the Paris Agreement, but with wide variation across regions. For example, gas consumption grows dramatically across Africa, China, and India under Ambitious Climate scenarios, pushing coal out of the power sector, but falls by 40–50 percent by 2050 relative to 2019 levels in Europe and North America as renewables and energy efficiency displace gas.
Reducing methane emissions from oil and natural gas supply chains will also be a critical piece of limiting global temperature rise, especially in the near and medium terms. For example, the IEA’s World Energy Outlook highlights the wide variation in methane emissions per unit of oil produced around the world and notes that “huge and rapid improvements” are likely achievable. Some outlooks also highlight the potential for biogases, including biomethane, to play a more substantial role in the future energy system.
Figure 7. Global coal demand
Global coal demand fell dramatically in 2019 and 2020, and all scenarios project a mostly downward trend in the years ahead. In 2020, coal use dropped by an estimated 4 percent, and under most Ambitious Climate scenarios, a similar rate of decline continues for the foreseeable future. However, the IEA projects that coal demand in 2021 will exceed its 2019 levels. Reflecting this potential return to “business as usual,” all Reference and Evolving Policies scenarios envision a slower contraction, with coal remaining at or above 100 QBtu through 2050. In some IPCC scenarios, demand stabilizes and begins to rise around 2040 as CCUS technologies become deployed widely (Figure 7).
At a regional level, driven by a combination of public policies and increasingly competitive alternatives, coal consumption is projected to decline in most regions. By 2050, in North America and Europe, it falls by 93–99 percent under Ambitious Climate scenarios and 71–77 percent under most Evolving Policies scenarios.
However, a much wider range of outcomes emerges in the Global East. Under Evolving Policies from BP and the IEA, coal demand falls by just 1–2 percent by 2040. Under Ambitious Climate scenarios, it falls by 62–75 percent by 2040, then further by 2050. A considerable share of this variation is driven by India. Under Evolving Policies scenarios, coal demand in India grows by between 31 percent (IEA STEPS) and 95 percent (BP BAU) by 2040. Under Ambitious Climate scenarios, projections range from a decline of 1 percent by 2040 (Equinor Rebalance) to more than 50 percent (BP Net Zero and IEA SDS).
Figure 8. Global solar and wind electricity generation
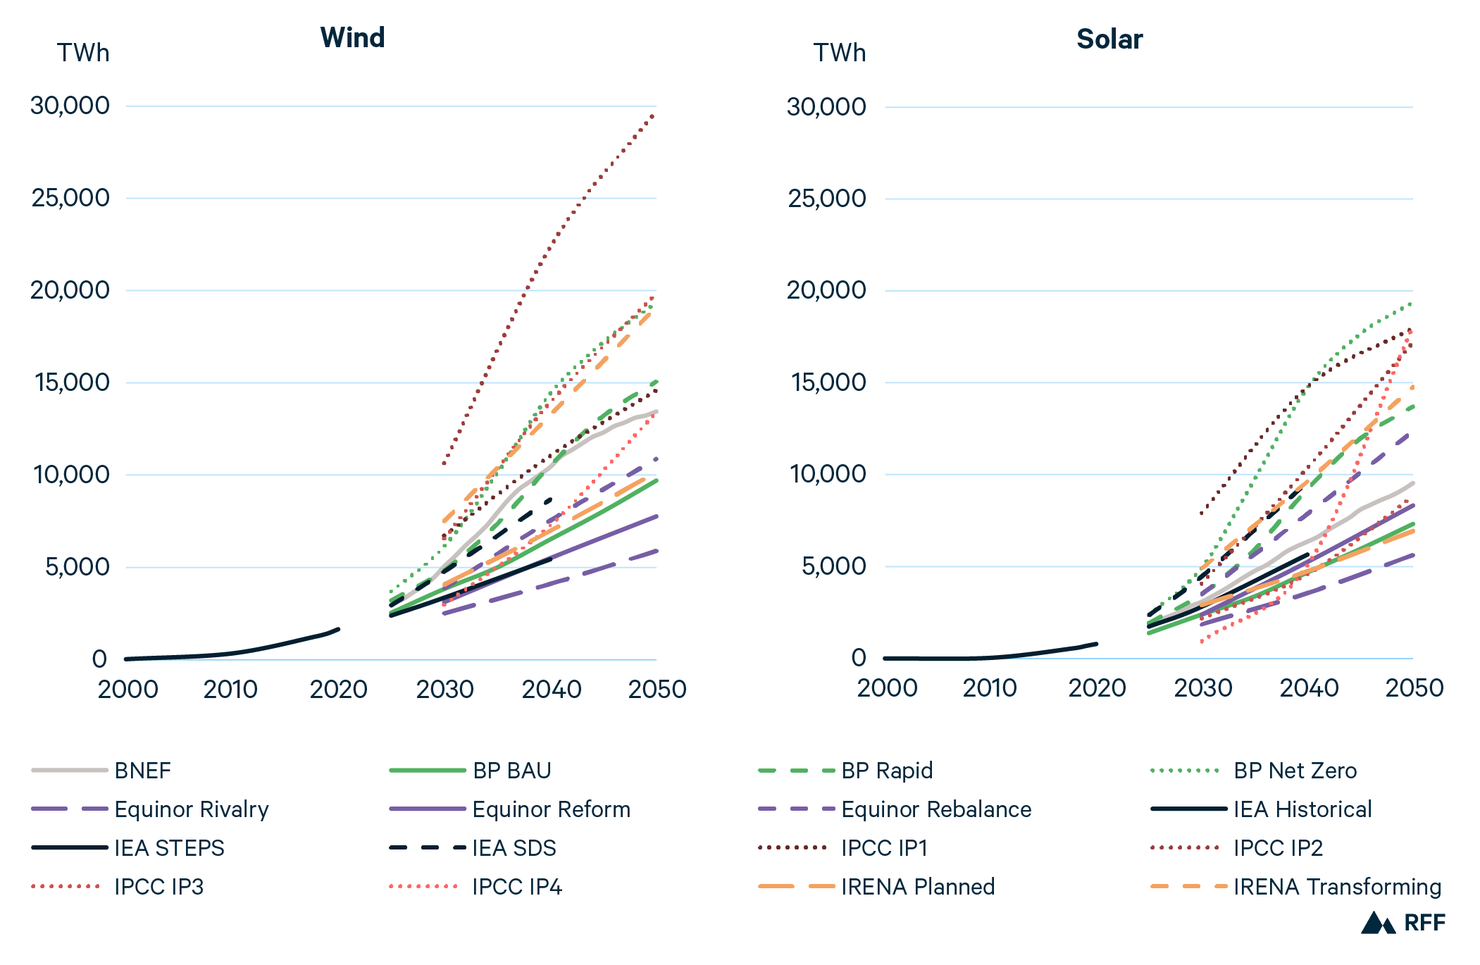
Note: Includes onshore and offshore wind, solar photovoltaic, and solar thermal technologies.
Driven by the interconnected trends of plunging costs and policy support, wind and solar are on track to play a central role in a net-zero emissions energy system. However, the speed of future deployment varies by a factor of six for wind and a factor of four for solar across scenarios, with Ambitious Climate scenarios typically showing the strongest growth (Figure 8).
Global wind power generation more than triples by 2050 under the most conservative scenario (Equinor Rivalry) and grows by a factor of 12 under the least conservative (IPCC IP2). Among Evolving Policies scenarios, BNEF stands out with the most bullish projection, showing faster growth than Ambitious Climate scenarios from the IEA and Equinor. Regionally, most outlooks project that roughly 50–60 percent of wind generation will come from the Global East in 2040 and 2050, though IRENA’s scenarios project that it will account for 61–78 percent by 2050.
In percentage terms, solar grows much faster than wind under all scenarios, more than 8-fold by 2050 under the most bearish scenario (Equinor Rivalry) and more than 28-fold under the most bullish (BP Net Zero). As with wind energy, scenarios envision the Global East to lead solar deployment. In 2019, the East accounted for 58 percent of global solar electricity generation, but it grows to 65–75 percent by 2050 under scenarios for which regional data are available.
Figure 9. Global energy consumption per unit of GDP
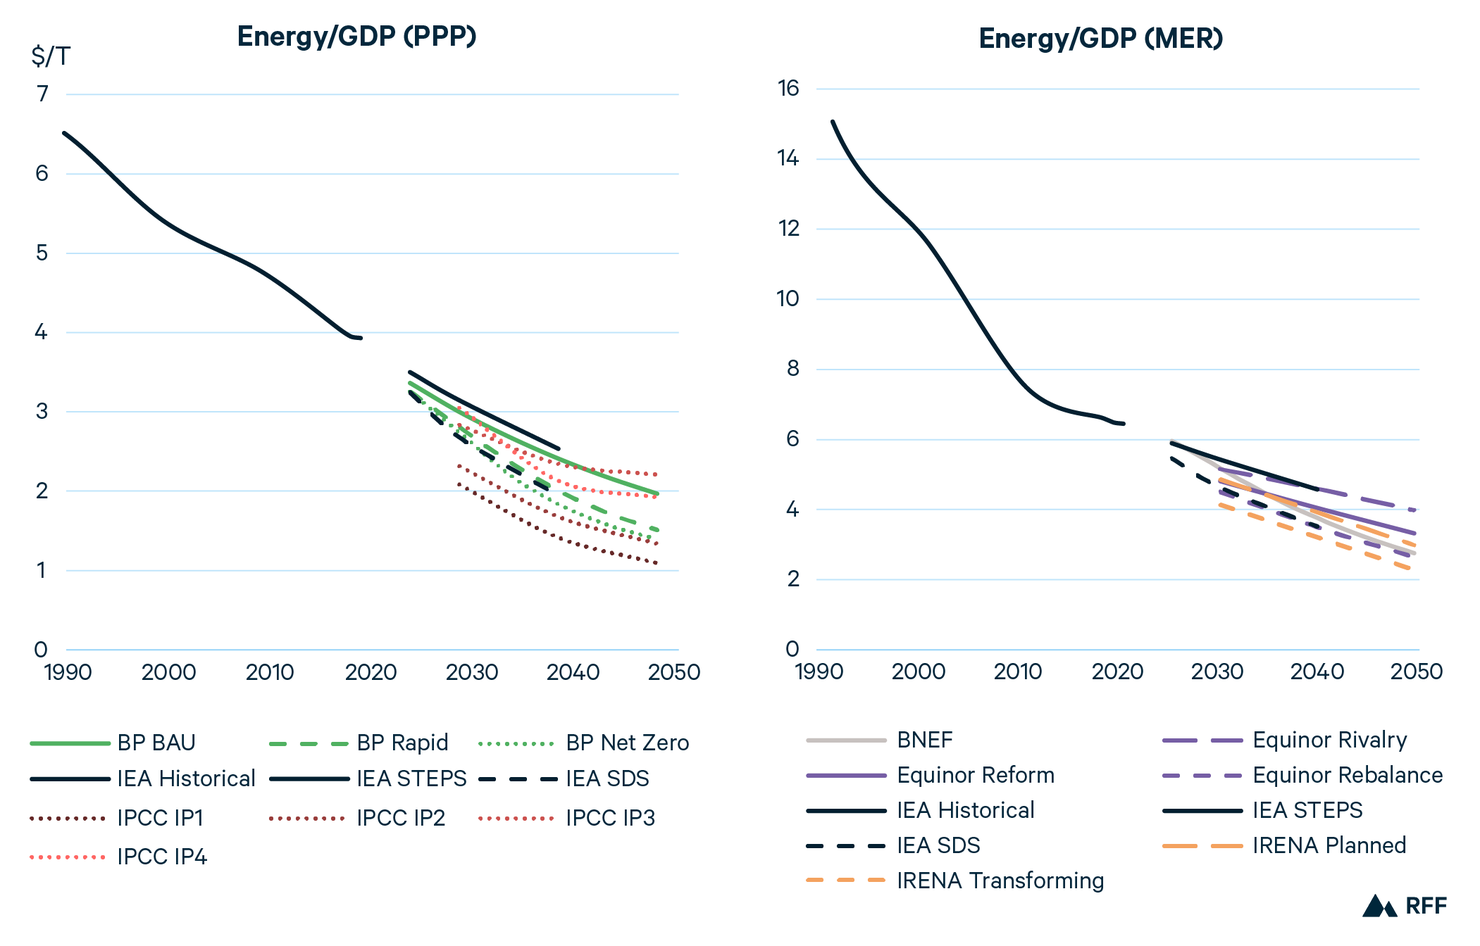
Note: BP excludes nonmarketed biomass, which results in lower primary energy demand and therefore a relatively low rate of energy demand per unit of GDP.
Over the last three decades, the energy intensity of the global economy has declined dramatically, reflecting improvements in energy efficiency and, in many nations, a shift away from energy-intensive manufacturing and toward a service-based economy. In the next several decades, energy intensity continues to decline in all scenarios, falling fastest under Ambitious Climate scenarios (Figure 9).
In Purchasing Power Parity (PPP) terms, global energy intensity falls to two QBtu per trillion US dollars (real $2019) or lower by 2040 under most Ambitious Climate scenarios, except the relatively high-energy-intensity IPCC IP3. Under Evolving Policies scenarios, energy intensity falls to roughly 2.5 QBtu/$T by 2040. Similar trends emerge when calculating in Market Exchange Rate terms.
Energy intensity varies considerably across nations and regions. In 2019, the Global West consumed roughly 3.7 QBtu/$T (at PPP) and the Global East roughly 4.1 QBtu/$T, reflecting the relatively high concentration of energy-intensive manufacturing in China and other parts of Asia. The IEA projects energy intensity in the West and East to fall by 32 and 40 percent, respectively, under its Evolving Policies Scenario (STEPS) and by 46 and 55 percent, respectively, under its Ambitious Climate Scenario (SDS). Under the SDS, the energy intensity of the East and West roughly converge by 2040.
Figure 10. Global CO2 emissions per unit of energy
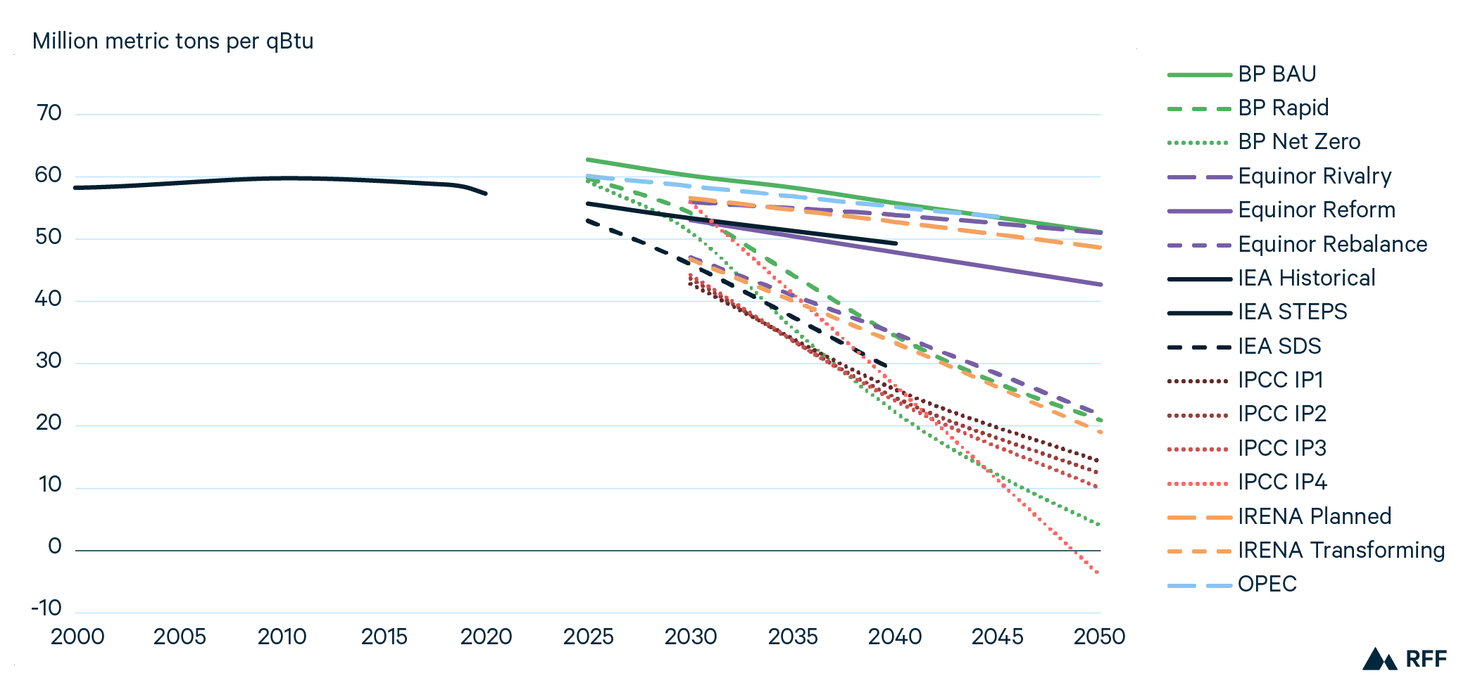
Note: BP excludes nonmarketed biomass, which results in lower primary energy demand and therefore a relatively high rate of CO2 emissions per unit of energy demand.
Unlike the rapid declines in energy intensity over the last several decades, the carbon intensity of energy, measured as the volume of CO2 emissions per unit of primary energy demand, has remained roughly flat. Under Reference and Evolving Policies scenarios, carbon intensity declines over the next three decades but does not approach the rates of decline needed to limit temperature rise to 1.5°C or 2°C (Figure 10).
Under Reference and Evolving Policies scenarios, the carbon intensity of the energy system declines by 10–18 percent through 2040, then further through 2050. Under Ambitious Climate scenarios, the decline is 41–63 percent by 2040. This rate of change would be unprecedented; it reinforces the magnitude of fossil fuels transition required for the global primary energy mix, which will need to decline well below its roughly 80 percent share in 2019.
Because net CO2 emissions fall below zero in the second half of the twenty-first century for many Ambitious Climate scenarios, the CO2 intensity of energy enters negative territory as early as 2050 under the IPCC IP4 scenario.
3. In Focus
3.1. "Paris": What's in a name?
In the 2015 Paris Climate Agreement, under the United Nations Framework Convention on Climate Change, virtually all countries agreed to take action to limit global temperature rise to “well below 2°C above preindustrial levels” (UNFCCC 2015). The Agreement also states that nations will pursue “efforts to limit the temperature increase to 1.5°C.” Including two different targets —1.5°C and 2°C—has led to some confusion about what individuals, companies, and governments mean when they refer to the goals of “Paris.”
As discussed briefly in our Key Findings (see Figures 1 and 2), the energy and emissions trajectories needed to limit the global average temperature rise to 1.5°C differ substantially compared with 2°C. In a recent analysis of the remaining “carbon budget,” researchers estimated that emitting 440 BMT of CO2 would result in a 50 percent chance of limiting temperature rise to 1.5°C by the end of the century, and the equivalent figure for 2°C would be 1,374 BMT (about three times as high).
3.1.1. The IPCC’s Illustrative Pathways to 1.5°C
Figure 11. Global CO2 emissions trends of the IPCC Illustrative Pathways
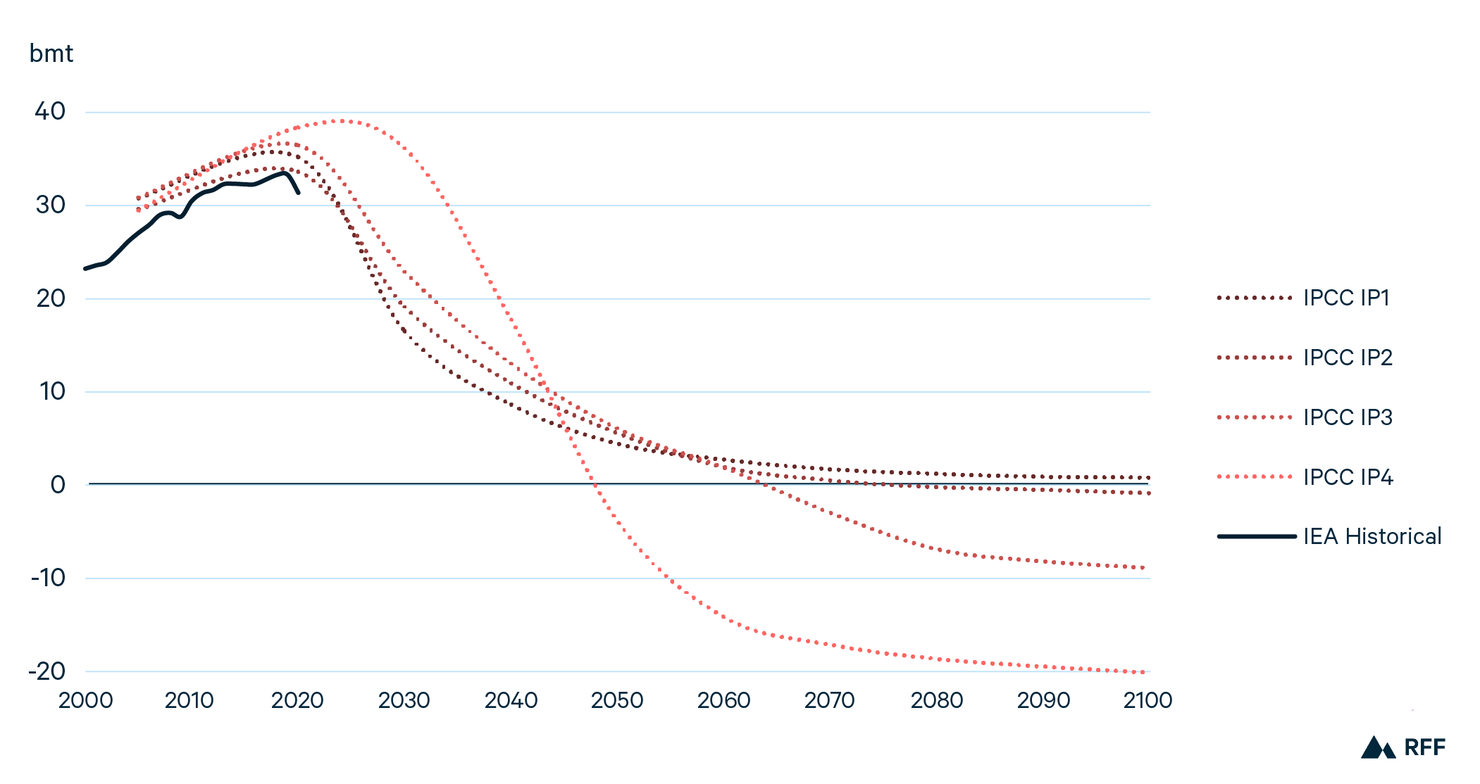
Modeling teams working as part of the IPCC process published a range of scenarios compatible with 1.5°C in 2018 (Rogelj et al. 2018), represented in this GEO report by four IPs. Each IP illustrates the energy and emissions implications associated with distinct assumptions on the rate of social, economic, and technological change through 2100. IP1 is a scenario of low global energy demand, IP2 represents a push for sustainability, IP3 embodies societal and technological evolution at similar rates to historical trends, and IP4 assumes high fossil fuel energy demand and energy-intensive economic growth.
These IPs differ considerably, most notably in their inclusion of negative emissions technologies, such as biomass with carbon capture and sequestration (BECCS), direct air capture, and reforestation and afforestation. When these scenarios reach net zero emissions also varies greatly to reflect their differences in energy consumption, technology deployment, and mitigation timing.
One key observation of the emissions trajectories of the IPs is that because they share the same warming goal of 1.5°C, a longer deferment of emissions reductions necessitates a significantly more aggressive “net-negative” abatement strategy down the road. Figure 11 illustrates this: continued emissions growth over the next decade (as seen in IP4) necessitates a steeper decline in emissions later in the century in addition to large-scale net-negative emissions starting around 2050. In other IP scenarios, emissions peak in 2020 and decline steeply over the next decade, a trend that appears unlikely based on early estimates for strong emissions growth in 2021 (International Energy Agency 2021).
3.1.2. Comparing 1.5°C and 2°C scenarios
In addition to the IPCC 1.5°C scenarios, BP’s Net Zero also aligns with a 1.5°C target by achieving net zero global emissions by midcentury. Other Ambitious Climate scenarios from BP, Equinor, the IEA, and IRENA align more closely with the “well below 2°C” target, reaching net zero global emissions later in the second half of the twenty-first century. For simplicity, we refer to these as “2°C scenarios.” Figure 12 illustrates the different emissions trajectories associated with the 1.5°C and 2°C scenarios; the 2°C projections all remain higher to 2050.
Figure 12. Global emissions trends in 1.5°C scenarios and 2°C scenarios
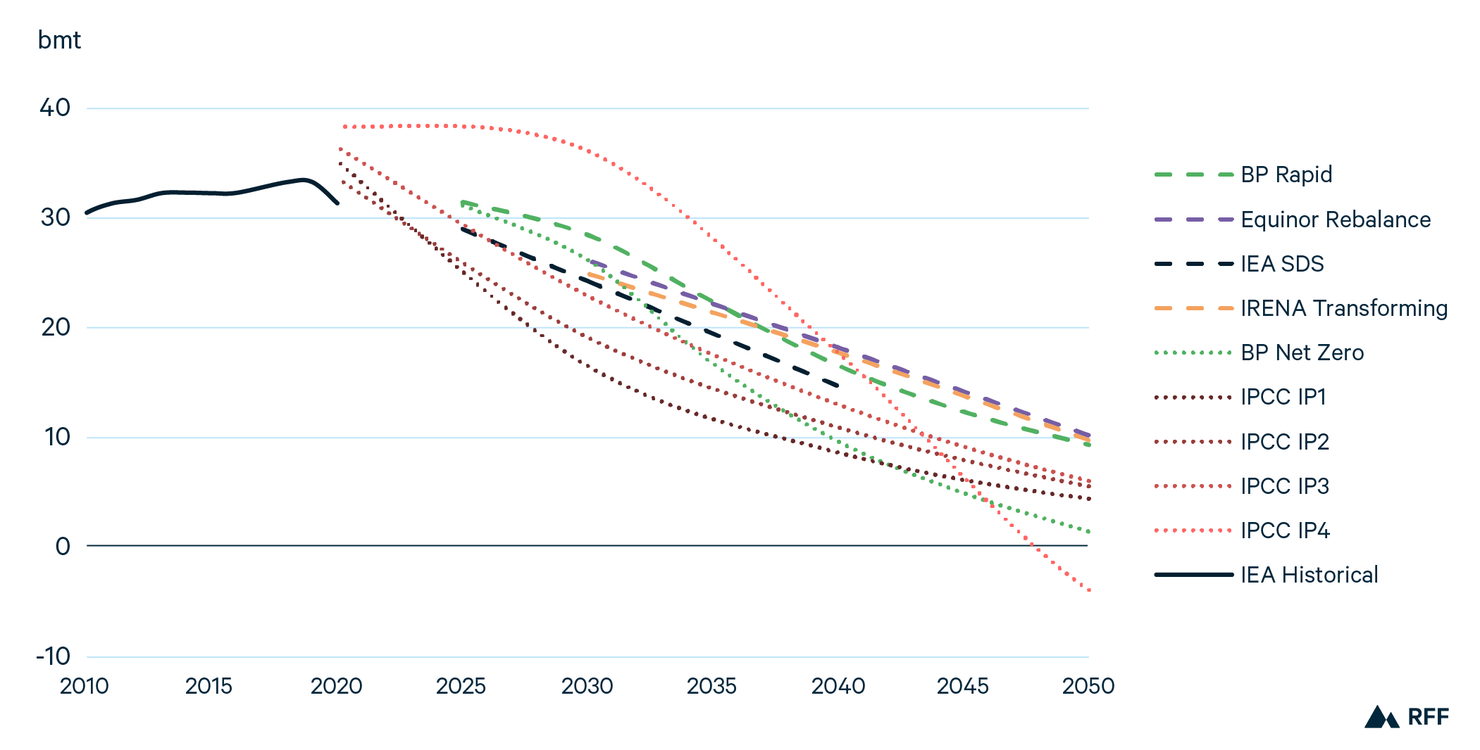
Excluding the high-energy IPCC IP4 scenario, 1.5°C scenarios reduce CO2 emissions by 81–95 percent between 2019 and 2050, whereas 2°C scenarios see reductions of 67–70 percent. IP4 reaches net zero before 2050, and BP Net Zero looks to be the second outlook to see negative emissions just beyond the century’s midpoint. IP1 is the only IP that does not include negative emissions later in the century due to its assumptions of low global energy demand and rapid deployment of clean energy technologies.
All 1.5°C and 2°C scenarios other than IP3 and IP4 envision lower global energy demand in 2040 relative to 2019. The energy mix of these models is quite heterogenous but also shows clear areas of agreement. As Figure 13 presents, renewables expansion and fossil fuel retirement are by and large the primary modes of emissions abatement. Even in high-energy-demand scenarios, such as IP3 and IP4, a significant portion of emissions reductions come from a shift away from fossil fuels, particularly coal.
Figure 13. Global primary energy mix in 2040 under 1.5°C and 2°C scenarios
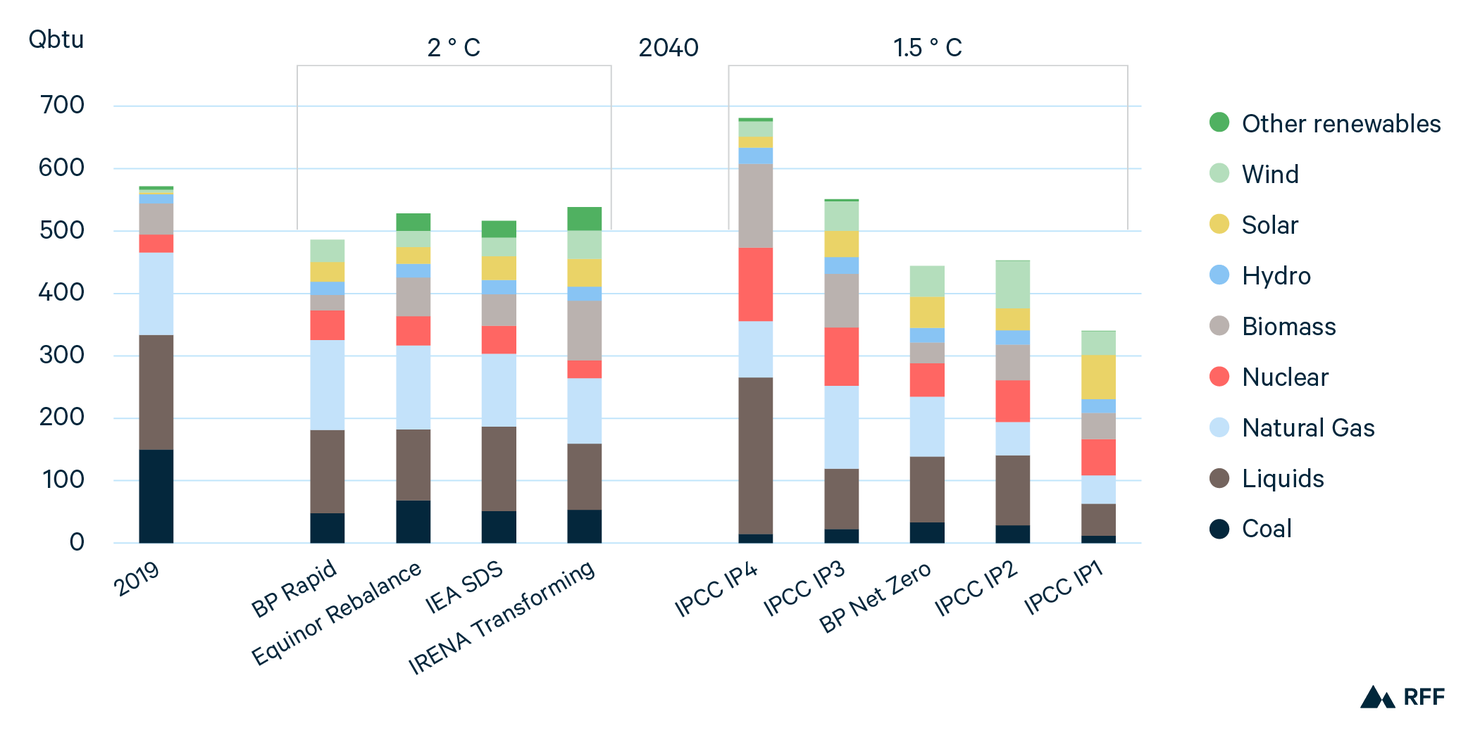
Fossil fuel consumption decreases in both 1.5°C and 2°C scenarios by 2040. Coal falls from 150 QBtu in 2019 to 68 QBtu or less in 2°C scenarios and half that level again to below 34 QBtu in 1.5°C scenarios in 2040. Under 2°C scenarios, liquids see a slight reduction in consumption from 183 QBtu to between 106 (IRENA Transforming) and 136 (IEA SDS) QBtu. Liquids in 1.5°C scenarios (excluding IP4) see sizable reductions, from 113 QBtu in IP2 to just 52 QBtu in IP1. In many 2°C and 1.5°C scenarios, natural gas consumption remains at a similar level, though IP1 and IP2 would see 133 QBtu demand in 2019 fall to 45 or 53 QBtu in 2040, respectively.
Nuclear grows in all Ambitious Climate scenarios, but in particular, the 1.5°C scenarios use nuclear as a major source of energy. From 29 QBtu of demand in 2019, nuclear grows to between 53 (BP Net Zero) and 118 (IP4) QBtu among 1.5°C scenarios.
Solar and wind become major sources of energy by 2040, with biomass also used, particularly in high-energy-demand scenarios. Solar grows to as much as 45 QBtu (IRENA Transforming) in 2°C scenarios or 70 QBtu (IP1) in 1.5°C scenarios. Wind has a similar story in 2040, reaching 45 QBtu under IRENA Transforming in 2°C scenarios and 76 QBtu under IP2 for 1.5°C.
IP4 differs from the other Ambitious Climate scenarios in its high-energy pathway and its particularly heavy reliance on negative emissions. While coal falls close to zero by 2040 and natural gas is lower than most other scenarios, liquids demand grows by 37 percent above 2019 levels. Similarly, nuclear grows the strongest under IP4—more than tripling. IP4 also sees a large rollout of solar and wind, but biomass becomes the largest renewable energy source.
Biomass energy, in some cases paired with CCS, plays a major role in some IPCC 1.5 scenarios. From roughly 50 QBtu in 2019 (a majority of which is traditional biomass), biomass in 2040 falls to 42 QBtu in IP1 and grows slightly to 57 QBtu under IP2. Under IP3 and IP4, however, it becomes one of the largest primary energy sources, growing to 86 and 135 QBtu, respectively. By 2100, biomass grows further under all scenarios, ranging from a low of 71 QBtu under IP1 to 407 QBtu under IP4, accounting for 33 percent of global primary energy demand and rivaled only by solar, which provides 28 percent in 2100.
3.1.3. The role of large-scale CCS
Figure 14. Global CCS trends in 1.5°C scenarios and 2°C scenarios

Most pathways to 1.5°C and, to a lesser extent, 2°C climate goals are heavily reliant on large-scale deployment of CCS technologies. In particular, the IPCC 1.5 scenarios other than IP1 depend on BECCS (Figure 14). The enormous scale of BECCS required, particularly in IP3 and IP4, raise questions about sustainable forestry practices, land-use competition, the build-out of CO2 infrastructure, and a variety of other issues beyond the scope of this report (Butnar et al. 2020).
Comparing to BP historical data that show global CCS at 38 million metric tons in 2018, the highest 2050 projection reaches 17 BMT per year in IP4, with 96 percent coming from BECCS. Less energy-intensive scenarios estimate CCS use at half or less that of IP4, though their levels remain over 50 times greater than 2018. BP Net Zero includes CCS of roughly 5 BMT in 2050, whereas 2°C scenarios from Equinor and BP show CCS of roughly 2 BMT and 4 BMT in 2050, respectively.
3.2. Global population and economic growth post-COVID
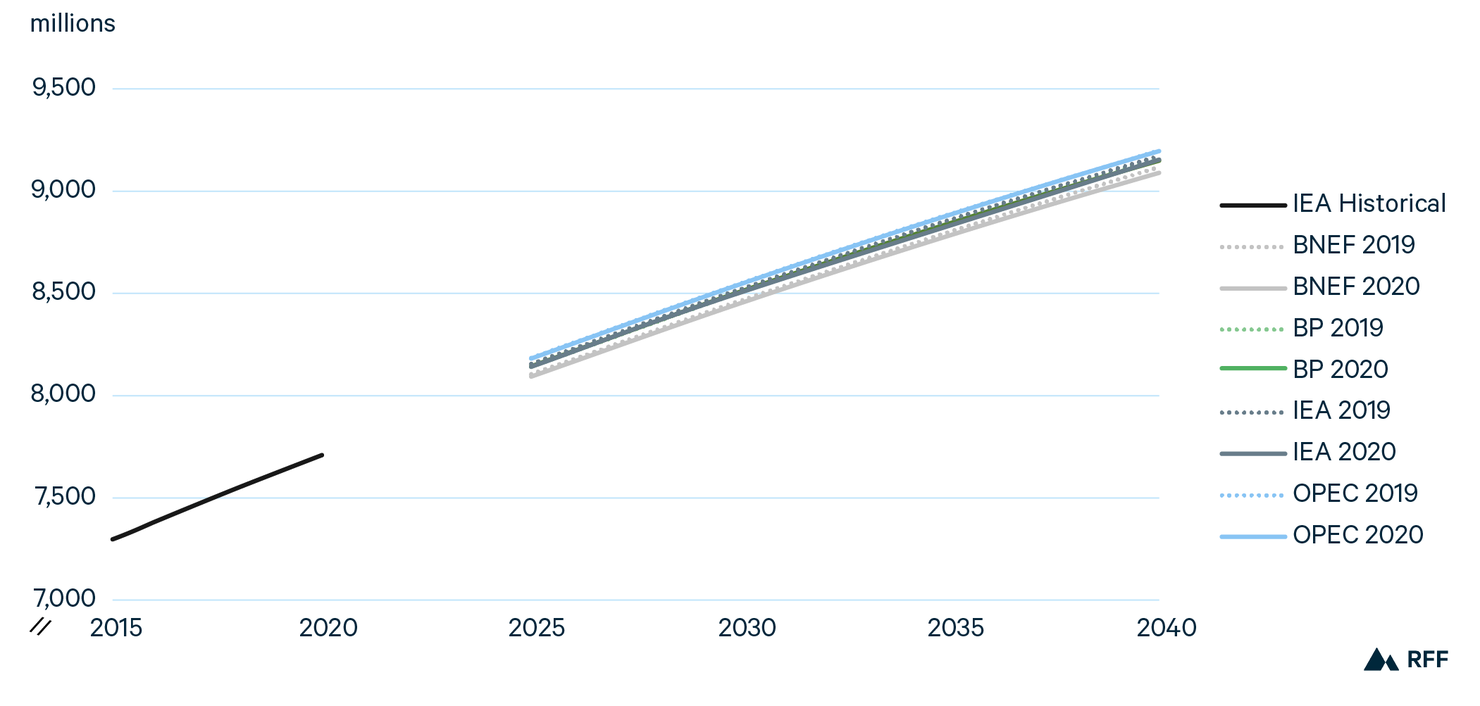
Figure 15. World population assumptions in 2019 and 2020
As of early May 2021, the COVID-19 pandemic had killed an estimated 3.2 million people worldwide (Johns Hopkins University 2021), resulting in immense suffering. As the virus continues to spread uncontrolled in some parts of the world and vaccine distribution accelerates along with new variants of the disease, the ultimate human toll of the virus is currently unknown.
Nevertheless, 3.2 million deaths represents just 0.04 percent of the global population of 7.8 billion, suggesting that the virus’ implications for long-term population growth are likely to be small. Reflecting this dynamic, population growth assumptions changed little from 2019 and 2020. However, they declined slightly for each of the four models where comparable data are available (Figure 15). 2020 outlooks assume that global population will be 0.3 percent (BNEF), 0.2 percent (IEA), 0.1 percent (BP), and 0.03 percent (OPEC) lower in 2040 than assumed in outlooks published in 2019 (International Energy Agency 2018).
Compounding the loss of life, the pandemic produced an economic shock unlike any witnessed in most of our lifetimes. The lockdowns that attempted to control virus spread, and which proliferated across the world during 2020, restricted travel and commerce in unprecedented ways. As a result, global GDP fell by 3.3 percent in 2020, one of the largest contractions on record. However, the global economy appears to be bouncing back relatively quickly. In April 2021, the IMF projected 2021 world GDP growth forecast of 6 percent, exceeding 2019 levels (IMF 2021).
Figure 16. Global GDP assumptions in 2019 and 2020
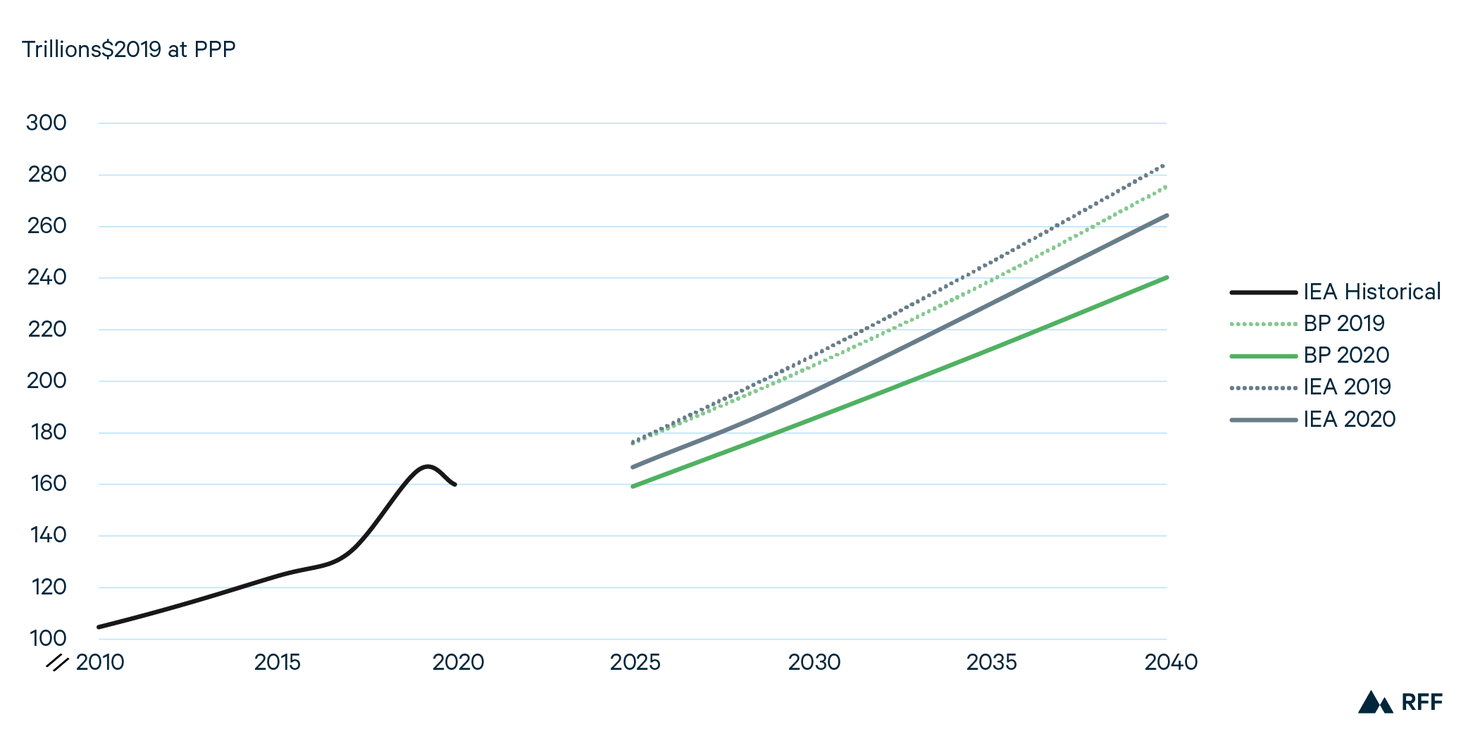
Despite the potential for a relatively swift economic recovery, outlooks produced in 2020 assumed substantially lower future GDP relative to 2019. For example, BP’s 2020 GDP assumption for the year 2040 is 13 percent lower than that in 2019’s outlook, and the IEA’s assumptions were 7 percent lower, as illustrated in Figure 16.
As we discussed in last year’s Global Energy Outlook, energy projections tend to assume that a consistent long-term GDP growth rate is on the high end of the historically observed range (Newell et al. 2020). These downward revisions to global GDP assumptions are not particularly surprising and highlight the potential benefit for outlook-producing organizations to consider a wider range of GDP scenarios in their modeling exercises.
3.3. Energy intensity: historical trends and future pathways
The Kaya identity decomposes total CO2 emissions into four factors: human population, GDP per capita, energy use per unit of GDP (i.e., energy intensity), and CO2 emissions per unit of energy use (i.e., carbon intensity). Estimating future energy consumption and CO2 levels depends heavily on assumptions regarding each of these four factors, and as discussed earlier in this report, there is a range of future possibilities for each.
Figure 17 demonstrates that the energy intensity of the global economy has declined reliably over the past several decades. As a result, the economy is slightly more than half as energy intense as it was in 1980. As of 2020, each trillion dollars of global GDP entailed four QBtu of primary energy consumption.
Figure 17. IEA Historical global energy intensity

Figure 18 shows more recent historical trends alongside projections from the outlooks in this year’s GEO. Improving energy intensity is one way of reducing future CO2 emissions. The scenarios with less aggressive emissions reductions, such as BP BAU and IEA STEPS, feature declining energy at rates roughly consistent with historical experience. By contrast, the outlooks that are consistent with more aggressive emissions reductions, such as the IEA’s SDS, BP’s Rapid and Net Zero, and IP1-2, feature accelerated reductions in energy intensity.
Figure 18. Historical and projected future global energy intensity