Beyond Clean Energy: The Financial Incidence and Health Effects of the IRA
This RFF report examines the emissions, health, and financial impacts of the 2022 Inflation Reduction Act (IRA), finding that the law will unlock a new reality for the electricity grid and households in America.
1. Introduction
The Inflation Reduction Act of 2022 (IRA), signed into law by President Biden on the August 16, 2022, will affect household budgets and wellbeing in several ways. The law contains provisions to promote clean energy technologies, facilitate domestic energy production, and address global warming, along with health care and tax provisions. In light of the legislation’s title, a key question is how the energy and climate provisions will affect energy prices and household expenditures. The effects of the monumental legislation also derive from its provisions to raise revenue as well as bring about changes in environmental and public health. The effects will vary across different types of households, distinguished by their consumption of electricity and other goods, their levels and sources of income, and where they live.
We employ three models in tandem to examine the effects of the IRA’s tax provisions focused on grid-connected electricity generation. We do not address the green bank, tax credits targeting low-income and tribal communities, or home energy investments. First, we deploy RFF’s Haiku Electricity Model to project investment in the electricity sector and changes in emissions and electricity retail rates. We model a range of potential scenarios that account for variability in future fuel prices and changes in electricity demand that would arise from faster electrification. We ran additional scenarios varying capital costs of renewables and combining sensitivities. These results were not informative to the scope of this report but did confirm the robustness of the results that we display. Second , we use RFF’s Social Welfare Incidence Model to estimate the financial impacts of changes in expenditures and taxes for households distinguished by household-specific expenditure patterns and levels and sources of income. Third, we map associated reductions in emissions of sulfur dioxide (SO2) and nitrogen oxides (NOX) from Haiku into the EASIUR atmospheric transport model to estimate their effect on concentrations of fine particulate matter (PM2.5), the primary atmospheric pollutant affecting human health. We estimate these changes at the county level and compare to demographic characteristics of affected counties.
We find the distributional impact of the modeled cost reductions and tax changes are uniformly progressive. We estimate a reduction of 7.3 percent in electricity prices over the next decade in our central case compared to 2022 modeled electricity prices. EIA’s September 2022 Short Term Energy Outlook estimates 2022 average retail electricity price to be approximately 12.06 cents per kWh, slightly higher than our model’s estimate of 11.91 cents per kWh for 2022. Because low-income households spend a larger share of their income on electricity than high-income households, these savings provide the greatest benefit as a percentage of household income to lower-income households. Electricity bill savings result from the investment in clean energy technologies supported in part by tax incentives funded by [HC3] [KP4] an increase in corporate income taxes. The tax increases fall most heavily on households earning capital income, which are typically higher-income households. We observe a net shift in costs from consumers to taxpayers that is strongly progressive.
Rapidly decarbonizing the electricity sector is a critical element of the Biden administration’s efforts to achieve a 40 percent reduction in US greenhouse gas emissions by 2030. This is, in part, because such decarbonization enables electrification and emissions reductions in other parts of the economy, including transportation and buildings. The reduction in electricity prices can be expected to accelerate electrification of other parts of the economy, further advancing climate policy goals. We find that IRA-driven CO2 emissions reductions in the electricity sector can be achieved at an average cost that is below estimates of the social cost of carbon. All emissions are reported in metric tons. Power sector CO2 emissions reductions are also accompanied by substantial improvements in air quality resulting from reductions in SO2 and NOX, reducing the negative effects of power generation on air quality by nearly half. The benefits accrue broadly across racial, ethnic, and income groups.
Our findings indicate that the IRA’s pocket-book effects are progressive across income groups and that its air quality benefits will be distributed widely across the population. The IRA is likely to have the most substantial effects of any federal policy on environmental outcomes, and specifically climate change, since the Clean Air Act of 1970.
2. Summary
The tax provisions of the IRA will affect electricity prices, tax burdens, emissions, and public health. We examine each of these effects from a distributional perspective, with consideration of alternative scenarios regarding future natural gas prices and electricity demand. Further details of these scenarios and modeling results are described in subsequent sections of this report.
Our projections indicate the IRA accelerates emissions reductions in the electricity sector, reduces electricity prices, and provides a progressive cost shift from consumers to taxpayers to pay for the program. Substantial air quality benefits also result, accruing notably in regions of the country most affected by the decline in fossil fuel electricity production.
The IRA is one of four significant changes in federal policy that will affect the future of US energy supply and use. The Infrastructure Investment and Jobs Act (2021) provided billions of dollars in spending for clean energy infrastructure including public transit, rail, support for nuclear power, broadband, and carbon management. The CHIPS Act (2022) allotted billions of dollars to rebuild the US semiconductor industry, which will provide crucial components for the energy transformation. Further, the renewed development of new environmental regulations by the US EPA represents another important change in the incentives facing the existing fossil fuel industry. Taken together, these policy shifts are likely to amplify the changes that we identify in this study.
2.1. Electricity Prices
Across the policy scenarios we examine, we find the IRA yields a reduction in national average retail prices of electricity of 5.7 to 7.8 percent over the next decade relative to 2022 modeled prices. Nationwide, electricity consumers will save $288-$345 billion relative to baseline. All dollar values are in 2022$ unless otherwise noted. The average household will experience $235-$282 in savings annually over the next decade due to the policy. This estimate assumes that all savings from lower electricity rates that are not directly experienced by households are passed on to households through lower prices of products and services. Because lower-income households spend a greater portion of their income on electricity than higher-income households, we find the distribution of the effects of electricity price changes on households to be progressive, benefiting low-income households the most in relative terms.
2.2. Financial Effect on Households
The transition to clean energy will save money for consumers and businesses, but it will impose costs on taxpayers. The IRA is paid for primarily through increases in corporate income taxes. We assume 75 percent of that tax burden falls on owners of capital, so the IRA’s tax burden falls more heavily on upper-income households that receive the largest share of capital income.
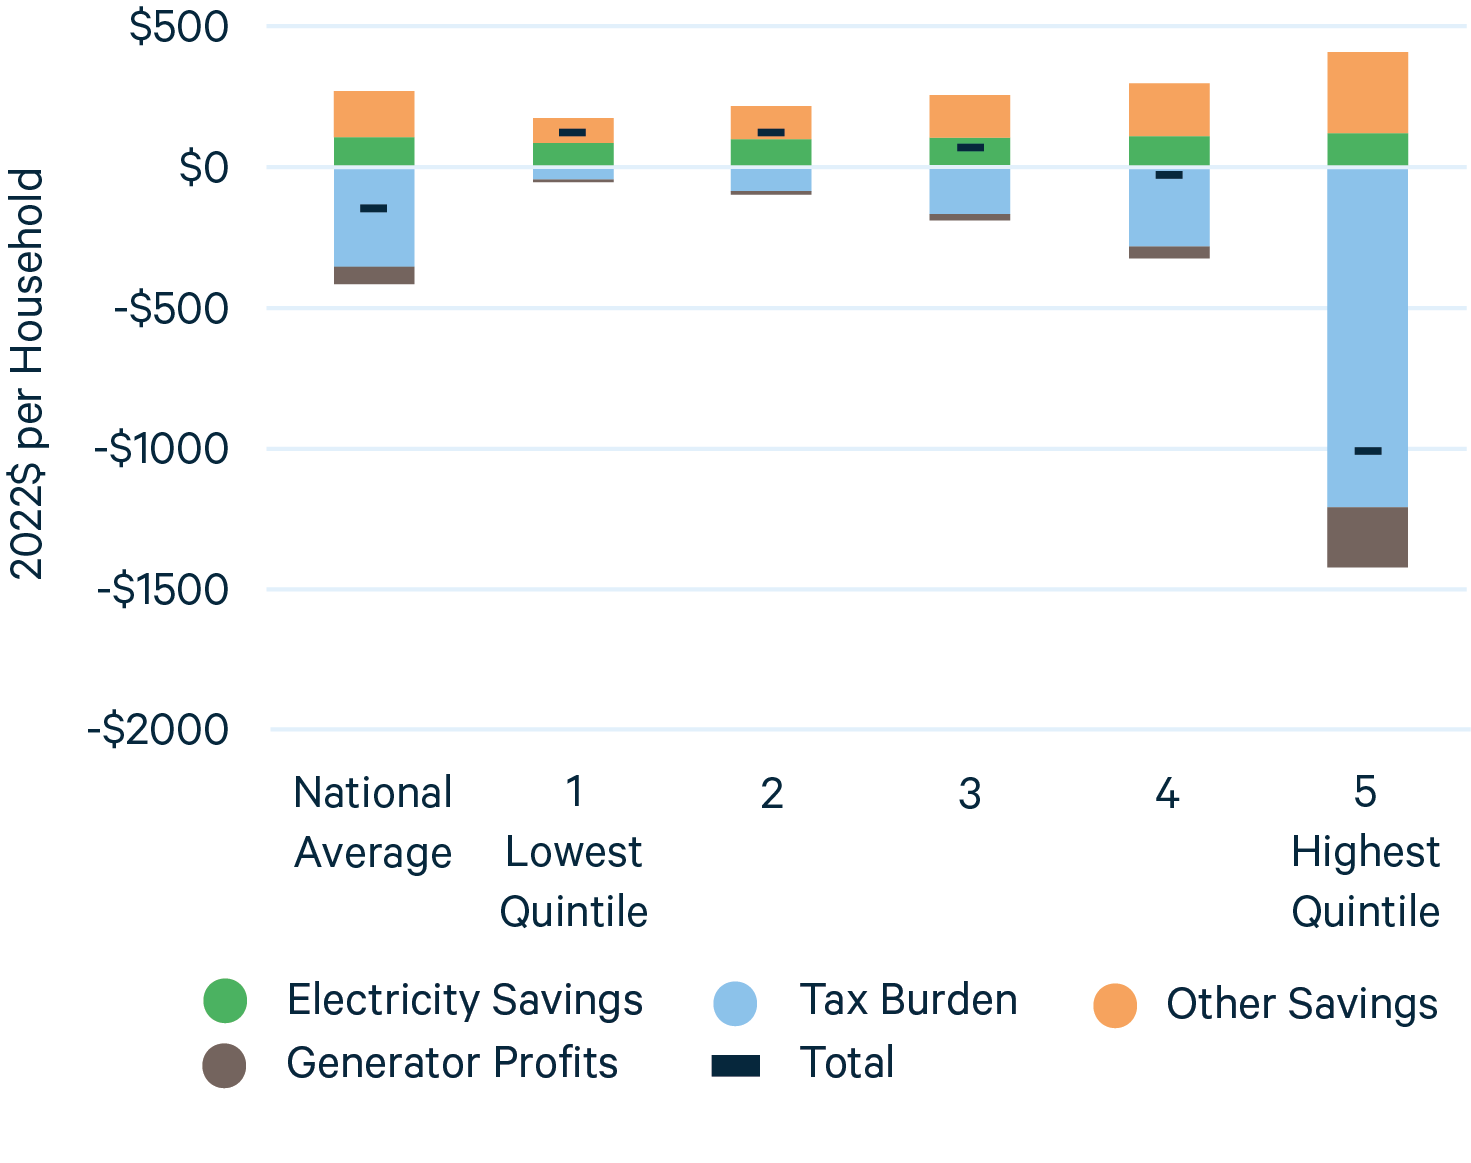
We find the demographic characteristics of this shift in costs from consumers to taxpayers to be progressive overall, with a reduction in net annual household costs among the three lowest-income quintiles of $123-$66 and an increase in the top income bracket of about $1,014.
2.3. Emissions
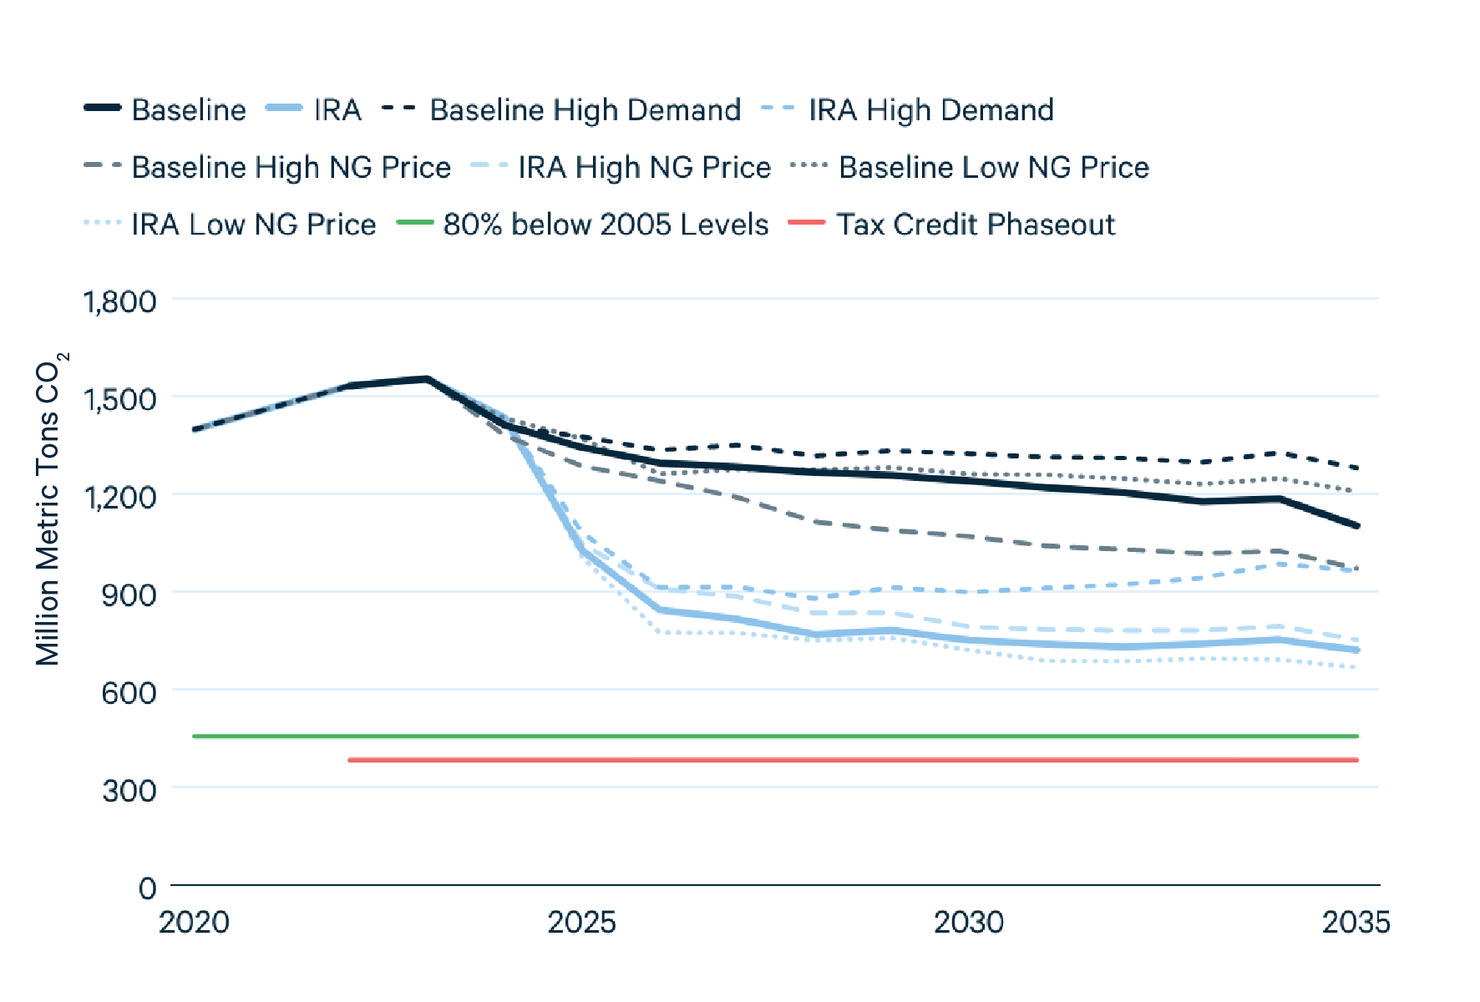
Investment in the clean energy transition will reduce annual CO2 emissions from the power sector by 277 to 540 million metric tons in 2030 compared to the relevant no-policy baseline scenario, as shown in Figure 1. Electricity sector emissions are projected to be 61 to 68 percent below 2005 levels in 2030. The decline in electricity prices can be expected to complement the incentives for electrification of transportation, buildings, and industry, which exist in the IRA. The emissions reductions in other sectors from switching away from fossil fuels to electricity are not modeled in this report, but the increased electricity demand is represented in our “High Demand” scenario. The investment in a broad portfolio of energy technologies will raise the share of clean electricity to 69 to 75 percent of the nation’s mix of generation resources, from roughly 38 percent today.
Expansion of clean electricity generation will also reduce conventional air pollution. We expect emissions of SO2 to fall by 37-63 percent from 2022 levels by 2030, resulting in emissions levels that are 3.7-6.2 percent of the electricity sector emissions in 2005. Emissions of nitrogen oxides will fall by 36-53 percent of 2022 levels, to emissions levels that are 12-16 percent of electricity sector emissions in 2005.
Figure 1. CO2 Emissions Trajectories Under Different Baseline and Policy Scenarios
2.4. Health Effects
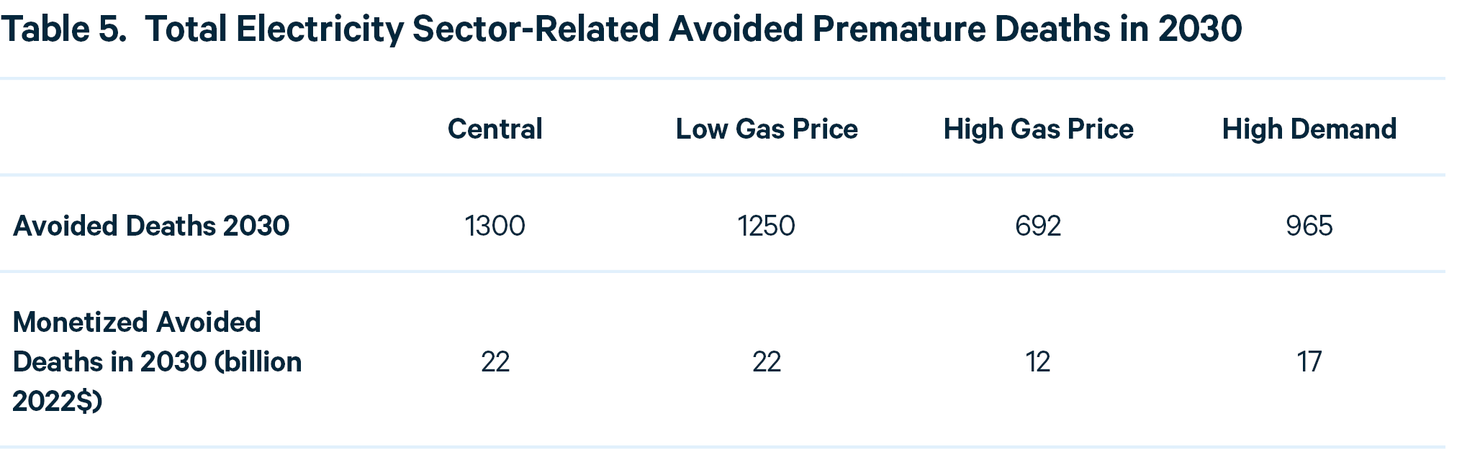
These emissions reductions are most prominent in the central and southeastern parts of the country. At a national level, we find the IRA will reduce premature mortality by 692-1300 lives, yielding $12-$22 billion in monetized benefits from reduced air pollution-induced premature mortality. These health benefits are greatest in per capita terms throughout the broad Midwest and Southeast regions. We overlay health benefits with demographic characteristics at the county level. Aggregating nationally, we find that benefits are distributed broadly across income and racial and ethnic groups.
2.5. Cost Effectiveness
The IRA is projected to drive an increase in investment in clean energy, displacing potential investments in emitting technologies. The shift to clean energy increases capital costs overall while reducing fuel and other operating costs in the power sector. The annualized net change in resource cost from the no-policy baseline totals about $13-18 billion in 2030, a year when many clean energy investments will be in place. We estimate the partial equilibrium cost per ton of CO2 emissions reduction achieved under the IRA to be $43-54 per metric ton. This cost compares with the current federal government estimates of the marginal benefit of reducing a ton of emissions – the social cost of carbon – of $51 per ton (2020$), which grows to $62 per ton by 2030. The current federal estimates are being revised by executive order to incorporate the latest science. A recent comprehensive estimate of the social cost of carbon found a much higher mean estimate of $185 per ton (2020$), which grows to $226 per ton by 2030.
3. How the Act is Modeled
Central to the IRA’s power sector provisions is a long-term extension and reformation of clean energy tax credits, including the production tax credit (PTC) and investment tax credits (ITC) for solar, wind, and storage, which are adjusted for inflation. The IRA extends and modifies these provisions until 2025 before transitioning them to an analogous new set of technology-neutral production and investment tax credit provisions that support non-emitting electricity generation drawn from the Clean Energy for America Act. In addition, the IRA enables tax-exempt entities to take advantage of the provisions and modifies the transferability of tax credits to facilitate their monetization. The IRA increases the tax credits for carbon capture and storage to $60-$85 per metric ton (which we model only for new construction) that adjusts for inflation after 2025 and provides a new production tax credit for existing nuclear electricity-generating units (which we do not include, and instead model as maintaining baseline nuclear generation). The Act also implements a methane fee and enhances the ability for elements of the industry to monetize these tax credits. We assume the enhanced opportunity to monetize the tax credits increases the value of the tax credits to investors by 10 percent, realizing most but not all the benefits of direct pay. Previously, roughly 40 percent of qualifying generating capacity hasn’t been able to receive or utilize the incentive historically due to the lack of this provision. Previous RFF analysis (Prest 2022) finds that the methane fee will have limited impact on the price of natural gas, so we exclude its impact from our analysis.
The tax credits represented in our modeling are only those for electricity generating capacity. We do not represent IRA provisions that subsidize the domestic manufacturing and production of inputs to electricity generation, thereby reducing the capital costs of qualifying generation. Additionally, domestic manufacturing can reduce bottlenecks in the energy supply chain that could contribute to inflationary pressures. The omission of these provisions makes our estimates of retail electricity savings conservative. The only additional provision of the IRA that could raise retail prices is the methane fee. Previous RFF analysis has shown, however, that a methane fee that is even more stringent than what is provided for in the IRA would have minimal impact on natural gas fuel prices and hence have limited impact on the retail price of electricity.
The Act is modeled using RFF’s Haiku electricity market model, which solves for changes in electricity generating capacity and system operation at the state level, adjusting supply to minimize system cost to meet demand with capacity reserve margins and interstate transmission over a twenty-five-year horizon. The model calibrates electricity demand to the Annual Energy Outlook 2021, which we categorize into twenty-four time-blocks for each year. States are categorized into organized markets and cost of service regions of the country.
To enhance the emissions reductions of these policies while also reducing energy costs and addressing long-term economic goals, the IRA provides bonuses for projects that meet specific labor standards, are built in areas defined as “energy communities,” and use domestic content. These features support the transition to a clean energy industry in communities tied to existing energy production and will either increase the 30 percent ITC up to as high as 50 percent or, if a project opts for the $25/MWh production tax credit (PTC), it can qualify for up to $30/MWh by meeting these standards. To represent projects in energy communities, we draw from other RFF expert analysis (Raimi & Pesek 2022) of energy communities and apply a partial credit equal to the percent of land area in the state that qualifies under the energy community definition. For the domestic content bonus, we introduce 20 percent of the credit in 2026 to all projects and linearly increase it up to the full credit by 2030.
To assess uncertainty, we examine the IRA’s sensitivity to variations in fuel prices and electricity demand growth. We account for recent increases in natural gas prices and vary these prices into the future to describe low and high price scenarios. We initially calibrate our reference case to fuel prices in the AEO 2021, which did not anticipate the increase stemming from supply disruptions associated with the war in Ukraine and other factors. We represent the recent spike in gas prices by increasing the 2022 price to twice the level of the AEO reference case (for all our sensitivity cases). We then have natural gas prices decline linearly to adjusted long-term projections by 2026 based on natural gas future prices from Henry Hub, noting that gas prices have fluctuated historically and, at one point a decade ago, fell by a factor of 7 in just four years. See appendix for the natural gas price trajectory. In sensitivity analysis, we consider prices similar to AEO’s low and high oil and gas supply scenarios, increased by the same amount as our reference case to match current projections.
We also consider a higher-demand trajectory to serve as a proxy for potential accelerated electrification of the economy in the future. We use the increase in electricity demand modeled in the “high electrification” scenario in the National Renewable Energy Laboratory Electrification Futures Study (NREL-EFS) that results in an 8 percent increase in electricity demand in 2030 relative to the no-policy baseline (Mai et al. 2018). We also explored alternative implementations of the bonus provisions of the Act and alternative renewable capital costs, all of which fall within the range of the natural gas price sensitivities and hence are not displayed in this report.
The tax credits in the IRA function as a payment to qualifying generation. In cost-of-service regions, the value of the payment reduces the revenue requirement for utilities, causing electricity prices to fall. In competitive markets, the payment reduces the bids from generators, thus bringing down wholesale power prices. Therefore, electricity rates go down as new generation comes online. For these reasons, the tax credits align the interests of ratepayers and grid operators such that, as major energy investment takes place, ratepayers save money. Households benefit directly from reduced electricity prices and indirectly from reduced the costs of goods and services from businesses and industry that also benefit from reduced electricity prices.
4. Effects of the IRA on the Electricity Sector
4.1. Electricity Generation
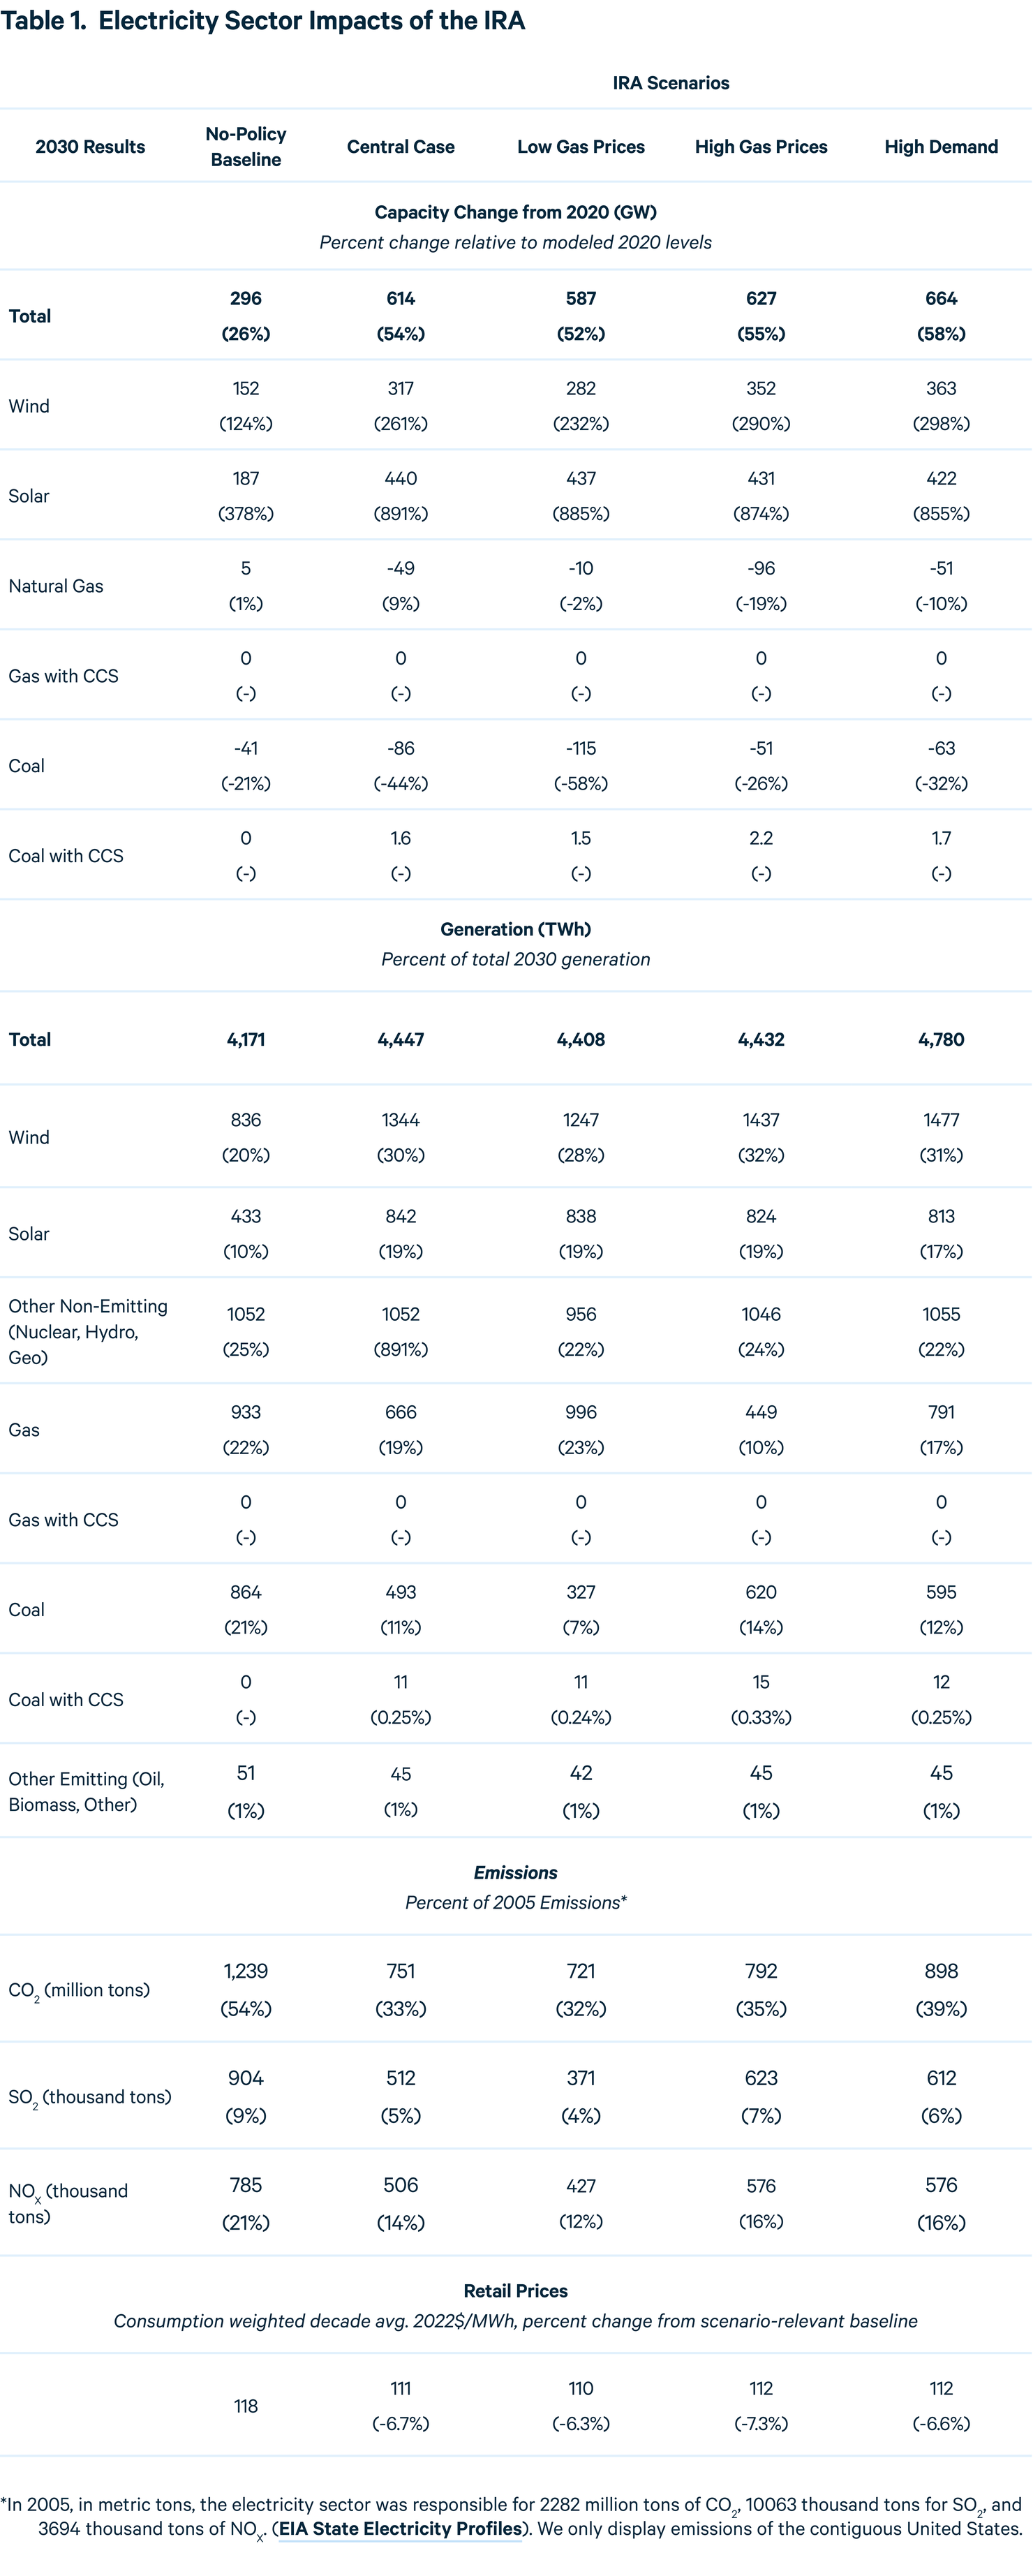
The IRA leads to a sharp increase in investments in clean energy. By 2030, in the central case analysis, nationwide additions to capacity are projected to be 253 GW for wind, constituting a more than 100 percent increase relative to the baseline scenario and a 261 percent increase relative to modeled 2020 levels. Solar capacity grows by 392 GW, 2.3 times the growth in the baseline, and reaching 891 percent of modeled solar capacity in place in 2020. Although there is net retirement of natural gas units relative to modeled 2020 capacity, 38 GW of new gas capacity is added. There is also capacity growth for new coal with carbon capture and storage, a technology that receives incentives under the IRA’s expanded 45Q tax credit. We model only new gas and coal CCS, not retrofits to existing coal and gas plants. Total new gas CCS capacity is limited to under 20 GW and new coal CCS to under 5 GW.
These investments cause generation from solar and wind to expand from 30 percent of total generation in the 2030 no-policy baseline to 49 percent in the central case IRA. We assume the support for nuclear power sustains the level of generation observed in the no-policy baseline, which constitutes 18 percent of total generation in 2030. Nuclear generation capacity evolves according to planned retirements. Recently announced changes in retirement plans, including a life extension for Diablo Canyon, are not reflected in the model. Generation from coal and natural gas combined decline from 60 percent of the 2020 total to 43 percent in the 2030 no-policy baseline and 26 percent in the central case IRA. Coal’s share of total generation from fossil resources grows to 43 percent in the central case IRA, compared to its 34 percent share of total fossil generation in 2020.
The substantial shift to non-emitting resources causes electricity sector CO2 emissions to fall by 488 million metric tons in 2030 relative to the no-policy baseline. Emissions of SO2 and NOX fall accordingly. These national-level outcomes are summarized in Table 1.
In sensitivity analysis, we find that the variation in natural gas prices has little to modest effects on investment but more substantial effects on generation. High gas prices lead to more investment and generation from renewables and more generation from coal, leading to an increase in emissions when compared to low price (high supply) forecasts. In the high-demand scenario, we find that the increased demand is met primarily by an increase in generation from coal, natural gas, and wind. The emissions consequences in the electricity sector from increased demand total an additional 163 million metric tons CO2 in 2030, as shown in Table 1.
4.2. Retail Price Effects
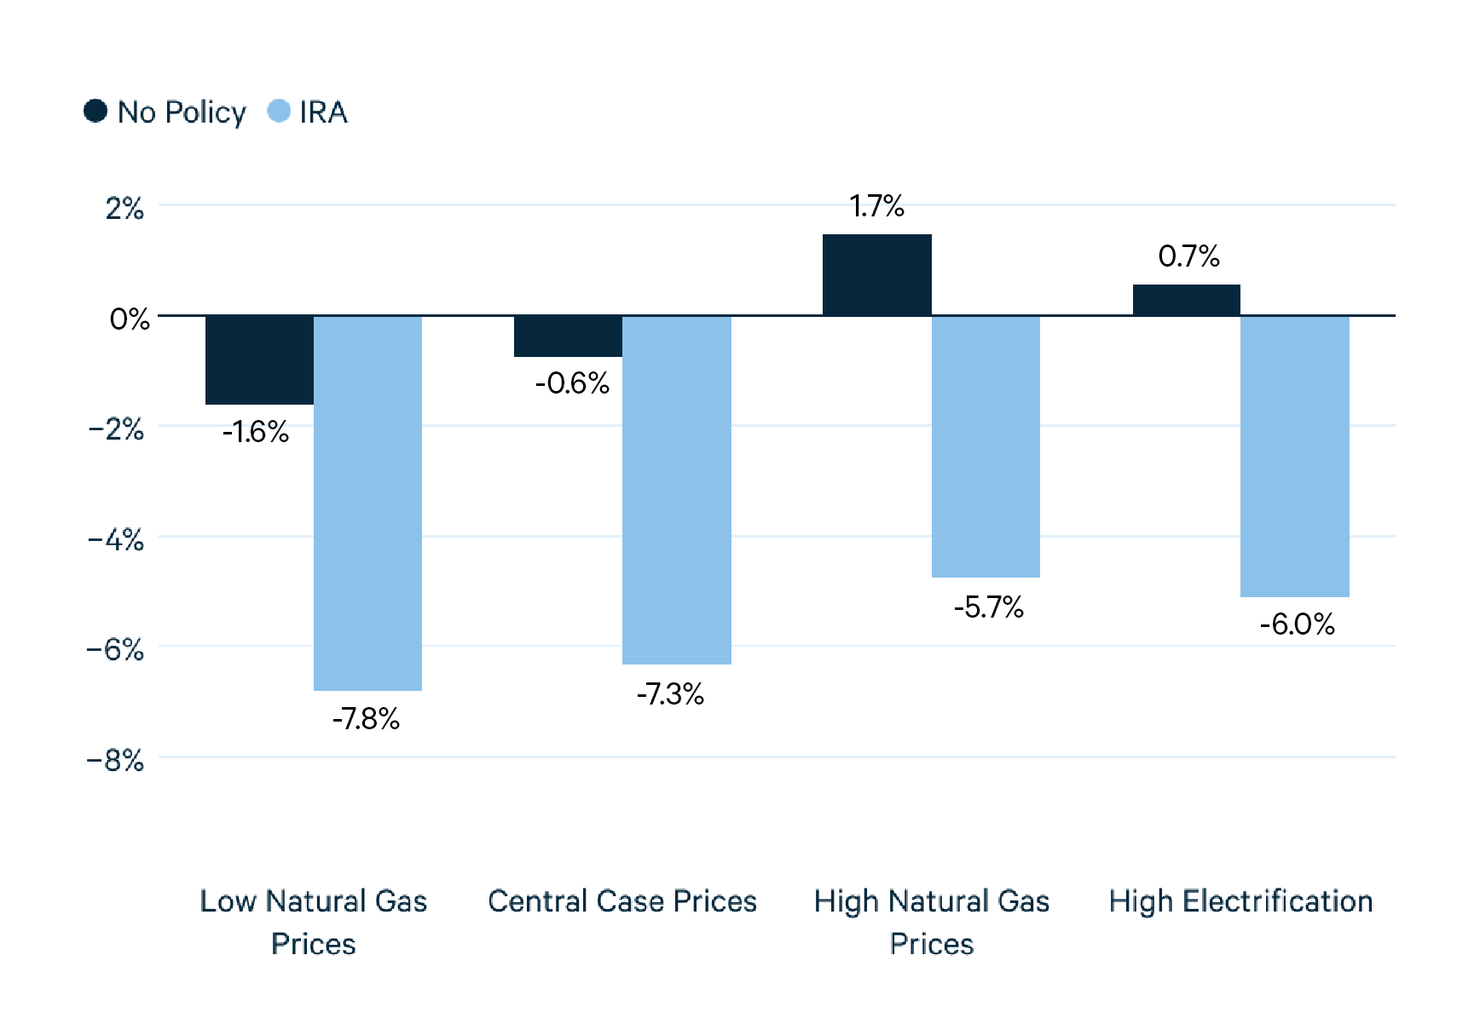
Figure 2 illustrates that retail electricity prices fall by 5.7 to 7.8 percent over the next decade compared to modeled 2022 levels across all the scenarios we analyze under the IRA. We compare the average change in retail prices in the no-policy baseline to the policy scenarios under expected natural gas prices, as well as under alternative modified gas price scenarios from AEO 2021.
With central case projections of future natural gas prices, national retail electricity prices are expected to decline 6.7 percent more on average over the next decade under the IRA than in the baseline. Even if natural gas prices deviate from this path, as they have recently due to global shocks in fuel prices, the deflationary effects of the IRA on electricity price changes are projected to be similar across the range of natural gas price scenarios. Even in the worst-case scenario for consumers, under which higher fuel prices cause retail electricity prices to increase relative to the no-policy baseline we project retail rates to decline up 5.7 percent on average with the IRA. If natural gas supply expands and prices fall, ratepayers could expect price reductions of close to 8 percent under the policy, 6.2 percent greater than in the low gas price, no-policy baseline case.
Overall, the pace at which retail prices decline under the IRA is projected to be much greater than the decline anticipated in the no-policy baseline embodied in the AEO 2021 forecast. After concerns of inflation subside, the lower retail prices also provide cushion for potential increases in electricity rates to compensate for rapid electrification that could take place later in the decade. Lower electricity prices under the IRA also can be expected to accelerate electrification of transportation and buildings, which would likely complement US climate policy goals and provide additional household savings. The IRA provides additional incentives for energy efficiency and electrification not modeled here that are expected to provide substantial additional savings to consumers. Rewiring America. 2022. The Electric Explainer: Key Programs in the Inflation Reduction Act and What They Mean for Americans. Our results indicate that even with this electrification, the tax credits still reduce electricity rates substantially below baseline levels.
As the IRA lowers electricity rates, it may also reduce volatility in electricity prices caused by volatile fuel prices. The range of electricity prices across our different natural gas price projections is smaller with the IRA policy (less than a 2.1 percentage point range) than without it (greater than a 3.3 percentage point range) as illustrated in in Figure 2. By reducing the contribution of natural gas to electricity supply, the IRA insulates future electricity rates from these costs and provides a buffer against future gas price fluctuations. The volatility in electricity prices in both the baseline and the sensitivities is smaller in magnitude than identified previously in (Roy et al. 2022) due to the refined natural gas price projections.
Figure 2. Percent Change Relative to 2022 Levels of Retail Electricity Price (Average 2023-2032)
The retail price effects of the IRA have two components: changes in electricity system resource costs and the renewable tax credits. The increase in electricity system resource costs is partially offset using federal tax credits. The model allows new wind and solar investors to choose between the PTC or ITC based on which approach is more valuable. The PTC is earned in the current year of production. The ITC is earned in the year in which investment happens, but its value is spread over the life of the investment in our accounting of impacts on producer profits. One justification for this approach is that regulated utilities have the requirement of normalization of the ITC over an asset’s lifetime. For independent power producers, normalization is not required but the value of the ITC relies on the supply of tax equity, so its value may be realized over multiple years. For our purposes, we note that the investments will yield zero-emission electricity and implicit emissions reductions over the facility’s lifetime.
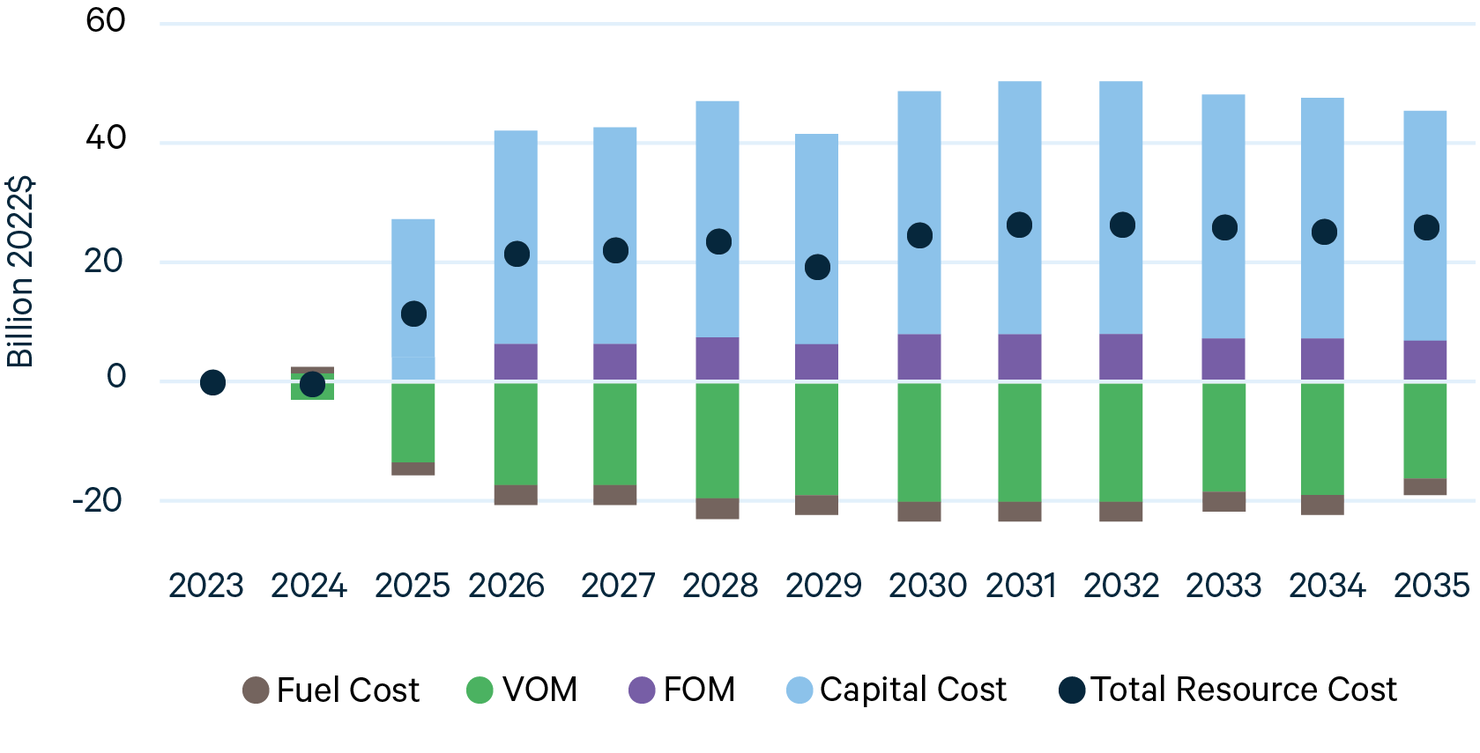
Resource cost changes include increases in fixed costs broken out as capital costs and fixed operation and maintenance (FOM) and decreases in variable costs represented as fuel costs and variable operation and maintenance (VOM). Figure 3 shows annual changes from baseline in each of these cost components under central case natural gas prices. Increased resource costs are expected in any policy case as the tax credits lead to the building of new capacity that would not be economic without the policy.
Figure 3. Changes in Electricity System Resource Costs
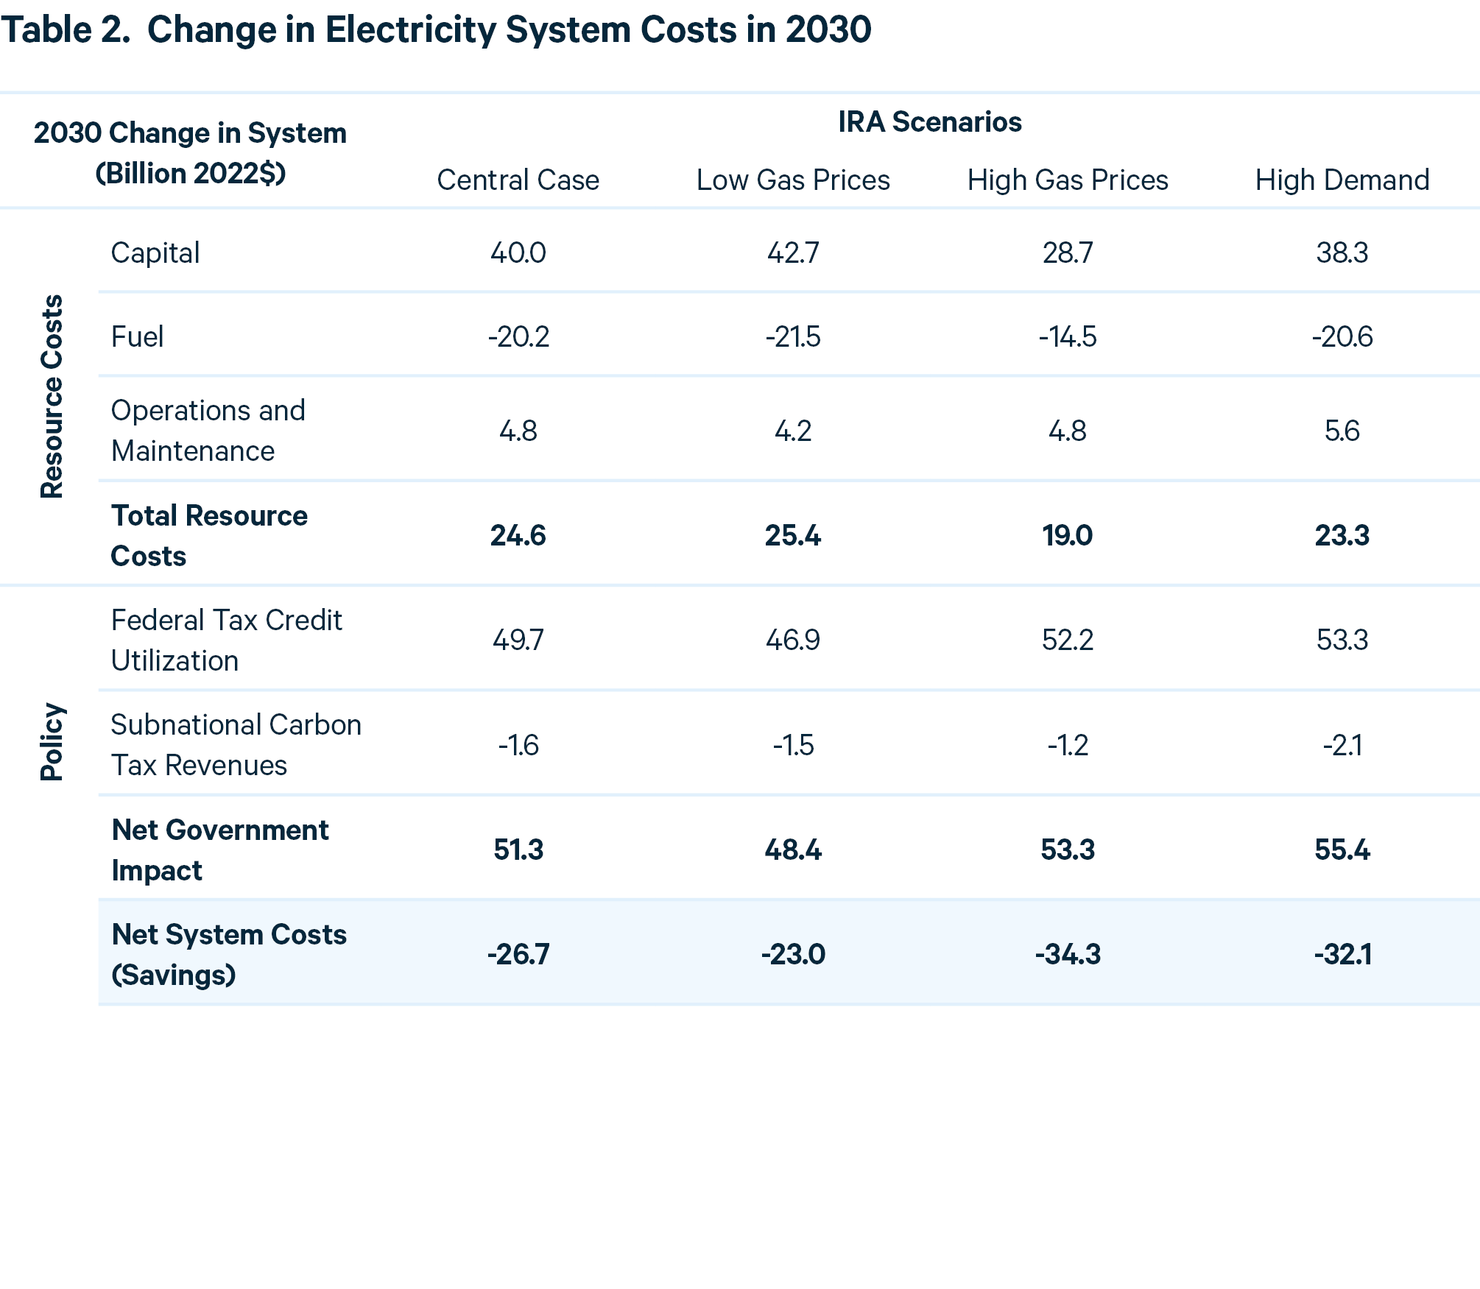
Net system costs are calculated as the difference between the net change in resource costs and the utilization of the tax credits provided in the IRA. Table 2 reports the total change in resource costs — estimated to be approximately $25 billion in 2030 (2022 $) — and compares this with government tax credit expenditures to estimate a decrease in net system costs of $26 billion in that year. Our system costs calculations assume fixed transmission and distribution costs per unit of capacity.
The net annual reduction in system costs drives the reduction in retail prices in 2030. Figure 4 shows that prices begin a sharp decline as early as 2023 under all natural gas price scenarios. The model does not allow for new capacity not already in the planning phase to be built in 2023, so reductions in that year result solely from tax credit savings associated with planned investments present in the baseline. While this generation may be inframarginal (i.e., it doesn’t require the tax incentives for it to be built), it will begin a path of immediate reductions in expected electricity rates. Ratepayers should therefore experience the impacts of the tax credits as soon as the first qualifying units in their service region are operational. Annual capacity growth after 2023 is also constrained from achieving an unrealistic pace (as discussed in the methods section) to represent potential bottlenecks in siting and related issues.
Figure 4. Retail Price Paths
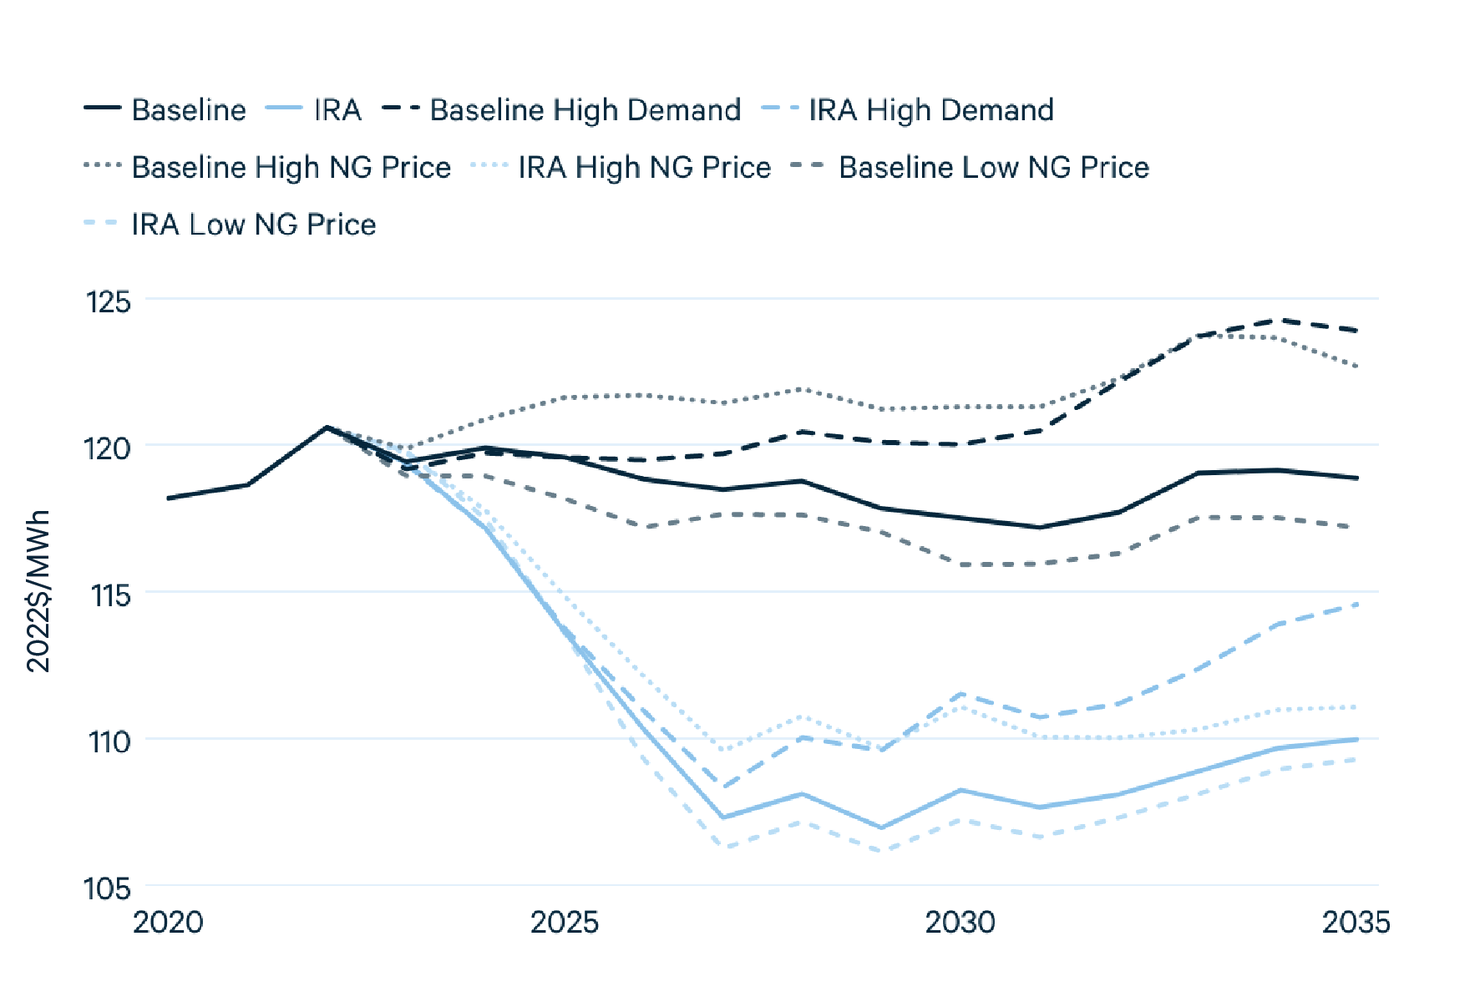
Figure 4 shows that the range of retail prices across the policy scenarios is smaller than in the no policy cases. By 2027, retail electricity prices under even the highest natural gas prices are well below the no-policy baseline.
4.3. Producer Profits
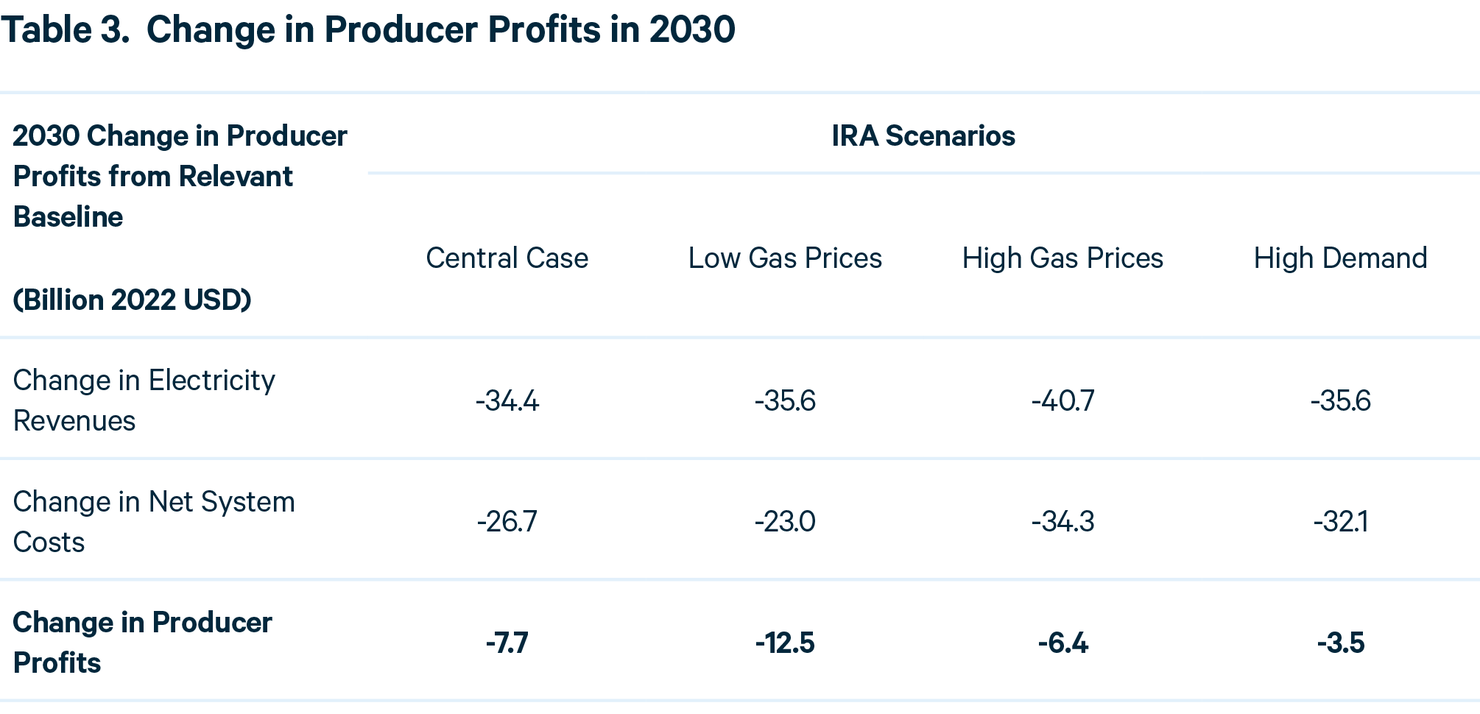
In addition to the impacts on consumers, the IRA will also affect the profits of electricity generators. In Table 3, 2030 producer profits in the central case analysis are estimated to decrease by $7.7 billion relative to the central case no-policy baseline. We assume that retail rates in cost-of-service regions exactly equal average system cost per MWh, so the change in profits occur entirely in regions with competitive electricity markets. In cost-of-service regions, utilities are required to normalize tax credits, i.e., incorporate credit value into the rate base over the payback period of the qualifying investment, which we assume to be 20 years. We apply a similar normalization in competitive regions when calculating profits; however, in practice, the tax credit value is likely to be realized on a shorter time frame that aligns with the availability of tax equity, making them more valuable to the firm. As a result, this method is likely to underestimate profits.
Changes in profits are estimated relative to the scenario-relevant baseline. Profit decreases in 2030 under the IRA are smallest in the high electrification scenario and the greatest reduction in profits occurs under the low natural gas price scenario. The IRA restructures the utility and generator business models to step further away from natural gas (even in market conditions with low prices). Both the relative cost competitiveness of renewables over natural gas and the electrification of other sectors should accelerate long-term climate benefits. In the next section we ask: which households in the US will benefit from these reductions in both prices and emissions, and who will pay for the investment that enables them?
5. Distributional Effects Across Households
5.1. Financial Effects
Households experience four main financial effects of the IRA: reduction in residential electricity costs, reduced costs of other goods and services due to lower electricity costs elsewhere in the economy, changes in generator profits that flow to capital owners, and increases in taxes associated with new government expenditures. The incidence of these four financial effects varies by region, income level, and other demographic characteristics. We use RFF’s Social Welfare Incidence Model to examine how these changes will affect households across national income quintiles.
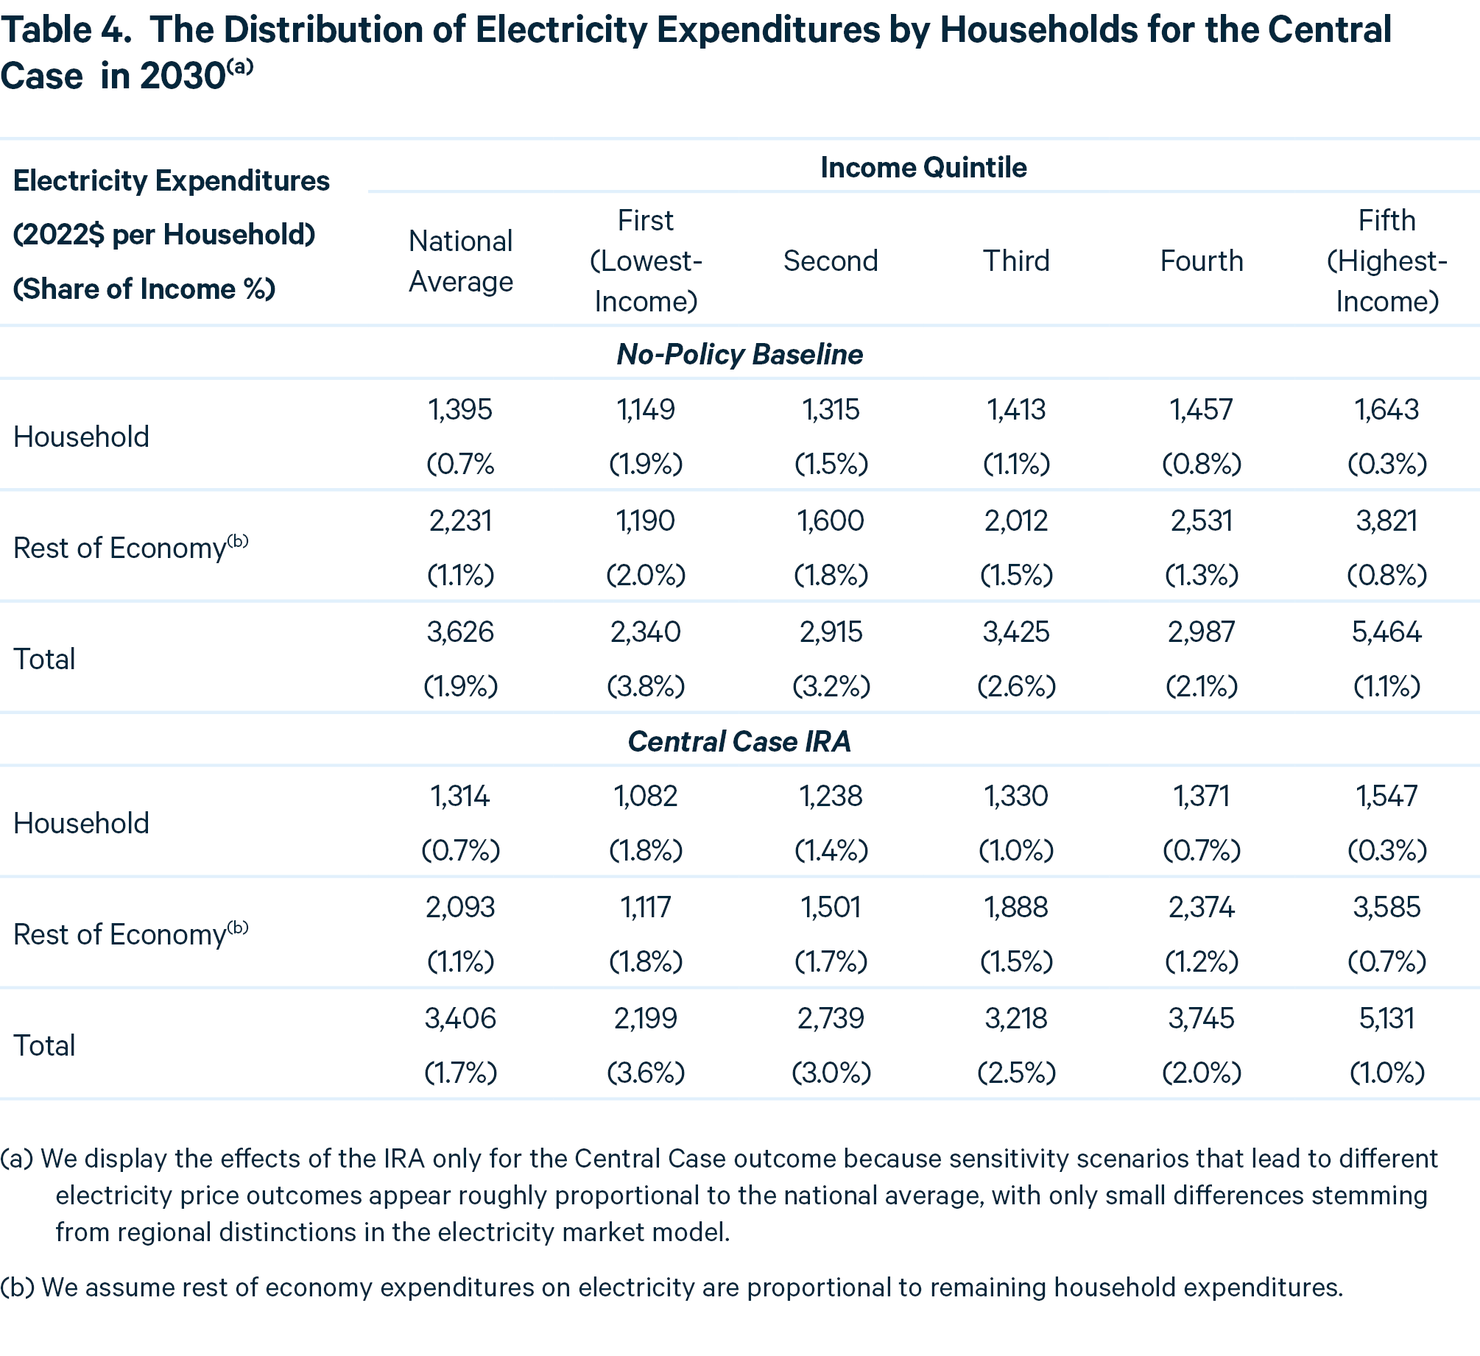
The Social Welfare Incidence Model distributes changes in expenditures on residential electricity consumption proportional to current household electricity expenditures. Since residential electricity consumption constitutes only 37 percent of the national total, we assume that changes in electricity expenditures elsewhere in the economy flow through to households as changes in the price of goods and services and accrue in proportion to all other household expenditures. As Table 4 shows, electricity consumption and expenditure grow with income, so the higher a household’s income, the more the household spends on electricity. As a share of household income, however, the pattern is reversed: the lowest-income households spend the greatest share of income on electricity.
The renewable energy incentives in the IRA are paid for through an increase in the corporate income tax. The Social Welfare Incidence Model assumes a balanced budget constraint for government, meaning that any change in government spending requires a corresponding change in revenue. We follow assumptions by the Joint Committee on Taxation and assume that 75 percent of the tax burden associated with the corporate income tax falls on owners of capital (of which 10.8 percent is assumed to be foreign owned capital) and 25 percent falls on labor. In addition, we assume that changes in producer profits fall on the owners of capital and distribute the domestic share of these profit changes proportional to existing capital income. As high-income households are the primary recipients of capital income, changes in taxes and generator profits are mostly experienced by high-income households.
Because the tax system is modestly progressive and electricity expenditures as a share of income appear regressive, the cost shift from ratepayers to taxpayers is overall progressive. The average household sees a reduction in electricity costs of $270 and an increase in taxes of $359, but most of the income distribution experiences more cost savings than tax increase. Figure 5 shows the distribution across income quintiles of the combined effect of changes in electricity expenditures, other household expenditures, capital income received from generator profits, and taxes for the central case scenario.
The cost shift from ratepayers to taxpayers is not only progressive but also is likely to be efficient. Borenstein and Bushnell (2022) illustrate that all energy sources are mispriced from an efficiency perspective due to the unpriced pollution they emit. Despite that failure to price pollution, the incorporation of other types of program costs into electricity rates means that residential electricity consumers face prices that are above social marginal costs in many areas of the country. For example, in California, households pay retail electricity prices that are two to three times the incremental social cost of electricity generation, making electrification less attractive to consumers while implementing a regressive recovery of electricity system costs (Borenstein, Fowlie, and Sallee 2022). Hence, electricity price reduction may improve efficiency and will accelerate the electrification of other parts of the economy, with associated climate benefits, while improving distributional outcomes.
Figure 5. The Distribution of Changes in Ratepayer and Taxpayer Costs
5.2. Emissions Changes, Air Quality, and Health Impacts
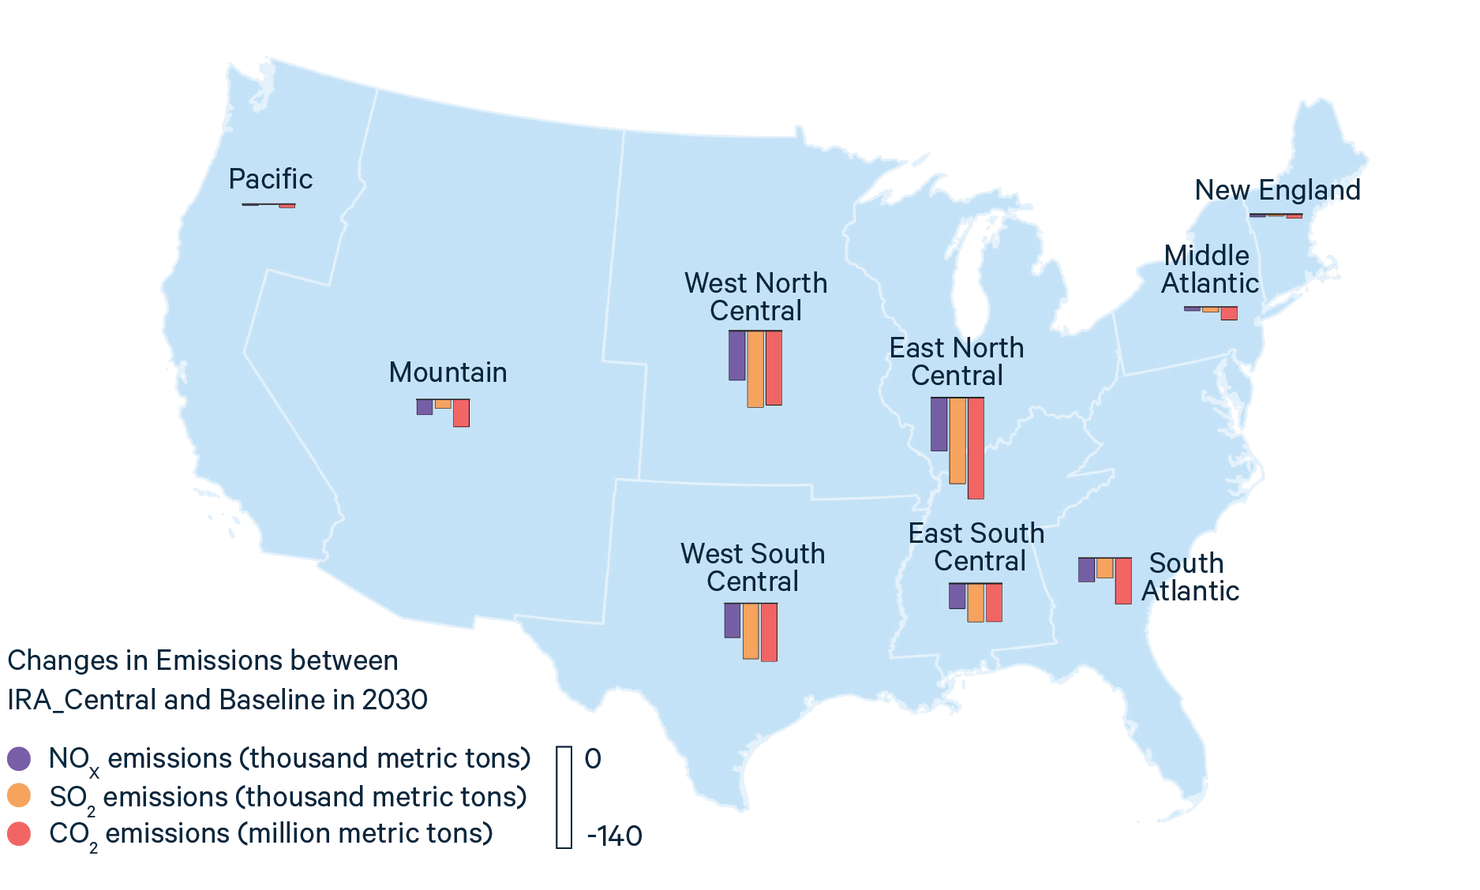
Decreasing reliance on fossil fuels in the electricity sector not only reduces climate pollution, but also conventional air pollutants that affect health outcomes. In particular, emissions of SO2 (a biproduct of coal and oil generation) and NOx (a biproduct of coal, oil, and natural gas generation) are expected to fall under the IRA. Figure 6 shows the spatial distribution of changes in emissions of CO2, SO2, and NOX between the central case IRA scenario and the baseline aggregated to the nine census divisions.
Figure 6. Regional Emissions Changes in 2030
We examine the change in annual premature deaths associated with secondary fine particulate matter (PM2.5) composed of sulfates and nitrates formed by SO2 and NOx. Downscaling the changes in SO2 and NOx emissions displayed in Figure 6 to the county level using the National Emissions Inventory, we calculate air quality changes and health impacts using EASIUR—Estimating Air Pollution Social Impact Using Regression—a reduced complexity model of air quality changes and health impacts built by Heo and colleagues (Heo et al. 2016, 2017). Health effects are based on Krewski et al. (2009) and valued at $17 million per premature death (2022$) in 2030. Further detail is provided in the appendix.
Table 5 reports total avoided deaths and monetized total avoided deaths across scenarios in 2030. Scenarios with the largest reductions in coal generation between baseline and policy (the central and low gas price cases) have the highest health benefits.
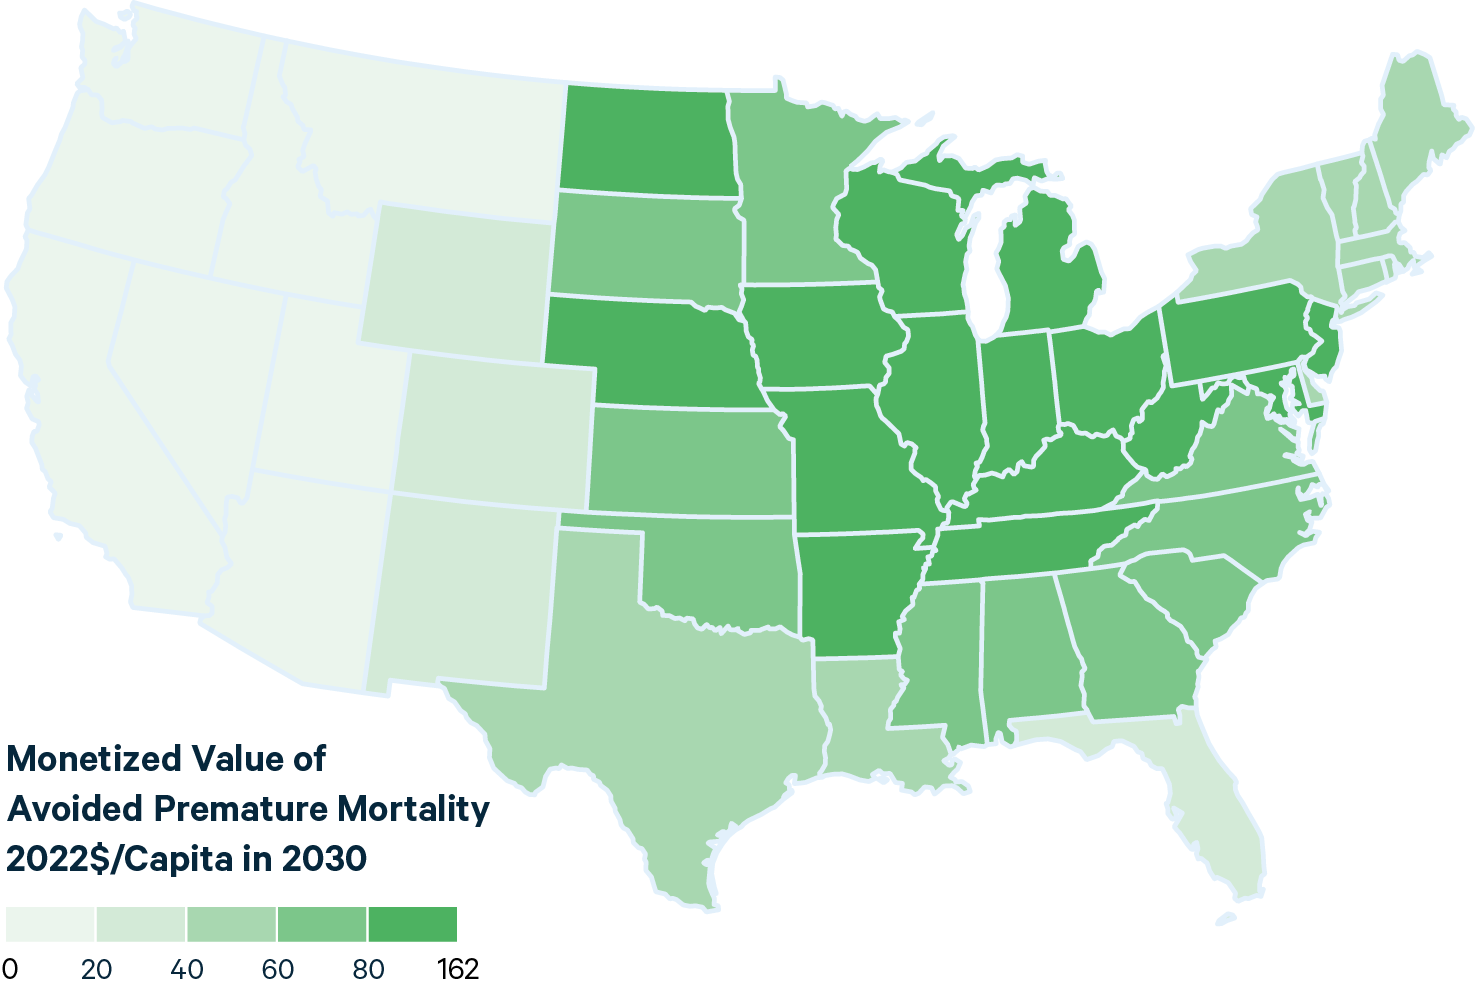
State-level reductions in premature mortality from fine particulate matter are greatest in the eastern US and are greatest on a per capita basis in the Midwest. The monetized value of health benefits from reductions in PM2.5 are $80-$162 per capita in the upper Midwest. Reductions in premature mortality are lowest in the western US, where the electricity sector is already relatively clean. The results aggregated to the state level are displayed in Figure 7.
Figure 7. Electricity Sector Related Monetized Avoided PM2.5 Mortality per capita in 2030
We analyze health outcomes across demographic groups by comparing the county-level health impacts calculated with EASIUR to population characteristics at the county level. Because our methodology links regional pollution changes to historical county-level pollution and population patterns, these demographic impacts assume pollution reductions are distributed similarly to current populations and pollution. Importantly, this analysis does not capture sub-county variation in pollution especially from outside the power sector and where some of the largest disparities in pollution exposure occur (Kheirbek et al. 2013). Nor does it reflect differences in responses to pollution exposure that may apply importantly to specific groups (Spiller et al. 2021) as the baseline mortality rate and concentration-response coefficients included in EASIUR are general population averages.
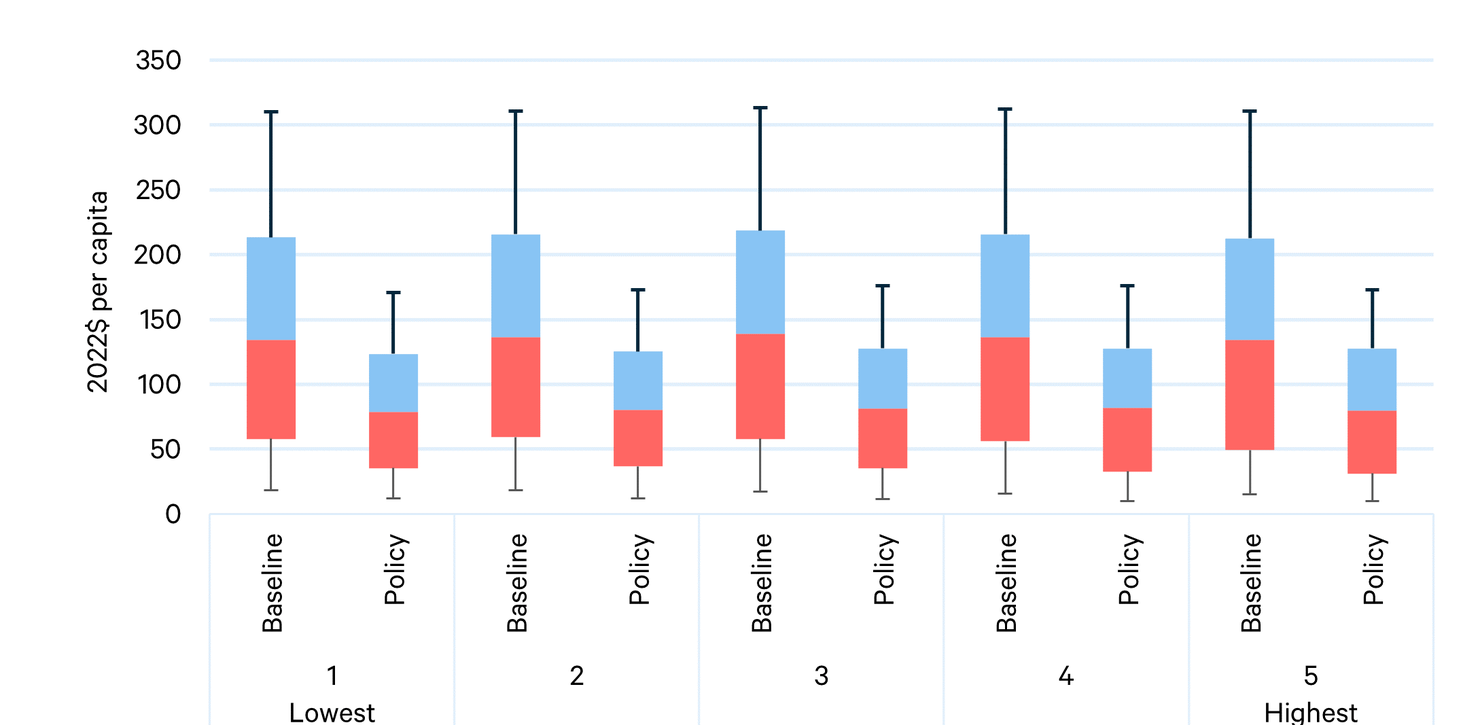
We find the overall national distribution of health improvement is similar across income quintiles, with the median person in each quintile experiencing more than a 40 percent improvement in health benefits associated with electricity sector-related PM2.5. Figure 8 displays the distribution of per capita impacts across people in each group, with quintile one representing the lowest-income quintile and quintile five representing the highest-income quintile. Boxes describe inter-quartile range around the median. Whiskers describe range from the 10th to the 90th percentiles.
Figure 8. Electricity Sector Related Monetized PM2.5 Mortality in 2030 by Income Group
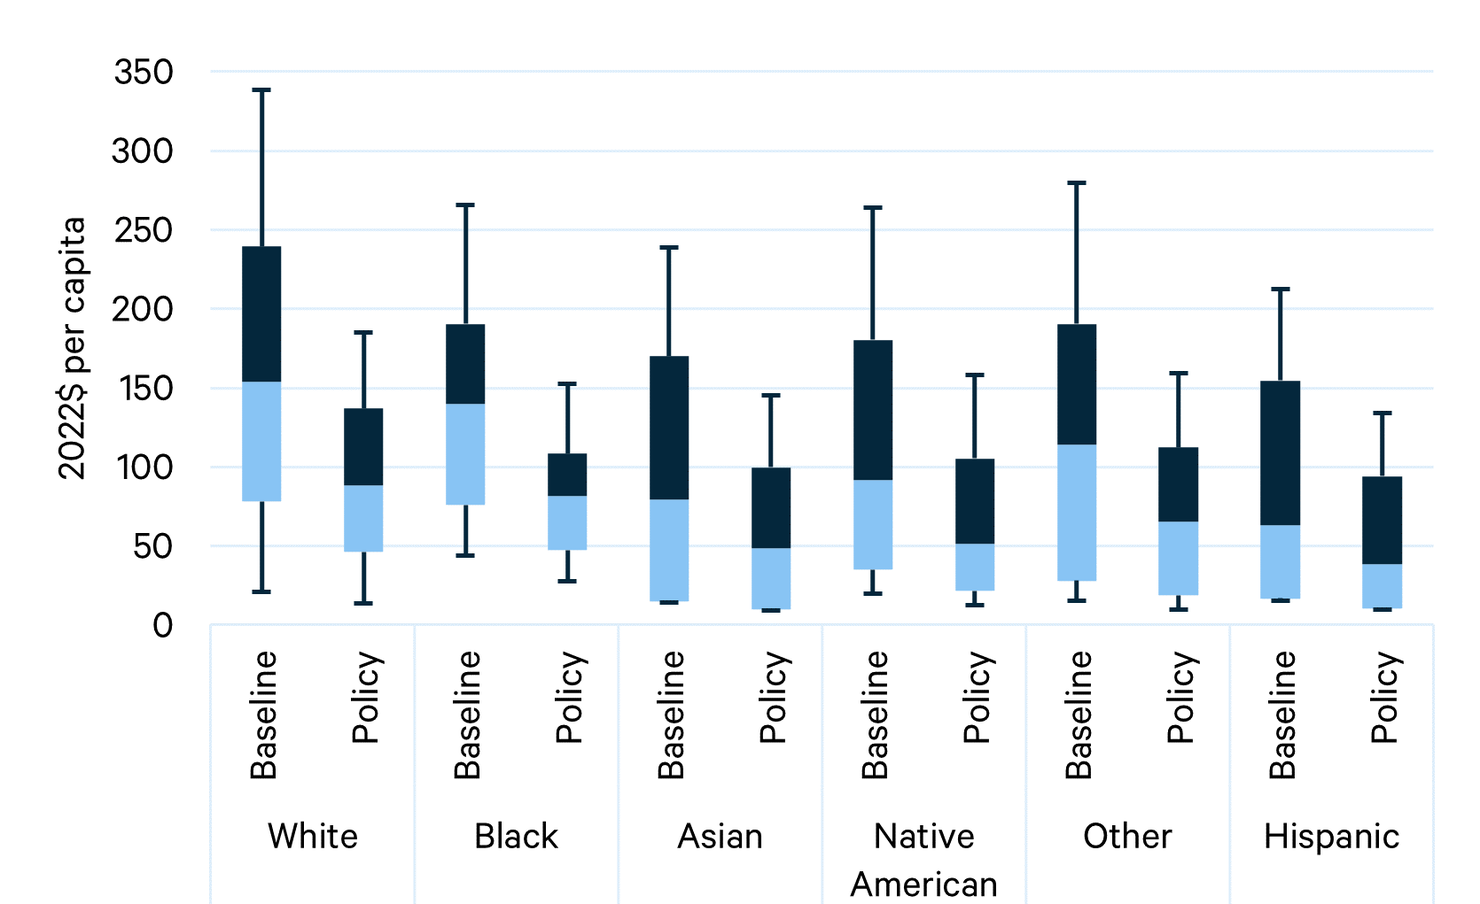
The distribution of health improvement shows great variation across racial and ethnic groups, which is influenced largely by their regional location of residence (Figure 9). White populations experience both larger health harms in the baseline and larger health benefits in the policy case, likely due to population concentrations in regions of the US that will see pollution reductions from reduced coal use. The middle (median) person in every racial and ethnic group realizes more than a 35 percent reduction in electricity sector-related PM2.5 mortality.
Figure 9. Electricity Sector Related Monetized PM2.5 Mortality in 2030 by Racial/Ethnic Group
The health impacts included in this section should be understood as a lower bound on likely health benefits. Fine particulate matter constitutes one of the greatest air quality-related threats to public health but is by no means the only one. SO2 is itself a noxious gas while NOX contributes to the formation of ground-level ozone, and both sulfur and nitrogen deposition contribute to acidification of the environment. Our analysis does not include the direct health benefits of reducing SO2 and NOx, nor does it include the health benefits of reducing ozone, PM10, or direct particulate emissions. In addition, the IRA is also likely to reduce pollution outside the electricity sector, and none of those health benefits are included here.
5.3. Summary of Costs and Benefits for the Average Household
Households are affected under the IRA by changes in electricity prices, changes in tax incidence, air quality benefits, and climate benefits. Figure 10 illustrates the overall outcome for the average US household. Climate-related benefits of reducing a ton of CO2—estimated at the recently updated value of $226 in 2030 in 2020 dollars (Rennert et al. 2022)—constitute the largest source of benefits. Government expenditures reflect the tax burden of the average household associated with PTC and ITC awards in the current year.
Figure 10. Average Household Benefits and Costs (2030)
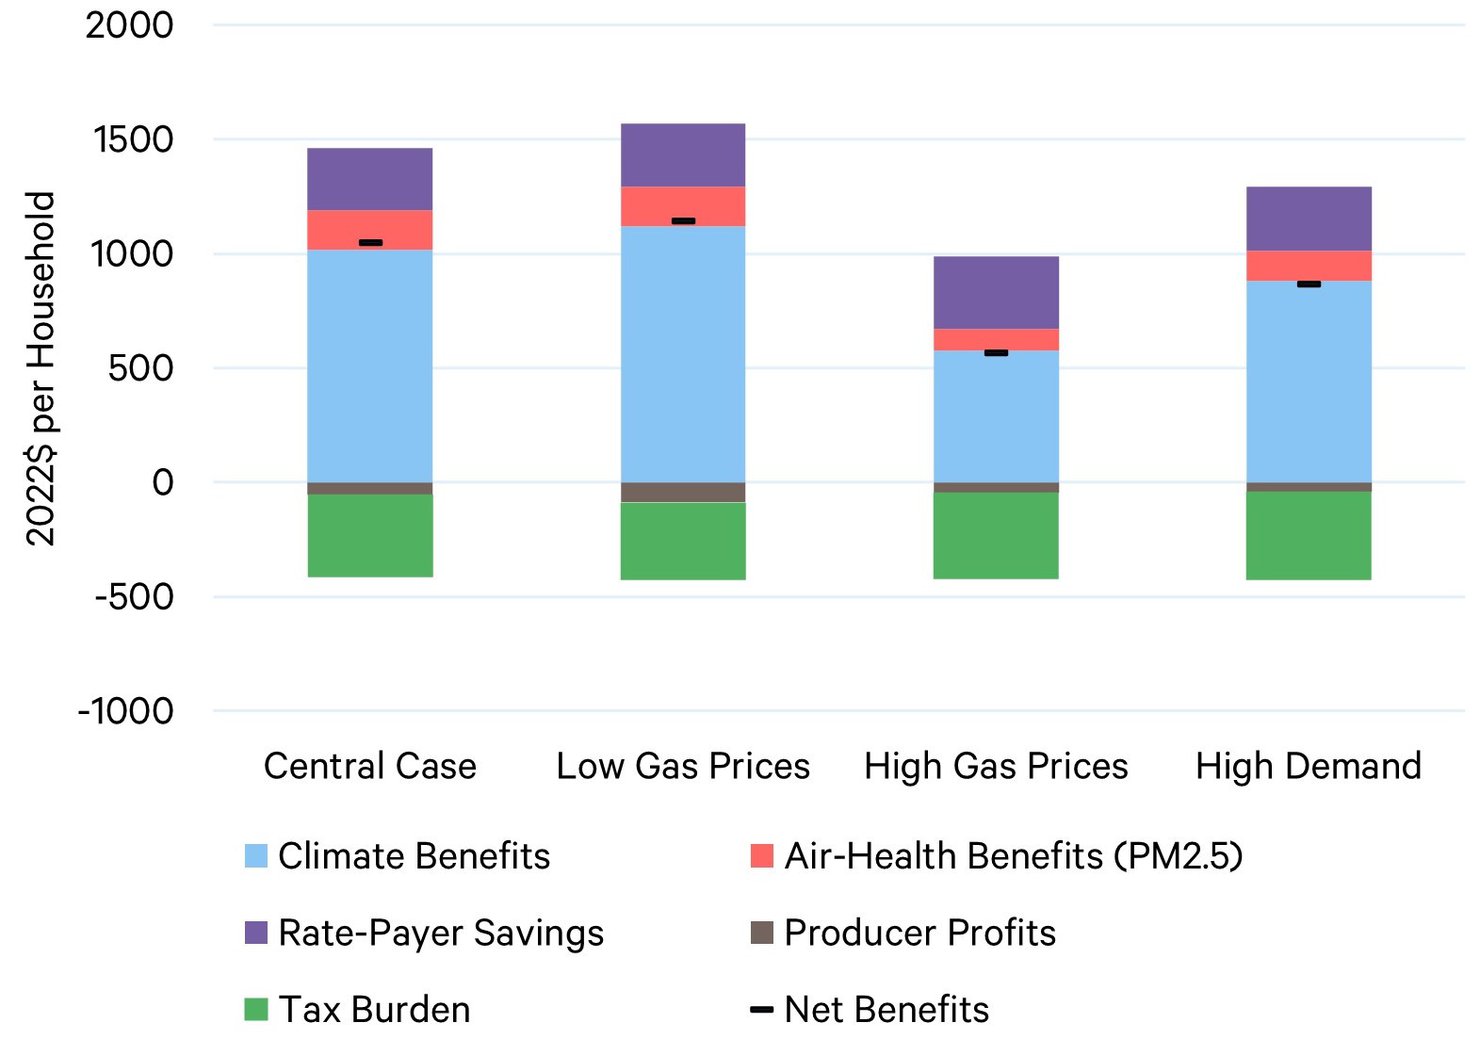
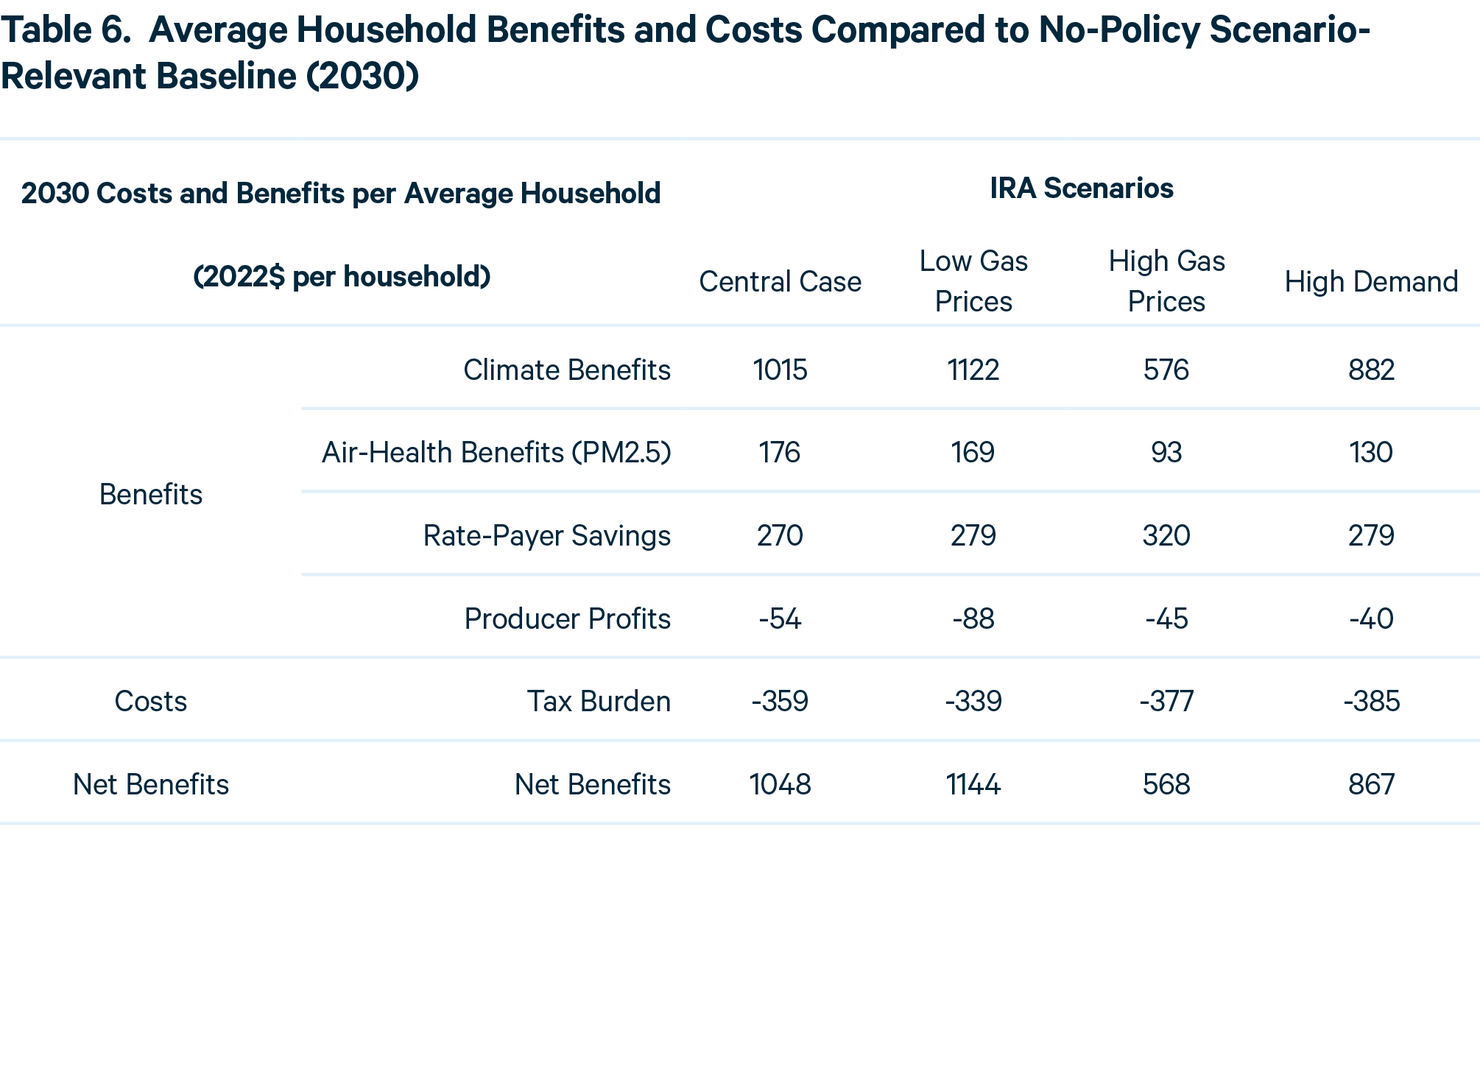
Numerical values for Figure 10 are reported in Table 6. As described above, the portion of government expenditure costs that fall on capital income is reduced by 10.8 percent, along with the change in producer profits, to account for the portion of US securities that are foreign-held. Net benefits range from $568 to $1,144 per household in the year 2030 and are greatest in the low gas price scenario.
6. Cost Effectiveness of the Policy
We evaluate cost effectiveness of the IRA in terms of the cumulative resource costs per ton of CO2 reduced compared to each relevant no-policy baseline. Resource costs include the change in annualized capital costs, fuel costs, and O&M costs. We evaluate this at two points in time, 2030 and 2035, across the four sensitivities with reductions and costs starting in 2023. The results are illustrated in Figure 11.
Figure 11. Average Cost per Ton of Cumulative CO2 Reductions 2022- 2030 and 2022-2035 Compared to Relevant Scenario No-Policy Baseline
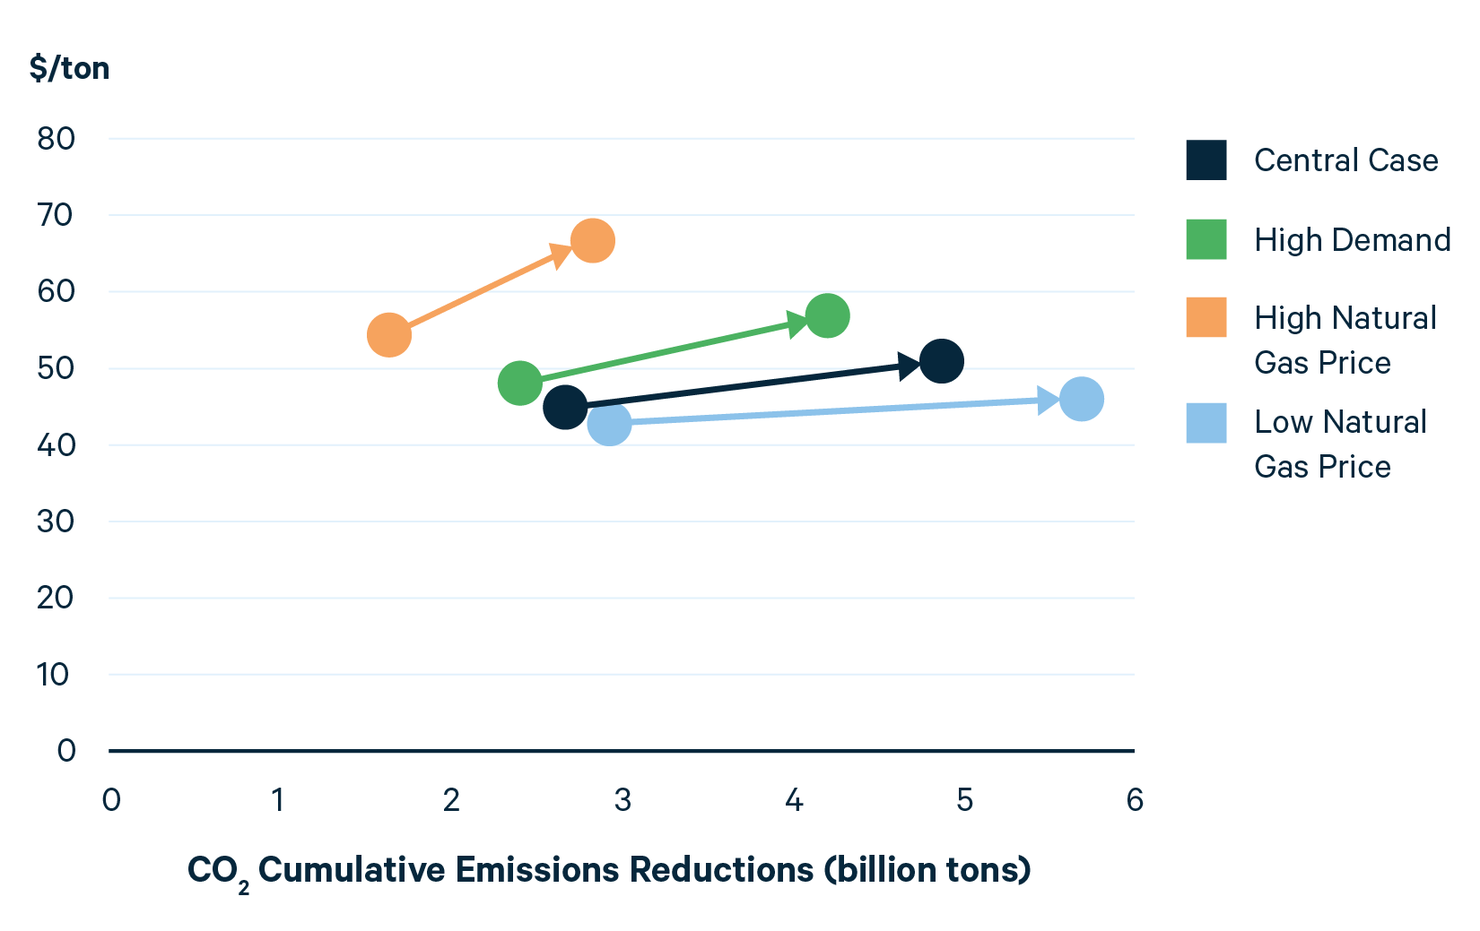
The vertical axis displays the average cost per ton of CO2 reduced; the horizontal axis displays cumulative emissions reductions. Across all sensitivities we can expect 1.5-3 billion metric tons of cumulative CO2 reductions by 2030. The cumulative average cost per ton reduced through 2030 ranges from just above $40 to $55 (2022$). Cumulative reductions roughly double by 2035, ranging from 3-6 billion, and the average cost ranges from $46 to $68. High natural gas prices lead to the least reductions at the highest cost, while low natural gas prices lead to the most reductions at the lowest cost. These results follow from the important influence of natural gas prices on coal utilization, with lower gas prices prompting a faster and greater shift away from coal.
Using the $226 per ton (2020$) estimate of the social cost of carbon in 2030 from Rennert et al. (2022) yields total annual climate-related benefits ranging from $73 billion to $143 billion in 2030, roughly four to five times the policy-induced change in resource costs (Table 7). The total benefits of the IRA in the central case scenario, including $22 billion in direct health benefits from associated reductions in the conventional air pollutants (SO2 and NOX), are $152 billion, yielding net benefits of $127 billion in 2030. The high electrification scenario leads to the lowest level of climate benefits from the IRA policy. This result is partially due to our lack of accounting for reductions in CO2 emissions from reduced fossil fuel use in electrified sectors. In both the high gas price and high demand scenarios, we see more coal than in other cases, which leads to fewer health and climate benefits.
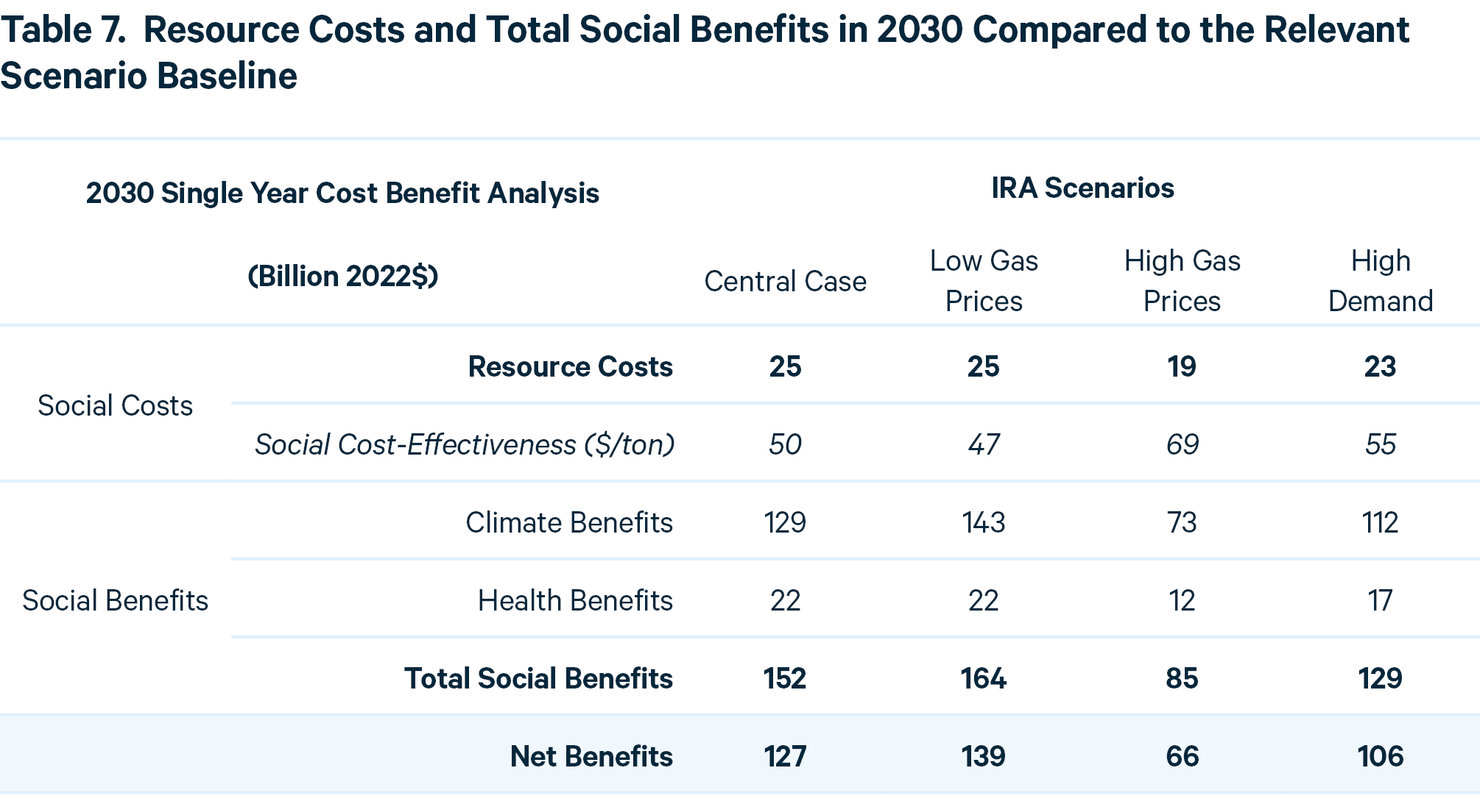
Alternative estimates of the social cost of carbon yield different levels of overall climate benefits, but the qualitative results remain the same. For example, the central case, with the federal government’s (IWG 2021) interim social cost of carbon for 2030, valued at $61 (2020 $), yields $33.2 billion in total net benefits, about a quarter of the value displayed in the above table. The $6 (2011$) domestic-only social cost of carbon employed under the Trump administration leads to positive net benefits in the central and low gas price cases.
7. Conclusion
Our findings suggest that the IRA will unlock a new reality for the electricity grid and households in America. Cheaper energy and cleaner air are coupled with strong incentives to decarbonize the grid and an economy ready to electrify. Existing coal capacity continues to play an important role in the US electricity sector under the IRA and remains the most carbon-intensive source of energy on the US grid, with associated air-quality related health impacts. Availability of natural gas supply is an important variable that determines the pace of emissions reductions and path of electricity prices. The IRA provides a stimulus for new investment in clean energy, but it provides no direct stimulus for expanding generation from lower-emitting gas compared to coal. However, in the low-cost renewable era that the IRA helps to initiate, there is an incentive to innovate on storage, clean firm capacity, and load shifting. These are some of the biggest unknowns that could accelerate the transition to clean electricity and electrification of the US economy.
There are also potential barriers from unknowns. Siting and interconnection are major hurdles for deploying the record levels of capacity that the modeling of the IRA predicts. The availability of critical materials for renewable technologies may be another major unknown.
With these caveats considered, the IRA can be expected to manifest major reductions in CO2 and associated health benefits and reduce retail prices. The benefits will be allocated in a progressive fashion due to the revenue-raising mechanisms of the IRA.
A. Appendix: Methods and Assumptions
We model the Inflation Reduction Act using RFF’s Haiku electricity market model, which solves for changes in capacity and operation of the electricity system for 48 states with constrained interstate transmission capability. The model includes costs and performance characteristics for renewable technologies and carbon capture and storage from the 2022 National Renewable Energy Laboratory’s Annual Technologies Baseline (NREL-ATB) “Reference” Scenario, and for other technologies from the Annual Energy Outlook (AEO) 2021. Fuel costs and electricity demand are calibrated to the AEO 2021, with natural gas prices adjusted as described below. The AEO 2022 has updated assumptions and expectations for baseline renewable buildout that are not represented in our baseline; consequently, our results may slightly underestimate the magnitude of clean energy to be achieved in the early years.
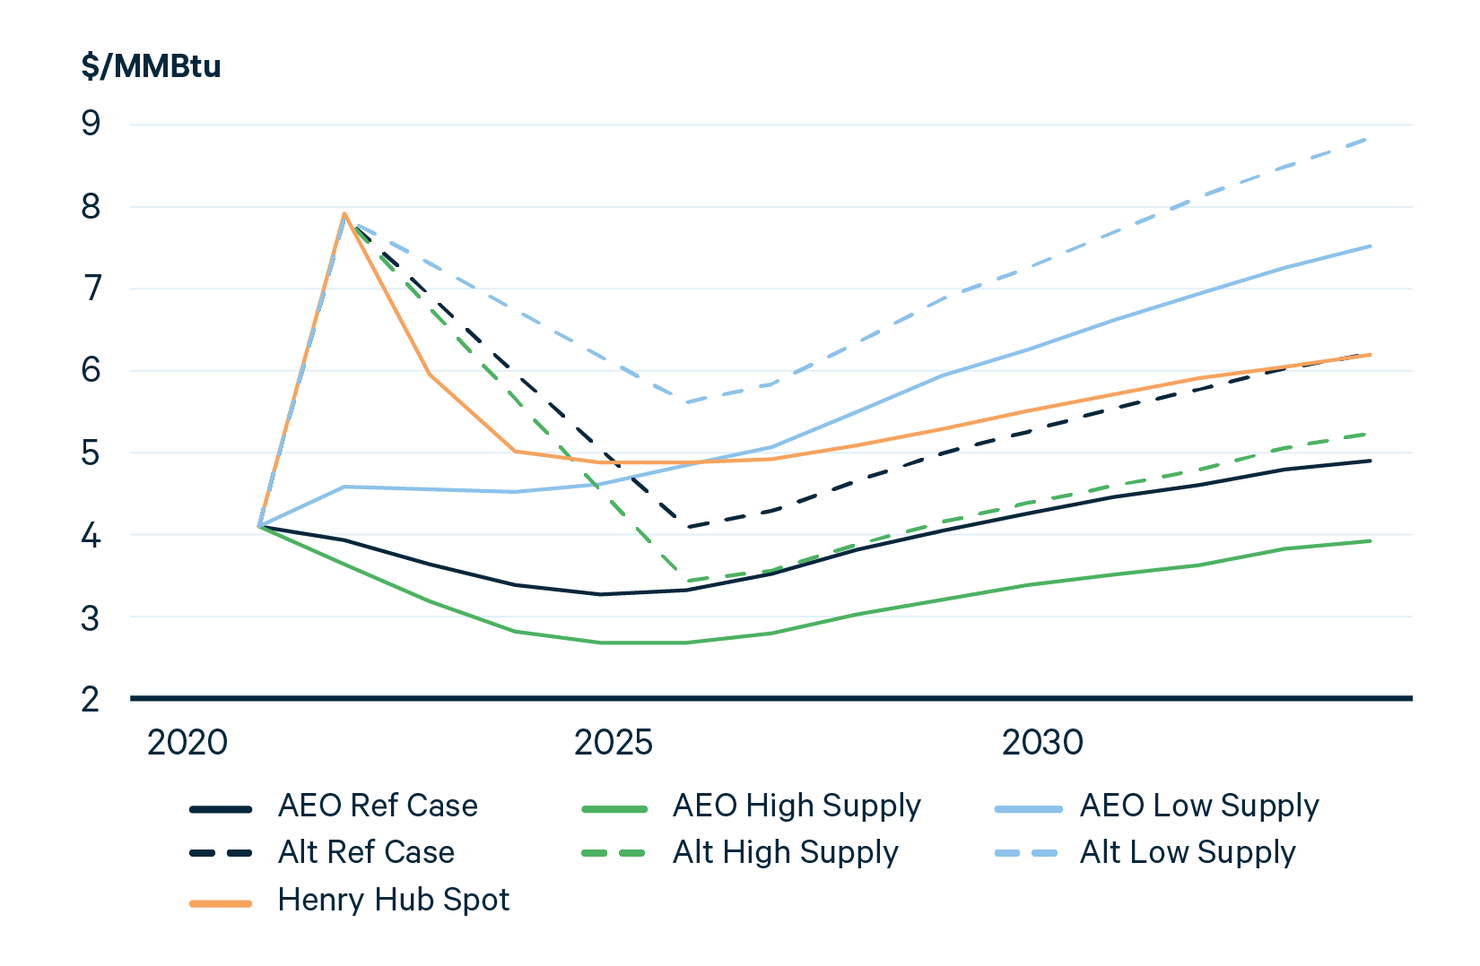
Natural gas prices are not responsive to changes in demand endogenously in our model, so we use sensitivity analysis to consider alternative natural gas supply and prices, drawn from the AEO. We have updated our no-policy baseline and fuel price sensitivities to account for current major changes in natural gas markets. We look to the natural gas futures market to observe that, after the current spike in fuel prices (approximately 2 times the forecast price), futures market prices from Henry Hub Natural Gas Futures Quotes – CME Group settle approximately 25 percent higher than the AEO 2021 reference case in the long term. To adjust our natural gas prices for these runs, we set the natural gas price in 2022 to twice the level of reference case (for all cases), then we have it decline linearly to adjusted long-term projections by 2026. Our new long-term reference case natural gas price is the average of the EIA’s AEO 2021 reference and low supply scenario. The new low and high prices scenarios are shifted up by the same amount that the reference case changes, as illustrated in Figure A1 in nominal terms and as described in table A1.
Figure A1. Nominal Natural Gas Price Projections Under Different Supply Assumptions
The high demand scenario takes estimates of electricity demand from NREL’s electrification futures study. We calculate the difference between NREL’s reference electrification scenario and their high electrification scenario. This difference is than added to state-level, downscaled estimates of AEO 2021’s reference case electricity demand profiles used in our model. We assume seasonal time-profiles of demand remain the same.
Among technologies eligible for tax credits, we represent endogenous economic investments in offshore wind, onshore wind, solar, and battery storage. The PTC for existing nuclear in the proposed legislation is not represented directly, and we do not represent associated government expenditures. Instead, generation is fixed to a baseline to represent the support for existing nuclear assets. Consequently, no retail price benefits from the nuclear PTC are accounted for here, although the presence of nuclear does provide consumer benefits in the wholesale markets. Investments in carbon capture and storage at new fossil-fueled facilities are also included.
The pace of deployment of new capital is often constrained by noneconomic factors. We impose a heuristic constraint on capacity growth that relies on historical capacity additions at the state level to represent regional differences in how major capacity is built. It involves two parameters, one to define the maximum observed growth in capacity in percent terms and the second to define it in GW terms. We then constrain each fuel to these maximums such that, by 2030, solar and wind combined can be built at an annual rate that is at least 3 times the rate that total increases in capacity have historically been observed. The capacity growth constraint is written:
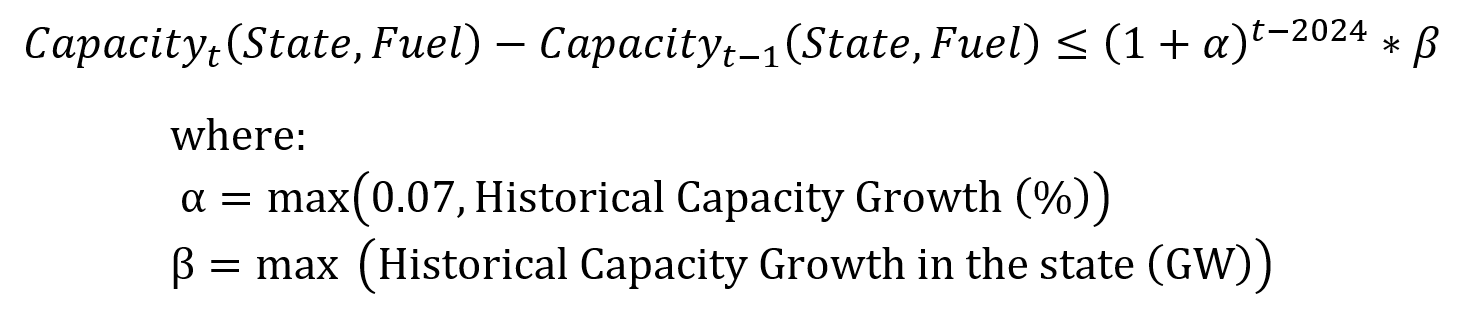
The Haiku electricity model has two types of buildable carbon capture and storage unit available after 2028: new coal CCS and new gas CCS. We constrain total new coal CCS capacity to be less than or equal to 5 GW, and total new gas CCS to be less than 20 GW. Capital costs for new coal and gas CCS come from NREL ATB 2022. Storage, utilization, and transportation costs for CO2 captured at CCS plants come from the documentation for EPA's Power Sector Modeling Platform v6 - Summer 2021 Reference Case. We scale total US storage and utilization capacity available to electricity generators with CCS to be no more than 100 million short tons in 2030, doubling every five years thereafter.
There are two bonuses applied to the PTC and ITC in the IRA. If domestic content standards are satisfied, projects earn a 10 percent bonus. We represent this by assuming that no generation qualifies for the bonus until 2026. Each year after 2026, an additional 20 percent of the potential bonus is applied to all projects earning tax credits, ramping up to 100 percent of the potential bonus earned by 2030. A second bonus is provided to projects located in energy communities as defined by the IRA. We apply a partial crediting system to all states based on other RFF analysis. The partial credit of the bonus is based on the percent of land area in each state that qualifies as an energy community in the IRA (excluding the unemployment requirement, as Haiku does not have endogenous employment).
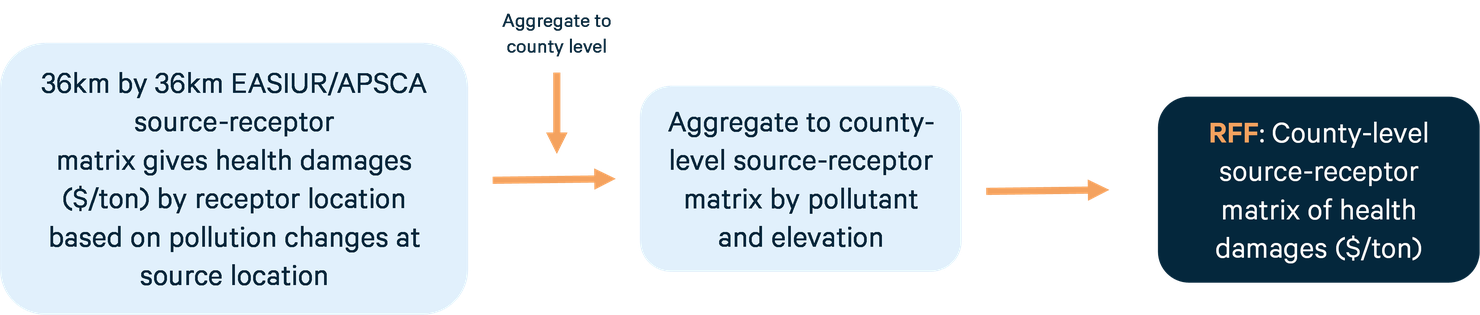
Air quality modeling is done using EASIUR, which was built using 2005 air quality modeling to estimate premature mortality associated with direct and secondary PM2.5 at the 36km-by-36 km grid scale. We downscale emissions by fuel to the county level, derive county-to-county source-receptor matrices from EASIUR, and apply them to 2030 emissions changes and population projections to estimate the changes in health outcomes and monetized benefits associated with reduction in PM2.5 at the national, state, county, and per capita levels (Figure A2). EASIUR uses Krewski et al. (2009) for the concentration-response coefficients and $8.6 million as the value of a statistical life (2010$). EPA’s Guidelines for Preparing Economic Analysis recommends that the value of statistical life grow with income using an income elasticity of 0.4, 0.8, or 1. We choose an income elasticity of 1 and use CBO’s 2022 Long-Term Budget Outlook projection of 1.5% annual GDP per capita growth rate between 2022 and 2030 to adjust the default value of statistical life in EASIUR to $17 million (2022$) for the year 2030.
Figure A2. Construction of Source-Receptor Matrix to Estimate the Benefit of Air Quality Changes
Key uncertainties not explored in the analysis include:
- The relationship between counties in a state for a given pollutant and fuel might not remain the same over time.
- Fuel-specific emissions source elevations may obscure outliers.
- Regression model analysis of stack height for the electricity sector brings additional uncertainty.
- The EASIUR source-receptor matrix is estimated based on a single year (2005) of data. As a reduced complexity model, it does not represent nonlinear chemical processes or meteorological variation, which is increasingly important over time with climate change.
- There is inherent uncertainty in the underlying concentration-response function (Krewski et al. 2009) and economic valuation of changes in health status that are used in the model.
- Future population estimation is a linear projection of county-level population and demographic characteristics in 2005.
- EASIUR does not account for organic PM that is created secondarily from certain VOCs, which is an important issue in places like southern California.
Authors


Seth Villanueva
University of California, Santa Barbara