Decarbonized Hydrogen in the US Power and Industrial Sectors: Identifying and Incentivizing Opportunities to Lower Emissions
Tax credits could make hydrogen energy more competitive in the US industrial and power sectors, but reductions in production and storage costs and expansion of transportation infrastructure are necessary to achieve zero-carbon hydrogen use.
Abstract
Hydrogen has attracted significant interest for its potential contributions to a low-GHG economy, because of its capacity for storing chemical energy without carbon. In this report, we consider two methods of decarbonized hydrogen production, so-called blue and green hydrogen, for use in power generation, industrial heating, and as an industrial feedstock in the United States. We find that there is a near-term opportunity in using blue hydrogen to reduce feedstock emissions in oil refining and ammonia manufacturing. For green hydrogen to be competitive, substantial reductions in production and storage costs are necessary. However, if those costs decline sufficiently, green hydrogen has broad potential: for long-term energy storage, industrial heat, and as a feedstock for refining, chemicals, and steel. We then assess policy options to support decarbonized hydrogen in the power and industrial sectors. A tax credit has the advantages of familiarity (e.g., the 45Q tax credit for CCUS and the PTC for wind) and not raising prices within the sectors. Although an efficient tax credit for decarbonized hydrogen would be more complex than 45Q, we find that it could properly account for the climate benefits from decarbonized hydrogen.
Key Findings
- Hydrogen produced from natural gas and using carbon capture technology is a viable near-term option for low-carbon hydrogen, which would reduce current emissions in oil refining and ammonia manufacturing.
- For significant penetration, the cost of zero-carbon hydrogen from renewable or nuclear power must decline drastically, and inexpensive storage and pipelines must be established beyond the Gulf Coast.
- If cost reductions and infrastructure expansion can be achieved, zero-carbon hydrogen offers the potential for long-term energy storage and as a decarbonized industrial fuel and feedstock.
- Assuming that a carbon price that includes the industrial sector is unrealistic in the near term, a tax credit for decarbonized hydrogen would be a feasible and effective policy option.
- A production-based tax credit, modeled on the 45Q expanded tax credit, would support decarbonized hydrogen to compensate producers or users for its climate benefit.
1. Introduction
Using decarbonized hydrogen is an avenue to a low-carbon economy that has attracted renewed interest. Assessments by the International Energy Agency (IEA), consulting firms, trade associations, and academic organizations (e.g., IEA 2019; IRENA 2019; Hydrogen Council 2020) have examined how technological developments and cost reductions could allow hydrogen to contribute significantly to a decarbonized economy. Building on those technical roadmaps, this report considers the role of public policy: should decarbonized hydrogen be promoted, and if so, what approach would be effective and feasible?
The motivations for supporting decarbonized hydrogen are based on the two functions of hydrogen—as a feedstock and as a fuel. A vast amount of hydrogen is already used as an industrial feedstock, mostly for ammonia manufacturing and petroleum refining. Since current hydrogen production results in substantial emissions of carbon dioxide (CO2), changing to low- or zero-carbon hydrogen production processes is a critical step in decarbonizing existing feedstock applications. The greater cost of low-carbon versus high-carbon processes is the primary barrier to such change. Additionally, decarbonized hydrogen could replace high-carbon feedstocks in novel processes, such as for steel production.
The use of hydrogen as a fuel is less developed than as a feedstock because fossil fuels are cheap to produce and handle. However, hydrogen offers considerable potential because it has the unusual property of generating no CO2 on combustion. For some applications, such as high-temperature industrial heat and long-term energy storage, that have limited options for reducing emissions, decarbonized hydrogen is a promising alternative. Challenges include the increased costs of fuel production and infrastructure, as well as the potential need to change power or industrial equipment for hydrogen use.
Of the policy options for promoting decarbonized hydrogen, the preferred instrument—a carbon tax—is not possible in the current legislative and regulatory environment, leaving tax credits and standards. The successful track record of a tax credit, numerous applications for decarbonized hydrogen, its uncertain cost trajectory, and concerns of carbon leakage and job losses all favor a tax credit over a standard.
In this report, we will first review the processes, and the respective costs, of hydrogen production—both the high-emitting methods that currently predominate as well as the decarbonized methods that a tax credit could support. Understanding the costs and emissions of hydrogen production processes allows us to assess whether a tax credit tied to climate benefits would make decarbonized hydrogen competitive with current production methods.
Next, we will consider three broad end uses for decarbonized hydrogen: for dispatchable low-carbon power, as a source of industrial heat, and as an industrial feedstock. Of particular interest are the emissions profiles of the fuel or feedstock that decarbonized hydrogen would replace and the cost-effectiveness of using decarbonized hydrogen. Our goal is to identify which applications for decarbonized hydrogen would be competitive with existing fuels or feedstocks if there were an efficiently priced tax credit.
Note that we are not examining the potential for decarbonized hydrogen either in the transportation sector—for passenger vehicles, buses, or trucks—or in the residential and commercial sectors for space heating. Although these areas may hold promise for emissions reductions with decarbonized hydrogen, they are outside the scope of our report. Nevertheless, a tax credit is sufficiently versatile to promote decarbonized hydrogen for these uses.
Having examined the costs and emissions—of decarbonized hydrogen and of the fuel or feedstock that it would replace—we will assess the design of an effective tax credit. The level of the tax credit is a key consideration. If the tax credit were set to equal the social cost of carbon (SCC), would this level be sufficient to make decarbonized hydrogen competitive in power and industrial applications? Several other features are also important to effective design: the structure of the tax credit (either production- or investment-based), the assignment of the credit to the producer or user of hydrogen, the duration of a production-based credit, deadlines and eligibility rules, monitoring and enforcement, and coordination with the 45Q tax credit for carbon capture, utilization, and storage (CCUS).
2. Hydrogen Supply
Because of extensive demand for industrial feedstocks, the global production of hydrogen is a big business, with dedicated annual production of 70 million tons and a market value of $115 billion in 2017 (Wood Mackenzie 2019; IEA 2017). Hydrogen production also has a significant energy footprint, consuming roughly 2 percent of primary energy demand (IEA 2019). In this section, we review the principal methods of hydrogen production, as well as their CO2 emissions intensities and costs. We then focus on the low-carbon methods—their development, component costs, and projections of future production costs. We describe the infrastructure requirements for the transportation and storage of hydrogen, whose costs must be included when hydrogen is compared with other fuel and feedstock options. We summarize by identifying when different methods and locations of hydrogen production are likely to become competitive, after accounting for carbon costs.
2.1. Methods of Hydrogen Production
Hydrogen can be produced through numerous methods, but current production is dominated by just two, steam reforming of methane and gasification of coal. Both of these production processes emit significant quantities of CO2, but they can be decarbonized if combined with CCUS. The leading alternative low-carbon production method is electrolysis using power from nuclear or renewable energy sources.
A couple of notes on hydrogen production. First, following the convention in popular media and most industry reports, we use colors to indicate particular pathways of hydrogen production (Figure 1). Second, the methods described are those used in the dedicated production of hydrogen. One-third of current hydrogen supply is from industrial processes that generate hydrogen as a by-product (IEA 2019). Because our interest is production that would scale according to the demand for hydrogen, we focus on dedicated production methods.
2.1.1. Gray Hydrogen from Natural Gas (without CCUS)
Natural gas accounts for roughly three-quarters of global hydrogen production, and reciprocally, hydrogen production consumes 6 percent of global natural gas supply (IEA 2019). The predominant method of hydrogen production from natural gas is steam methane reforming (SMR), in which methane is reacted with high-temperature steam to produce hydrogen and carbon monoxide. Natural gas has two functions in SMR—as the feedstock (natural gas is mostly methane) and for combustion to generate the necessary heat. Since SMR produces a mix of hydrogen and carbon monoxide (known as synthesis gas, or syngas), the subsequent water-gas shift and pressure swing adsorption reactions increase the hydrogen yield, consume carbon monoxide, and remove carbon dioxide and various impurities.
Figure 1. Hydrogen Production Processes
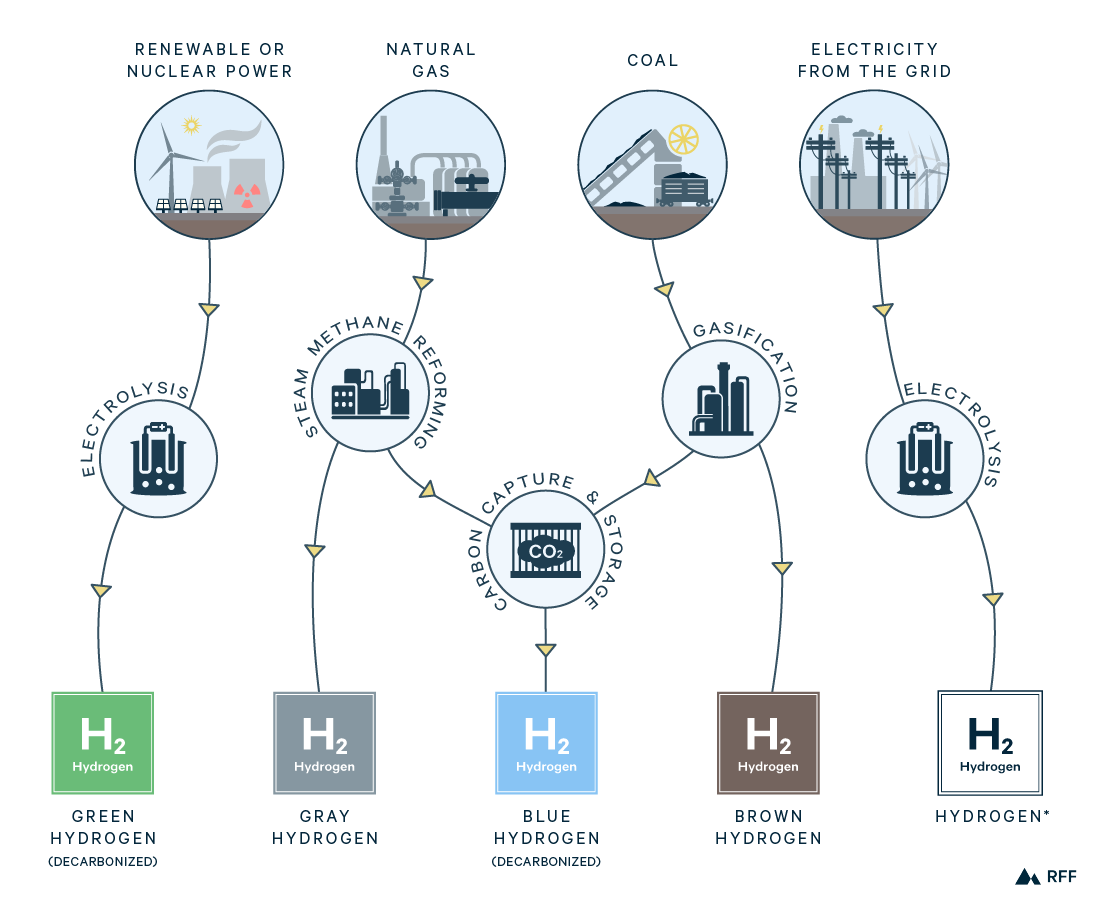
Although the term gray hydrogen is often used interchangeably with SMR, there are alternative reforming methods using natural gas to produce hydrogen. These include partial oxidation, in which oxygen replaces steam in the SMR reaction, and autothermal reforming (ATR), in which both oxygen and steam are used as reactants. In partial oxidation and ATR, heat is generated inside the reactor vessel by the reactions themselves, whereas with SMR, natural gas is combusted externally for heat. With a higher yield of hydrogen, SMR is generally the least-cost gray hydrogen production method. However, if CCUS is included in the process (as we discuss below), ATR could be more cost-effective.
2.1.2. Brown Hydrogen from Coal (without CCUS)
Coal accounts for almost one-quarter of global hydrogen production, which consumes about 2 percent of annual coal supply (IEA 2019). A large proportion of coal-based hydrogen production is in China, where natural gas prices are almost three times higher than in the United States (IGU 2019), making coal the preferred source. Hydrogen is generally produced through gasification, a similar reaction concept to ATR, with the hydrocarbon (coal, in this case) being reacted with oxygen and steam to produce hydrogen, carbon monoxide, and carbon dioxide. As in the natural gas methods, subsequent water-shift and pressure swing adsorption reactions increase hydrogen production and remove other gases. The primary difference between the gasification of coal and reforming of gas is that coal contains a greater ratio of carbon to hydrogen, along with other elements (e.g., sulfur and nitrogen). Therefore, the gasification of coal generates more carbon dioxide and various impurities.
2.1.3. Blue Hydrogen from Natural Gas or Coal (with CCUS)
CCUS can be applied to any of the natural gas– and coal-based hydrogen production processes discussed above. Conceptually, CO2 can be captured from the process stream, the combustion flue gases, or both. For SMR, about 55 percent of the total CO2 emissions are a byproduct of the reforming and water-shift reactions; the remaining 45 percent result from combustion for heating (Sandalow et al. 2019). The process stream has a higher concentration of CO2 than is present in the combustion flue gases, resulting in higher efficiency and lower cost of capture (Friedmann et al. 2019). For this reason, the first stage in SMR blue hydrogen development has been to capture the process emissions, which several plants around the world already do. To achieve a higher total capture rate, CO2 capture from combustion gases must be included. Consequently, ATR, in which all the CO2 emissions are contained within the process stream, may be more cost-effective than SMR if the goal is to attain a high percentage (90 percent and above) of CO2 capture.
CCUS applied to the gasification of coal also produces blue hydrogen, and in countries with high natural gas prices, like China, this may be the least-cost method for decarbonized hydrogen production. Assuming CO2 capture from both process and combustion emissions, CCUS applied to coal gasification can achieve a 90 percent total capture rate. Nonetheless, because of coal’s high carbon content, coal-based blue hydrogen emits nearly twice the CO2 of natural gas–based blue hydrogen even if capture rates are identical (IEA 2019).
2.1.4. Green Hydrogen from Zero-Carbon Power
Rather than using a hydrocarbon, such as natural gas or coal, as a feedstock, hydrogen can be produced by splitting water into its constituent elements, hydrogen and oxygen. The most common method of splitting water is electrolysis, in which an electric current breaks water down, transforming electricity into chemical energy. Less than 0.1 percent of dedicated hydrogen is currently produced through water electrolysis, but the electrolysis of sodium chloride to produce chlorine generates byproduct hydrogen, which accounts for two percent of total hydrogen supply (IEA 2019). All the various types of electrolyzers involve two electrodes (an anode and a cathode), an electricity source, and an electrolyte that together form a circuit. Electrolyzers cause water to be reduced at the cathode (adding electrons, generating hydrogen gas) and to be oxidized at the anode (removing electrons, generating oxygen gas).
There are three main classes of electrolysis for hydrogen production: alkaline electrolysis, proton exchange membrane (PEM) electrolysis, and solid oxide electrolysis cells (SOECs). The most mature technology is alkaline electrolysis, which uses an alkaline electrolyte like sodium hydroxide. Alkaline electrolyzers have long lifetimes (up to 90,000 hours) and comparatively low capital costs because of their use of inexpensive materials (IEA 2015). However, alkaline electrolyzers operate at relatively low pressure and current density, increasing hydrogen production costs (Schmidt et al. 2017). PEM electrolyzers, in which a polymer serves as the electrolyte, are a less mature but still commercial technology. PEM electrolyzers currently have higher capital costs and shorter lifetimes than alkaline cells, but further development of PEM technology may be able to reduce these relative disadvantages. Moreover, PEM electrolyzers can operate at high current density and very flexible capacity—of particular importance when the power is variable (IEA 2019). Lastly, SOECs are a promising, but not yet commercial technology using a ceramic (solid oxide) electrolyte. SOECs convert electricity to chemical energy at a higher efficiency than alkaline or PEM electrolyzers, but their high capital costs and short lifetimes mean that further research and development is needed for SOECs to be commercially viable. Additionally, SOECs operate with high-temperature steam rather than liquid water, so they would need a low-carbon heat source to minimize production emissions.
For alkaline and PEM electrolysis, CO2 emissions from hydrogen production depend almost entirely on the source of electricity. Electrolysis using power from the grid—given the present mix of US power sources—would not, on average, be a low-carbon method of producing hydrogen. For hydrogen to be green, the power mix must be low-carbon, namely renewable or nuclear energy. Although electricity produced from natural gas with CCUS or coal with CCUS would be low carbon, using such power for electrolysis would be an inefficient way to decarbonize hydrogen production. Applying CCUS directly to hydrogen production (i.e., blue hydrogen) would avoid the efficiency loss from an additional step of energy conversion. However, if electrolysis were powered by a single variable renewable energy source, particularly a source with low capacity utilization, like solar, the production cost of hydrogen could be prohibitive. We discuss the effects of power source on electrolysis emissions and costs in further detail in Sections 2.2 and 2.3.
2.1.5. Other Hydrogen Production Methods
Although the natural gas reforming, coal gasification, and electrolysis methods cover the present state of the industry, numerous other pathways to hydrogen generation exist. These methods range from lab scale to commercially mature, but they have not yet received the breadth of interest as have the methods above.
First, biomass can be used as a feedstock for hydrogen production. Solid biomass, including specialty crops (e.g., switchgrass) and residues from agricultural or forest products, can be gasified like coal. Alternatively, biomass can be converted to liquid biofuel (e.g., ethanol) and then reformed like natural gas (DOE 2020a). Accounting for plant regrowth, biomass-based methods have low net CO2 emissions. If CCUS were applied to biomass gasification, CO2 emissions could be negative (Royal Society 2018). However, biomass is limited by the available resource, so it would be unable to scale to the extent of blue or green hydrogen. For example, converting current US hydrogen production to biomass-based hydrogen would require one-sixth of the technical potential of US biomass, compared with 1 percent of wind or 0.1 percent of solar for electrolysis (Ruth et al. 2017). Technical potential is defined as the resource potential constrained by geographic and system limitations but not economic or regulatory barriers (see Ruth et al. 2017).
Second, one natural gas–based route to hydrogen production emits little CO2 without capture. Methane splitting (or methane cracking) is a high-temperature method of separating hydrogen from carbon, generating hydrogen gas and carbon black, a solid form of carbon used as an industrial material. Methane splitting thus generates two valuable products and reduces the CO2 footprint of both (Gusev 2019). To produce both carbon black and hydrogen, the firm Monolith Materials has a pilot plant in California and is constructing a commercial plant in Nebraska, expected to be complete in 2020 (Monolith Materials 2020).
Third, solar energy can power the splitting of water in processes other than electrolysis. Solar thermochemical hydrogen production uses the heat from concentrated solar power to drive a cycle of reactions that generate hydrogen from water. Photoelectrochemical water splitting uses light energy (photons) to separate hydrogen from oxygen using a method similar to that of photovoltaic solar power. The US Department of Energy characterizes both methods as long-term production pathways, which it includes in a portfolio of hydrogen production, transportation, storage, and utilization technologies funded under the H2@Scale program (DOE 2020b).
2.2. Emissions from Hydrogen Production
With almost all current production from either natural gas reforming or coal gasification and without CCUS, the generation of hydrogen is a substantial source of global CO2 emissions. In 2017, emissions from the dedicated production of hydrogen totaled 830 million tons, more than 2 percent of global fossil CO2 emissions and greater than the emissions from Germany (Wood Mackenzie 2019). Figure 2 shows the carbon intensities of production for brown, gray, blue, and green hydrogen. Emissions range from 19 kgCO2/kgH2 for brown hydrogen to essentially zero for green hydrogen. As discussed above, gray hydrogen has roughly half the emissions intensity of brown hydrogen, which in turn causes blue hydrogen from natural gas to have about half the emissions of blue hydrogen from coal (at equivalent capture rates). Blue hydrogen is further split between capturing only the process CO2 (50 to 60 percent capture) and capturing both process and combustion CO2 (about 90 percent capture).
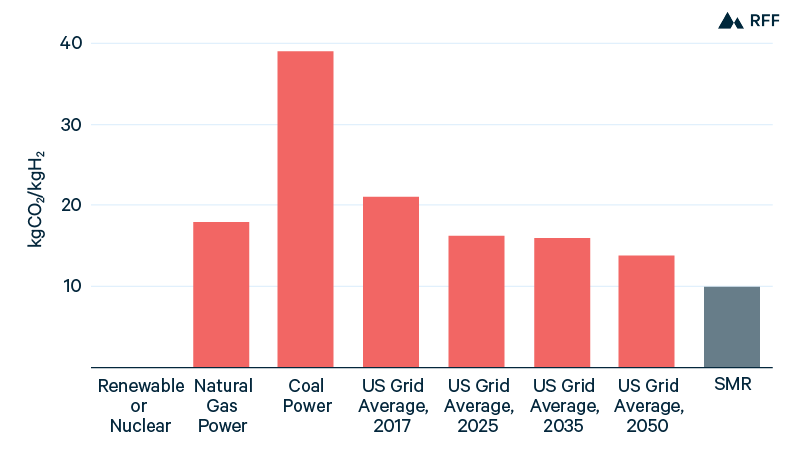
Although green hydrogen has almost zero emissions, electrolysis using other power sources has a large carbon footprint, as shown in Figure 3. In 2017, the US electricity grid had an average carbon intensity between that of natural gas– and coal-fired power. If average grid power had been used for electrolysis, the CO2 emissions intensity would be more than twice that of SMR because of the inefficiency in the additional step of energy conversion. With the retirement of coal-fired power plants and the increase in wind and solar power, the carbon intensity of the US power sector is decreasing. Still, without additional policies, the progress of grid decarbonization will likely decelerate within the next decade, thereby delaying the climate benefit of electrolytic hydrogen. For example, in the reference case of the 2020 Annual Energy Outlook, using average grid power in 2050 for electrolysis would emit 40 percent more CO2 per kgH2 than SMR.
Figure 2. CO2 Emissions, by Hydrogen Production Method
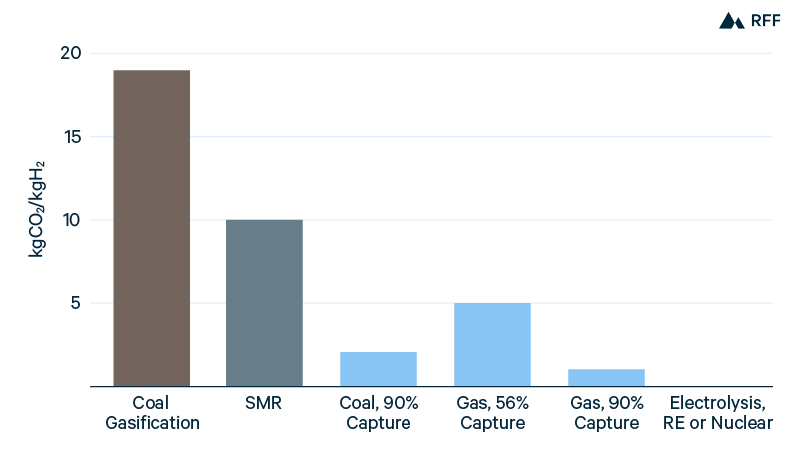
Figure 3. CO2 Emissions from Electrolysis, by Power Source
Note that none of the estimates of CO2 emissions are based on the life cycle. Most important are methane emissions, caused by leakage or purposeful venting, from all prior stages of the natural gas value chain—drilling, production, processing, transportation, and distribution. Because methane is a greenhouse gas with a global warming potential (GWP) many times that of CO2 (28 to 36 over 100 years; EPA 2020), this exclusion understates the emissions for hydrogen produced from natural gas, whether by methane reforming or electrolysis using natural gas power. For example, the Committee on Climate Change (2018) estimates upstream methane emissions for blue hydrogen from natural gas in the UK of 1 kgCO2-eq/kgH2 to 5 kgCO2-eq/kgH2, which would substantially raise the emissions profile of natural gas–based blue hydrogen. Notably, including upstream methane emissions would disadvantage blue hydrogen relative to green hydrogen, but the relative effect against gray hydrogen would be quite small (because of the minor increase in natural gas consumption for a plant with carbon capture). Moreover, as we discuss in Section 3, many of the potential applications for decarbonized hydrogen currently use natural gas, which would entail similar upstream methane emissions.
Although upstream methane emissions are significant, they vary considerably by location, and a hydrogen producer may have little control over them. Consequently, a tax credit for decarbonized hydrogen would not be well suited to account for methane emissions and promote their reduction. Instead, methane-focused policies (if not comprehensive carbon policies) would be the appropriate mechanisms.
As a final note on emissions, although the combustion of hydrogen does not produce CO2, hydrogen itself is an indirect greenhouse gas with an estimated GWP of 5 (Derwent et al. 2020). Further research is needed to better characterize the climate effects of hydrogen, but if hydrogen infrastructure becomes widespread, preventing leaks may become significant for mitigating the social cost of fugitive hydrogen emissions.
2.3. Costs of Hydrogen Production
2.3.1. Current Hydrogen Production Costs
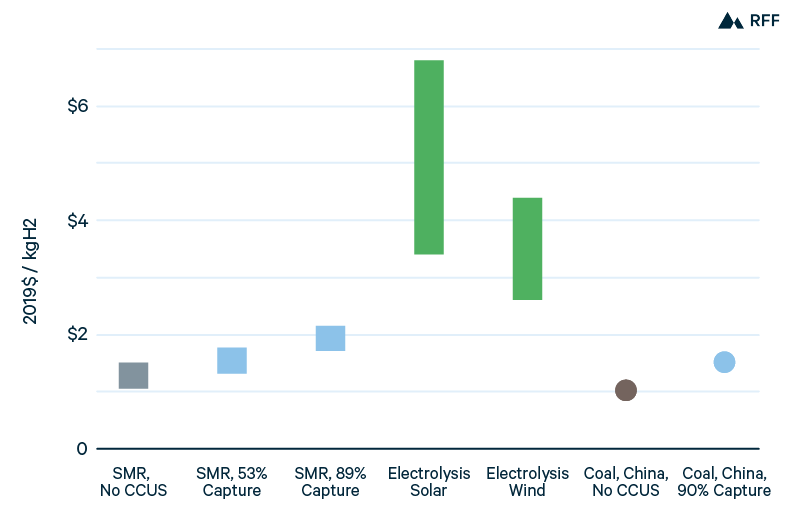
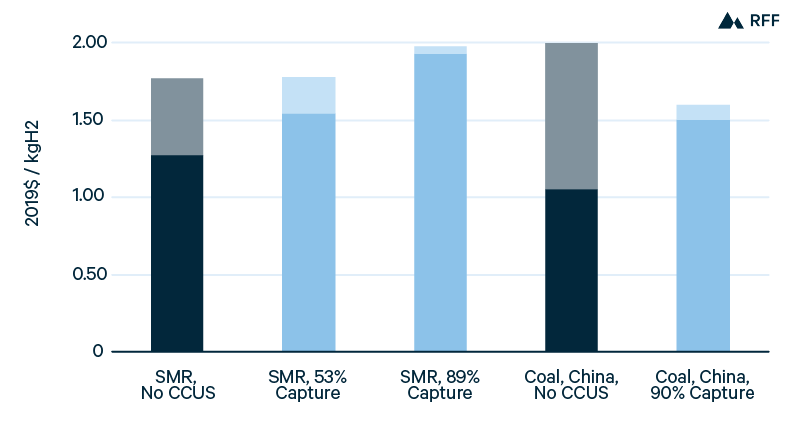
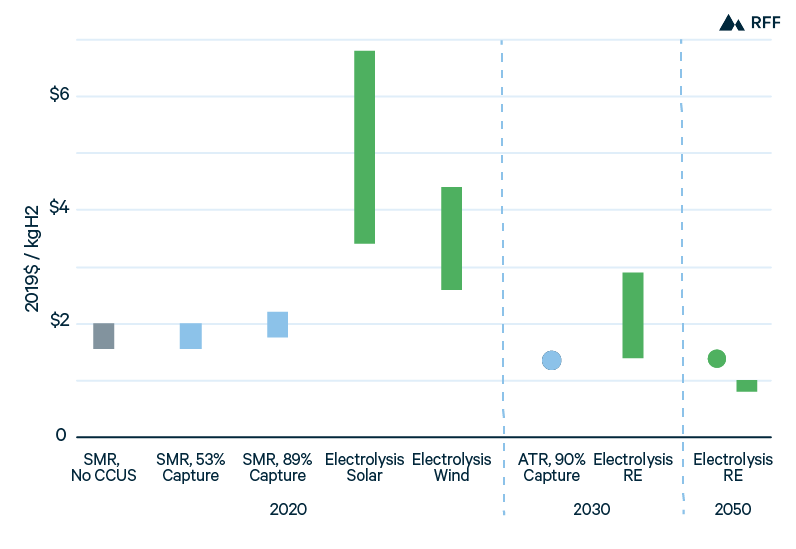
Figure 4 presents ranges for current costs of hydrogen production in the United States, along with point estimates for costs in China. Because of low US natural gas prices, SMR is the least expensive US production method, with the low end of costs approaching $1.00/kgH2. Applying CCUS to the process stream of SMR, capturing just over half of total emissions, adds between $0.25/kgH2 and $0.30/kgH2 to hydrogen production costs. Applying CCUS to combustion gases captures 35 to 40 percent of emissions from SMR but at a higher marginal cost of CO2 capture: production costs increase by $0.35/kgH2 to $0.40/kgH2 (Sandalow et al. 2019). In China, the higher cost of natural gas favors coal gasification, which has production costs similar to the low end of SMR in the United States, $1.05/kgH2. Capturing 90 percent of the emissions from coal gasification in China would increase hydrogen production costs by about 50 percent (IEA 2019). Compared with the broad range of emissions intensities for gas- and coal-based hydrogen (Figure 2), the range of brown, gray, and blue hydrogen costs is narrow (Figure 4).
Although blue hydrogen—even with 90 percent capture—entails significant emissions of CO2, current production costs of blue hydrogen are inexpensive relative to green hydrogen methods. As we further discuss later in this section, the capital and electricity costs must decline and the utilization (or capacity factor) must increase if the production costs of green hydrogen are to approach those of blue hydrogen.
Figure 4. Current Hydrogen Production Costs, by Method
In Figure 5, an illustrative carbon price of $50/tCO2 shows the near-term viability of blue hydrogen. With this carbon price, capturing emissions from the process stream would result in a production cost equal to that from SMR without CCUS. In other words, a tax credit of $50/tCO2 would make blue hydrogen (with 50 to 60 percent CO2 capture) competitive with gray hydrogen. However, applying CCUS to the combustion gases as well—to capture roughly 90 percent of total CO2 emissions—would remain more expensive because of the lower efficiency of this method. Whereas the marginal abatement cost of capturing process emissions is about $50/tCO2, the marginal cost of capturing combustion emissions exceeds $100/tCO2. For brown hydrogen in China, given its high emissions intensity, capturing 90 percent of CO2 emissions would reduce production costs by 20 percent. Although the price of $50/tCO2 is illustrative, it is consistent with the global SCC and the value of the 45Q tax credit for CCUS, both of which we discuss in Section 4.
Figure 5. Current H2 Production Costs, with $50/tCO2 Price
2.3.2. Cost Components and Opportunities for Reduction
2.3.2.1. Blue Hydrogen
For blue hydrogen, the incremental costs of adding CCUS to natural gas reforming fall into three categories: capital expenditures, operating expenses, and fuel costs. We focus on blue hydrogen from natural gas rather than coal, given the predominance of gas-based hydrogen in the United States and the lower CO2 potential for hydrogen from natural gas. For SMR, CCUS equipment for the separation of CO2 from the process stream—and, for even lower emissions, the combustion gases as well—would need to be added to the production plant. Operating expenses increase primarily because of the transportation and storage of CO2 from the plant. Lastly, carbon capture requires energy itself (often referred to as a parasitic load on the plant), increasing the amount of natural gas needed to produce a given amount of hydrogen. Of these three components, the incremental capital expenditures and operating expenses account for a large majority of the increased production costs for blue hydrogen (IEA 2019).
The production cost of blue hydrogen can be reduced in several ways. Novel technological pathways for blue hydrogen production are possible. See, for example, https://www.greentechmedia.com/articles/read/utility-global-comes-out-with-big-claims-for-hydrogen. First, technological improvements and cost reductions in carbon capture equipment would reduce the incremental capital expenditures for blue hydrogen and, to a lesser extent, the operating and fuel expenses through less material use and greater fuel efficiency. Second, increased scale of CCUS—at a regional level—would lower the costs of CO2 transportation and storage, the largest incremental operating expenses. These technological and scale effects show the benefit to blue hydrogen from the broader development of CCUS. Third, for blue hydrogen with 90 percent capture, a transition from SMR to ATR could reduce the cost of CO2 capture by one-half to two-thirds (Hydrogen Council 2020), causing overall production costs to fall. Finally, lower natural gas prices would decrease blue hydrogen costs: a decline of $1.00/MMBtu in the price of natural gas (currently selling for less than $3.00/MMBtu; EIA 2020b) would reduce the cost of blue hydrogen by $0.15/kg to $0.20/kg (IEA 2019). At the same time, lower natural gas prices would reduce the costs of gray hydrogen and also make hydrogen less competitive in applications where natural gas is an alternative fuel or feedstock. Of course, higher natural gas prices would work in the opposite direction.
2.3.2.2. Green Hydrogen
For green hydrogen to be competitive, significant improvements in its three major cost components—the capital expenditure, the electricity cost, and the electrolyzer utilization—are needed. Capital expenditures for green hydrogen include the electrolyzer stack (an assembly of cells) and the balance of the electrolysis plant, including power electronics and plant infrastructure. The cost of electrolyzer stacks would decline with increasing scale of electrolyzer manufacturing, using more automated and streamlined processes (Hydrogen Council 2020), and the development of less expensive cell materials. The balance of plant cost would decline with greater numbers of electrolyzer stacks in a plant, spreading fixed plant costs over a larger electrolysis capacity.
The cost of electricity is established in one of two ways, depending on the configuration of the green hydrogen plant. For a plant with a dedicated power source, such as a particular solar or wind project, the power cost is the levelized cost of electricity (LCOE) from that project. LCOE is the ratio of the present value of total costs to the present value of electricity generation, and thus it accounts for a project’s capital and operating costs and its utilization. Solar and onshore wind costs have declined dramatically over the past decade to about $40/MWh in average locations and $30/MWh in optimal locations (Lazard 2019). Future cost reductions for solar and wind power are expected to be more modest, with estimated 2040 costs (in 2019$) of $25/MWh to $30/MWh for solar and $26/MWh to $36/MWh for onshore wind (EIA 2020c). Cost ranges reflect optimal locations at the low end and average locations at the high end, since it is less likely that solar or wind would be installed in resource-poor locations. Nevertheless, costs reductions may be greater than those projected by EIA, with 2040 costs (in 2019$) as low as $11/MWh for solar and $16/MWh for onshore wind (NREL 2019). Costs reflect low technology costs and optimal locations from the National Renewable Energy Laboratory’s 2019 Annual Technology Baseline. Alternatively, the green hydrogen plant may be connected to the grid, so long as the power it uses is renewable or nuclear, as verified with renewable energy certificates (RECs), for example. In this case, the electricity cost would be the power price, either in the wholesale market or to an industrial consumer, plus the market premium for zero-carbon power. Average power prices for wind and solar energy (not including their renewable premium, as measured by REC prices) ranged from $16/MWh to $36/MWh for wind and from $28/MWh to $42/MWh for solar across US wholesale markets in 2018 (Wiser and Bolinger 2019; Bolinger et al. 2019). Besides REC values, wholesale power prices further exclude the value from federal tax credits and deductions and the value of providing capacity to the grid. Wholesale power prices at a particular location vary hourly and seasonally, so the grid-connected alternative allows for potentially higher utilization (as we discuss below) and lower power prices for green hydrogen. In particular, increasing renewable energy on the grid will likely lead to periods with excess power supply and a price of zero. Consequently, there is an aspiration that green hydrogen plants will be able to take advantage of this zero-priced power to achieve substantially lower production costs. However, other power consumers will also seek to make use of the power surplus, so large quantities of zero-priced electricity cannot be expected to persist. The uncertainty in the quantity of low-cost power is a significant risk for a grid-connected plant. Whereas green hydrogen with a dedicated power supply has a fixed cost of power, a grid-connected system faces uncertain power costs over the life of plant.
Electrolyzer utilization (also referred to as capacity factor or load factor), the third major cost component of green hydrogen, is affected by capital expenditures and power prices. For green hydrogen with a dedicated power source, electricity costs are fixed and the green hydrogen plant operates as much as possible. Still, the solar or wind plant itself generates electricity only a fraction of the time, and the utilization of the electrolyzer may not exceed the capacity factor of the power plant. New US solar and onshore wind plants in good locations have capacity factors of about 30 percent and 40 percent (EIA 2020c), respectively. Capacity factors for wind and solar vary significantly, because of both geographic location and project design choices (e.g., rotor lengths for wind, tracking and inverter size ratios for solar). Over the past 10 years, US capacity factors have ranged approximately between 30 and 50 percent for wind projects and between 18 and 32 percent for solar projects (Wiser et al. 2020; Bolinger et al. 2019). To achieve a higher utilization, green hydrogen plants could use nuclear or offshore wind, but both of these technologies have considerably higher generation costs along with higher capacity factors. Other options to increase electrolyzer utilization are to pair solar or wind plants with battery storage or to combine solar and wind with each other in locations where their generation is complementary (IRENA 2019).
For grid-connected green hydrogen, the trade-off between utilization and power prices occurs continually over the life of the plant. Rather than operating whenever power is available, as with a dedicated power source, the grid-connected plant would minimize its hydrogen production costs by choosing to produce when power prices are low but producing sufficiently often to amortize its fixed capital cost. At very low utilization rates (e.g., less than 20 percent), an increase in utilization has a large effect on reducing production costs, but at higher utilization rates (e.g., greater than 40 percent), the marginal benefit of increased utilization is far smaller (IEA 2019). The marginal cost of increased utilization is from higher power prices as the plant chooses to produce during periods of more expensive electricity, and its magnitude depends on the variability in power prices. Since utilization affects production costs through the amortization of fixed costs, reduced capital expenditures on electrolyzer stacks and the balance of plant would lessen the significance of utilization. Therefore, with decreased capital costs, green hydrogen plants could minimize production costs at lower rates of utilization.
Although capital expenditures, power cost, and electrolyzer utilization are the most significant drivers of hydrogen production costs, three other factors could provide incremental reductions in the cost of green hydrogen. First, electrolyzer stacks have an operating lifetime, which is currently longest for alkaline electrolyzers and shortest for SOECs. Longer stack lifetimes for each technology are possible, particularly for the less mature SOEC and PEM electrolyzers (IEA 2019); that would spread the capital cost over more hydrogen production. Second, the efficiency at which electrolyzers convert electrical energy to hydrogen may be improved for any of the electrolyzer technologies. Increased electrical efficiency would reduce effective power costs and raise the efficiency of capital investment. Third, operating and maintenance costs would be reduced with declining costs of parts and improved system operations (Hydrogen Council 2020).
2.3.3. Development of Blue and Green Hydrogen
Figure 6 shows global installations of blue hydrogen, including operational projects and projects currently under development. The first blue hydrogen project came online in 2005 in the Netherlands, with the hydrogen produced at a Shell refinery and the captured CO2 sold to greenhouses in the region. Since 2013, blue hydrogen projects have come online at greater frequency, including at US ammonia and refinery operations, with the CO2 used in enhanced oil recovery (EOR). From project announcements, new blue hydrogen capacity will likely continue steadily over the next several years. Still, only one or two projects are planned to start blue hydrogen production in a given year, so added capacity is a function of the sizes of a small number of projects.
Figure 6. Blue Hydrogen Installations, Operational and Planned
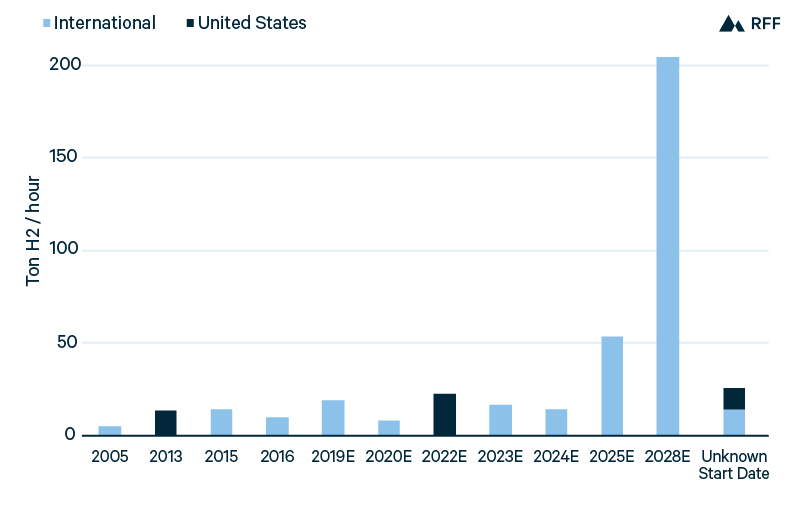
The significance of project size is highlighted by the large increase in blue hydrogen capacity planned for 2028, from a single massive project. H21 North of England proposes nine production units that collectively could produce 1.8 million tons of hydrogen—equal to approximately 2.5 percent of the current global hydrogen supply—if operated at full capacity throughout the year. The H21 project illustrates two factors discussed above on how blue hydrogen costs can be reduced. First, with a very high CO2 capture rate of 94 percent, the H21 project has chosen ATR over SMR technology to lessen the costs of capture (H21 2018). Second, along with the large scale of H21 itself, widespread CCUS is planned in the region (particularly along the Humber estuary), decreasing CO2 transportation and storage costs and thus the operating costs of blue hydrogen. A cluster of CCUS facilities is also planned in Rotterdam (Parnell 2019). Such a coordinated strategy could allow for lower costs of blue hydrogen in Louisiana and Texas, for example.
Figure 7 presents the capacity of new green hydrogen projects installed since 2000 as well as those planned for the next several years. Through 2018, the cumulative capacity was less than 2 tons of hydrogen per hour, but planned projects would increase global capacity more than 30-fold. As with blue hydrogen, total planned green hydrogen capacity mostly results from a few large projects. However, given the smaller size of green hydrogen projects, total green hydrogen capacity (both operational and planned) is about one-sixth that of blue hydrogen.
Figure 7. Green Hydrogen Installations, Operational and Planned
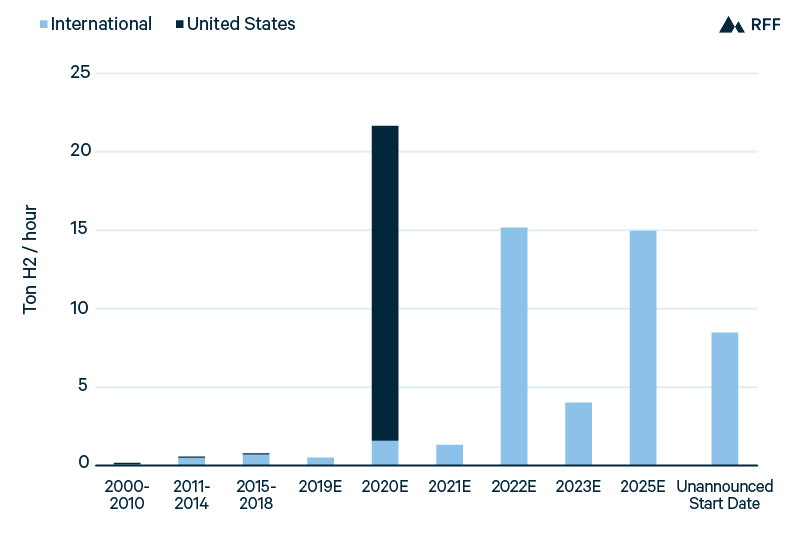
International development, particularly in Europe, accounts for a majority of planned green hydrogen capacity, but the largest announced project is in the United States. The Nel-Nikola project is a partnership between Nel (a Norwegian hydrogen company) and Nikola (a US designer of zero-emissions trucks) to provide 1 GW of electrolysis capacity to 30 hydrogen fueling stations across the United States (Nel 2018). As of June 2020, Nikola had ordered 85MW of electrolyzers from Nel. Whether the full 1GW project will be realized, and at what timescale, is uncertain—as is the case for all planned capacity additions. The project would decrease green hydrogen capital costs through an average electrolyzer capacity of more than 30 MW—larger than any electrolyzer installed to date and allowing for reduced balance-of-plant costs—and through the increased scale of Nel’s electrolyzer manufacturing.
Beyond the operational and planned projects shown in Figures 7 and 8, proposals for substantially larger green hydrogen projects include the Asian Renewable Energy Hub in Western Australia, which would devote up to 23 GW of onshore wind and solar for green hydrogen production, and the European Hydrogen Valley cluster, which would involve up to 10 GW of offshore wind in the North Sea to power electrolyzers in the Netherlands (Asian Renewable Energy Hub 2020; Parnell 2020). Both projects have dedicated power sources with the potential for low electricity prices and high capacity factors to reduce the production costs of green hydrogen. Alternatively, Mitsubishi’s Advanced Clean Energy Storage project in Utah is pursuing a grid-connected path to large-scale green hydrogen production. With increasing renewables penetration in the western United States, the project aims to procure large amounts of wind and solar energy at low prices, allowing for high electrolyzer utilization and low power costs (MHPS 2019).
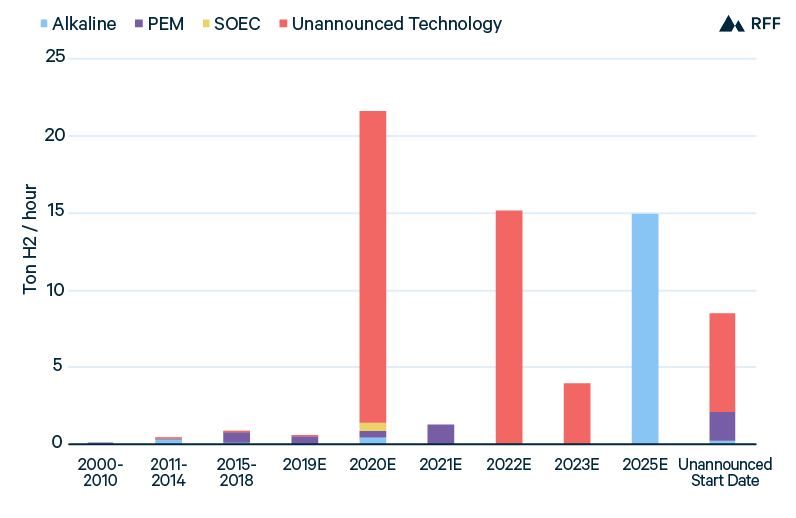
Green hydrogen projects in development highlight the importance of scale—of both hydrogen production plants and electrolyzer manufacturing—as well as power costs and utilization. Conversely, project information to date does not provide much indication of technological preference. Figure 8 shows operation and planned green hydrogen installations by technology, and with the exception of a large alkaline project set to come online in 2025 and a few smaller PEM projects, the majority of planned projects have yet to announce a technology choice. The scarcity of technological commitments suggests that the relative advantages of alkaline, PEM, and SOEC electrolyzers are unclear, at least over the near term.
Figure 8. Green Hydrogen Installations, by Technology
2.3.4. Future Costs of Blue and Green Hydrogen
From the present costs of gray, blue, and green hydrogen and projections of how component costs and factors might evolve, Figure 9 shows how the costs of hydrogen production technologies might compare over time. For blue hydrogen with CO2 capture from process emissions, production costs are already competitive with gray hydrogen after accounting for the global social cost of carbon or a tax credit equal to $50/tCO2. Blue hydrogen capturing CO2 from both process and combustion emissions is not yet cost effective. However, with increased scale—particularly of regional CCUS infrastructure—and a transition from SMR to ATR, blue hydrogen with 90 percent CO2 capture could be the most economic hydrogen production method by 2030, at an approximate cost of $1.30/kgH2 (Hydrogen Council 2020). Includes a cost of $0.06/kgH2 for the uncaptured CO2 emissions, based on the 2030 SCC.
Figure 9. Current and Projected Hydrogen Costs
Between 2030 and 2050, the production costs of green hydrogen may fall below those of blue hydrogen because of further reductions in electrolyzer and power costs. IRENA (2019) considers electrolyzer costs of $200/kW and power costs of $20/MWh for green hydrogen in 2050, giving a production cost of $1.38/kgH2 at the assumed 48 percent utilization. However, power costs and electrolyzer costs may decline significantly further. The Italian natural gas utility Snam expects that green hydrogen in 2050 will have a power cost of only €12/MWh, along with a capital cost of €162/kW (Snam 2019). A recent Bloomberg New Energy Finance analysis forecasts electrolyzer costs of just $80/kW in 2050. In combination with projected power costs of $15/MWh, green hydrogen production costs would decline to $0.80/kgH2 to $1.00/kgH2 in 2050 (Mathis and Thornhill 2019).
2.4. Costs of Hydrogen Transportation and Storage
The costs of hydrogen production do not include the cost of delivery to the end user, which could be an expensive process, given that hydrogen is a gas with a very low density and boiling point. Currently, transportation and storage costs are not significant concerns for hydrogen since 85 percent of hydrogen is produced and consumed on-site (IEA 2019). However, if hydrogen is to expand beyond its present usage in specific industrial applications, transportation and storage costs will rise and could present a substantial barrier to hydrogen growth. Since our scope is hydrogen use in the power and industrial sectors, we do not discuss the infrastructure costs of hydrogen fueling stations or the costs to distribute hydrogen to such dispersed locations, both of which would be important for hydrogen vehicles. Additionally, with our focus on the United States, which has low-priced natural gas for blue hydrogen and areas with abundant sunshine or wind for green hydrogen, we consider shipping costs only in limited detail. The concern about minimizing combined production and transportation costs—at an international scale (e.g., shipping green hydrogen from solar- and wind-rich Australia to Japan) or for fueling stations (e.g., decentralized versus centralized green hydrogen production with the respective distribution costs)—has received considerable attention but is less relevant for the US power and industrial sectors. See IEA (2015), IEA (2019), IRENA (2019), and Hydrogen Council (2020) for further discussion.
2.4.1. Storage of Hydrogen
For blue hydrogen operating on the site of an industrial consumer, as is currently the case for most gray hydrogen, significant hydrogen storage may not be needed. There would, however, be a need for CO2 infrastructure. If blue hydrogen is produced onsite, it would require CO2 pipelines and storage, but not hydrogen pipelines and storage. If blue hydrogen is produced at a merchant plant, economies of scale would permit more uses of blue hydrogen (e.g., at smaller end-use facilities), but it would require both CO2 and hydrogen infrastructure. Conversely, if the timing of hydrogen production and consumption is not perfectly aligned (as would likely be the case for green hydrogen powered by intermittent renewable energy), storage is a necessary component of hydrogen infrastructure.
For storing large volumes of hydrogen over months, geological features are likely to provide storage at the lowest cost. Four specific geological options have been evaluated: salt caverns, depleted oil and gas fields, aquifers, and rock caverns. Salt caverns are the most mature, and likely the optimal, option for storing hydrogen. The primary advantages of salt cavern storage are its efficiency (only a small fraction of the hydrogen injected is unable to be extracted), lack of contaminants, and high operating pressure—allowing rapid discharge when hydrogen is needed (IEA 2019). In Texas, the Chevron Philips Clemens Terminal has stored hydrogen in a salt cavern since the 1980s (AIS Software 2017). More recently in Texas, Air Liquide commissioned the world’s largest hydrogen storage facility, capable of storing 30 days of production from an SMR plant (Air Liquide 2017).
The other three options—depleted reservoirs, aquifers, and rock caverns—entail likely disadvantages and greater uncertainties for storing pure hydrogen, although natural gas is stored extensively in depleted reservoirs and aquifers in the United States (EIA 2020d). Relative to salt caverns, the disadvantages of these options include more permeable formations (which reduce efficiency and operating pressure), greater contaminants (which could require costly removal on hydrogen discharge), and hydrogen reactivity with rocks, fluids, and microorganisms (which reduce efficiency and cause contamination). The motivation for exploring these options is to increase the space and range of hydrogen storage, since the availability of salt caverns is more geographically limited (BNEF 2020). Figure 10 shows US natural gas storage facilities, with salt domes concentrated in the Gulf Coast region and depleted gas fields more widespread. However, salt formations also occur in the Great Lakes, Western Plains, and Rocky Mountain regions (Casey 2009), suggesting that salt cavern storage for hydrogen could be developed beyond the Gulf Coast.
Figure 10. US Underground Natural Gas Storage Facilities, by Type
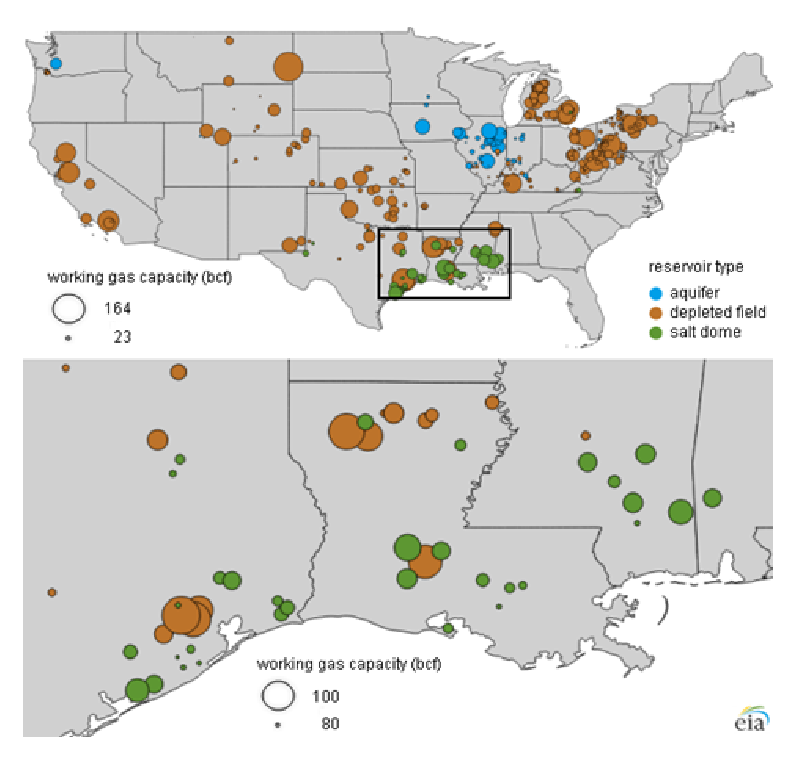
IEA (2015) evaluates the four options for geologic storage of hydrogen, finding salt caverns optimal, so long as they are geographically available. Depleted oil and gas reservoirs and aquifers are technically feasible but entail higher investment and operating costs. Rock caverns have greater technical uncertainty but with potentially lower investment and operating costs than aquifers and depleted reservoirs. BNEF (2020) finds similar cost trends, estimating benchmark storage costs of $0.23/kgH2 for salt caverns, $1.90/kgH2 for depleted gas fields, and $0.71/kgH2 for and rock caverns. Substantial cost reductions are possible, and they estimate possible future storage costs of $0.11/kgH2, $1.07/kgH2, and $0.23/kgH2 for salt caverns, depleted gas fields, and rock caverns, respectively.
2.4.2. Transportation of Hydrogen
Transporting a large quantity of hydrogen, a gas, at low cost requires pipelines, conversion to an alternative energy carrier, or liquefaction. Pipeline transport of pure hydrogen (we discuss blending with natural gas below) requires the construction of hydrogen pipelines or, potentially, the modification of existing natural gas pipelines no longer used for that purpose. Although geographically limited, hydrogen pipelines are currently in use in the United States, notably Air Liquide’s Gulf Coast Pipeline System, which connects hydrogen production and storage with industrial consumers (Air Liquide 2017).
Pipeline costs are characterized by high capital costs and low operating costs, such as for compression. Although hydrogen has a very low density, its rapid flow through pipes (almost three times faster than natural gas) lessens this disadvantage. IEA (2019) estimates hydrogen pipeline capital costs of $1.2 million/km and total transport costs of approximately $0.07/kgH2 for every 100 km. BNEF (2020) provides a similar estimate of pipeline transport costs of $0.10/kgH2 to $0.58/kgH2 for distances of 100 km to 1,000 km.
Transportation of hydrogen gas through pipelines entails costs that scale almost linearly with distance; an alternative approach is to convert hydrogen gas to a liquid carrier and transport it through pipeline or by ship at a lower cost per distance. Since this approach involves costly conversion steps, only for long distances will it be less expensive than hydrogen pipeline transmission. IEA (2019) estimates that for distances greater than 1,500 km, conversion to either ammonia or a liquid organic hydrogen carrier (LOHC), shipping, and reconversion to hydrogen would be lowest cost mode of transport. For example, given the distance between the Gulf Coast (with prime blue hydrogen resources) and the Northeast, ammonia or LOHC shipping could be most efficient. The transportation cost advantage would also shift toward the shipping of ammonia (but not LOHC) if ammonia could be used at the destination, thus eliminating the need for reconversion to hydrogen. Ammonia can also be transported in pipelines, at a lower cost per distance than hydrogen pipeline transport but a higher cost per distance than ammonia shipping. A final consideration is that the conversion and reconversion steps for ammonia or LOHCs are energy intensive, collectively consuming 20 to 40 percent of the hydrogen’s energy value (IEA 2019).
2.4.3. Total Hydrogen Supply Costs
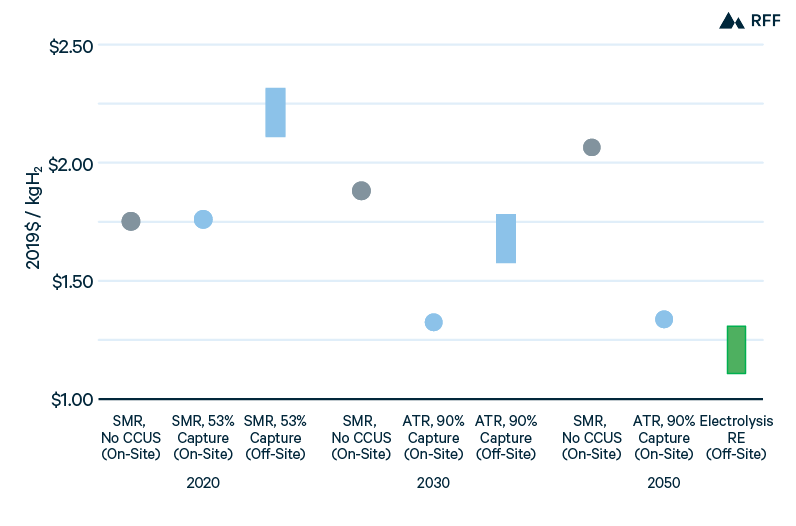
Figure 11 takes the production costs from Figure 9 to illustrate how the costs of hydrogen storage and transportation could affect the choice of hydrogen production technology and location. The first category in each time period is SMR, produced at the end-use site (e.g., a refinery). The costs of on-site SMR increase from 2020 through 2050 as the social cost of carbon rises. The second category is the least-cost on-site decarbonized hydrogen method—SMR with 53 percent capture in 2020 and ATR with 90 percent capture in 2030 and 2050. Note that green hydrogen, produced from zero-carbon electricity that fluctuates in availability or price, would generally require storage and thus is not well suited to on-site production (unless salt cavern storage were available on site). The third category is the least-cost off-site decarbonized hydrogen method—SMR with 53 percent capture in 2020, ATR with 90 percent capture in 2030, and renewable energy electrolysis in 2050—and includes costs for salt cavern storage and pipeline transport between 100 km (low case) and 500 km (high case). Although this simple illustration makes strong assumptions (in particular, that end-use facilities have cost-effective access to CO2 pipelines necessary for on-site blue hydrogen), it shows that on-site blue hydrogen has a considerable advantage until green hydrogen production and salt cavern storage can achieve substantial cost reductions.
Figure 11. Total Costs of Hydrogen Supply
2.4.4. Reduction of Transportation and Storage Costs
Along with cost reductions in the hydrogen storage and transportation methods discussed above, two strategies have been proposed to lower the costs or reduce initial requirements of infrastructure: (i) blending hydrogen with natural gas to utilize existing natural gas infrastructure; and (ii) developing hydrogen infrastructure within a confined geographic scope.
2.4.4.1. Hydrogen Blending with Natural Gas
Blending hydrogen with natural gas has appeal because today’s extensive natural gas storage and pipeline infrastructure could allow the development of hydrogen to proceed before incurring the capital costs—and potentially lengthy timeline—of building a dedicated network. Therefore, blending with natural gas could enable the scaling up of hydrogen in various new applications before commitments to infrastructure are made for pure hydrogen. Nevertheless, there are limits to the proportion of hydrogen that may be blended with natural gas. In natural gas pipelines, blending limits can result from the lower energy density by volume of hydrogen and the potential for hydrogen to embrittle steel. On average, 10 to 20 percent hydrogen by volume is feasible without infrastructure modifications (IRENA 2019), Since the energy density by volume of hydrogen is about one-third that of natural gas, the energy share of hydrogen in a blend will be less than its volumetric share. but infrastructure components may vary widely in their tolerance for hydrogen. See IEA (2015) for a listing of transportation, storage, distribution, measurement, and appliance types and the and the percentages of hydrogen that may be blended without and with equipment modifications. A component of the natural gas network with a low tolerance for hydrogen could limit hydrogen blending throughout the network.
Industrial consumers of natural gas, for both feedstock and fuel, may have narrow specifications for the purity of the gas mixture, so hydrogen blending would be less suitable in these processes. Moreover, because the cost of separating hydrogen from a mixture with natural gas is prohibitive (IEA 2019), natural gas blending for the sake of pipeline utilization is not sensible unless the final consumer is amenable to a blend of natural gas and hydrogen. The power sector appears to be more flexible for natural gas blending, with recent gas turbines that are compatible with a sizable proportion of hydrogen. For example, modern gas turbines from Mitsubishi Hitachi Power System (MHPS) can use 30 percent hydrogen (MHPS 2019). Although outside the scope of this report, the retail natural gas sector (for commercial and residential customers) has also shown potential for hydrogen blending. For example, Hawaii Gas adds 12 percent hydrogen in its natural gas distribution on Oahu (MHPS 2019), and the Italian utility Snam is testing the blending of up to 10 percent hydrogen (Snam 2019).
2.4.4.2. Hydrogen Development Clusters
When dedicated hydrogen infrastructure is to be built, because either blending limits are exceeded or it is simply the less expensive option, transportation costs may be minimized by locating hydrogen production, demand, and storage in close proximity. In the United States, with low-cost natural gas and regions with excellent wind and solar resources, salt cavern storage may be the geographically limiting factor. As long as demand is also flexible with respect to location, clusters of hydrogen production and demand could be built around optimal storage. This is already the case for blue hydrogen in the Gulf Coast region, with access to natural gas for hydrogen production, salt cavern storage, and industrial customers. A cluster for US green hydrogen has also been proposed: the Mitsubishi project in Utah would utilize salt caverns to store the hydrogen produced, which would then provide fuel for nearby turbines and fuel cells (MHPS 2019). If the cost of power transmission is less than the cost of hydrogen transport, this type of cluster could be a model for green hydrogen in the power sector.
2.5. Conclusions about Hydrogen Supply
From the cost estimates in this chapter, blue hydrogen is a viable near-term option to replace gray hydrogen. Specifically, capturing CO2 from the process stream in SMR would be cost-effective at $50/tCO2—roughly equal to the 2020 global social cost of carbon in 2019$ (IWG 2016) and the tax credit available through 45Q—and thereby reduce the CO2 emissions footprint of hydrogen production by half. Given the expense and limited current extent of hydrogen infrastructure, either merchant blue hydrogen in an existing cluster (e.g., in the Gulf Coast region) or on-site blue hydrogen production (e.g., at a refinery or ammonia plant) would be the most feasible near-term options.
Development of CCUS technology and infrastructure would reduce both capital and operating costs of blue hydrogen, and a transition from SMR to ATR reactors could allow blue hydrogen with 90 percent capture to become the least expensive hydrogen production method (after accounting for carbon costs) for new facilities by 2030. Expanded hydrogen storage and pipelines and reduced infrastructure costs would enable more off-site hydrogen production to supply a broader set of end users. However, the high cost of transporting hydrogen over distances greater than a few hundred miles favors the use of hydrogen relatively close to its source of production.
In the longer term, from 2030 to 2050 and beyond, green hydrogen may become the most economic production process. The current planned and proposed green hydrogen plants suggest the industry’s optimism about the technology, and with increased scale, electrolyzer costs could decline rapidly, as current market research indicates (Mathis and Thornhill 2019). Moreover, further cost reductions in wind and solar power would reduce energy costs for green hydrogen, and an electricity grid dominated by intermittent renewables could have periods of low prices that grid-connected green hydrogen could make use of. Naturally, the longer term is subject to greater uncertainties in power prices, capital costs, and significant technological changes, all of which could affect the cost-effectiveness of decarbonized hydrogen supply.
3. Uses of Decarbonized Hydrogen
Below, in Sections 3.1, 3.2, and 3.3, we evaluate how decarbonized hydrogen may be used in the power sector and as a source of industrial heat and feedstock. Each section follows a general format. First, we provide an overview of how hydrogen could be used in the sector to reduce GHG emissions, covering important indirect benefits, such as supporting the feasibility of variable renewable energy. Second, we consider the processes (and their technical requirements) in which hydrogen could be utilized—in energy storage, industrial heat, or specific feedstock applications. This leads to a comparison of hydrogen with the high-emitting methods that currently predominate, as well as with low-emitting alternatives to hydrogen (such as CCUS or low-carbon power). We then assess the cost-effectiveness of decarbonized hydrogen from its value as a fuel or feedstock and the emissions that it would displace. Next, we gauge the prospects for blue and green hydrogen in these applications. Natural gas is often the incumbent energy source, and CCUS is a versatile method for reducing emissions, so it is important to understand how blue hydrogen compares with CCUS at the power or industrial plant. Finally, we measure the appropriate incentive for decarbonized hydrogen based on the emissions it would displace, and we offer conclusions on the timing and scale of decarbonized hydrogen usage in the sector.
3.1. Hydrogen in the Power Sector
3.1.1. Overview
The opportunity for decarbonized hydrogen in the power sector is to provide electricity that is responsive to demand (known as dispatchability) and has low carbon emissions. Of the primary sources of low-carbon power, only hydropower is dispatchable. Natural gas power with CCUS, still nascent on the US grid, is also dispatchable and with low emissions. As we discuss later, natural gas power with CCUS is the primary low-carbon alternative to hydrogen-fired power.
The other main US low-carbon technologies are either intermittent, such as wind or solar, or operate without flexibility to demand, like nuclear. Although this is the case in the United States, nuclear power plants in France operate to follow electricity demand. Such load-following nuclear power plants are necessary for a grid in which nuclear power supplies a large majority of electricity. As the share of power supply from intermittent renewable sources increases, the need for dispatchable electricity to meet demand rises. For example, the Sustainable Development Scenario of the World Energy Outlook projects that renewable sources would supply 67 percent of electricity in 2040, and wind and solar together would account for a majority of renewable power (IEA 2020a). The high proportion of intermittent power implies periods of both surplus (power supply in excess of demand) and deficit (power supply less than demand)—unless there is sufficient storage or dispatchable generation. Decarbonized hydrogen has the potential to prevent deficits with dispatchable power, and grid-connected green hydrogen, specifically, may also exploit surpluses or inexpensive carbon-free power. Therefore, grid-connected green hydrogen is a form of energy storage, in which electrical energy is converted to chemical energy and then reconverted when demanded. Because of its potential as energy storage, we focus primarily on grid-connected green hydrogen. However, at the end of this section, we consider blue hydrogen and green hydrogen from dedicated power sources, both of which can provide low-carbon dispatchable power (but not energy storage).
The extent of power surpluses and deficits, and thus the opportunity for hydrogen, clearly depends on the share of wind and solar power, but two other factors are significant. First, if wind and solar power have a low correlation with each other, a combination of wind and solar will be able to meet a greater proportion of demand. For instance, where wind is stronger at night (as in California), wind and solar power will be more complementary. Second, if the combination of wind and solar power has a high correlation with demand, there will be less need for storage or dispatchable generation. Since hydrogen is most competitive in storage over weeks and months, we do not discuss demand-side technologies and strategies that can make demand more flexible over short time periods (e.g., to be coincident with solar generation). These two factors vary considerably by geography. At the high latitudes of Europe, solar generation is 60 percent lower in winter than in summer, but electricity demand in winter is 40 percent higher (Hydrogen Council 2017). Therefore, at a high share of wind and solar generation, a large amount of green hydrogen to provide interseasonal energy storage may be optimal in a low-carbon electricity mix. Hydrogen Council (2017) surveys four studies of European power supply, which find that at variable renewable energy shares of 60 to 100 percent of electricity demand, 4 to 20 percent of power generation should be used for hydrogen production. The studies vary in their approaches (e.g., modeling the least-cost option to achieve 2°C scenario versus a specified share of renewable energy) and sectors included (e.g., economy-wide versus power sector only) but the general conclusions are consistent—a high percentage of variable renewable energy in Europe is only practical with interseasonal energy storage.
With rising shares of intermittent generation, the potential for storage arises for various durations, from voltage and frequency regulation over seconds to the interseasonal storage discussed above. The diurnal variation in solar output creates a large opportunity for storage over several hours, since midday solar energy could be stored for use during the evening or even nighttime. However, hydrogen storage is a multistep process that is not well suited to quick cycles or cost-effective for short durations. Compared with battery, pumped hydropower, and compressed air storage, a majority of the electricity used in hydrogen production is lost when it is returned as power. The round-trip energy efficiencies are >90 percent for lithium ion batteries, 70 percent for longer-duration flow batteries, 80 percent for pumped hydropower, and 60 percent for compressed air storage (IRENA 2017). In contrast, electrolysis has an efficiency of 60 to 70 percent (depending on the electrolyzer technology), 5 to 10 percent of the energy is lost in compression for storage and transportation, and combustion turbine and combined-cycle (CC) plants have respective efficiencies of 40 and 60 percent (IEA 2019, 2015). Thus, hydrogen storage has a round-trip efficiency of 20 to 40 percent, depending on technology choices and compression requirements.
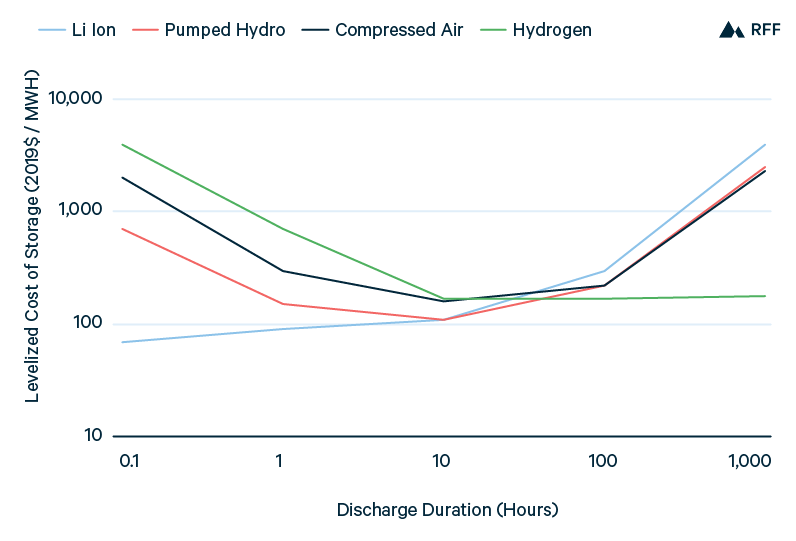
At sufficiently long discharge durations, hydrogen overcomes its energy efficiency disadvantage relative to battery, pumped hydropower, and compressed air storage. Although substantial energy is lost in the conversion to hydrogen and reconversion to power, hydrogen itself can be stored over time (e.g., in salt caverns) at far less cost per unit of energy than for the other storage technologies. Figure 12 illustrates the IEA (2019) analysis of the levelized cost of storage as a function of discharge duration, finding that hydrogen is the least expensive storage option for discharge durations longer than one to two days. Whereas the costs of battery, pumped hydropower, and compressed air storage increase rapidly from day-long discharge to week-long or month-long discharge, the cost of hydrogen storage is minimally affected by these differences in discharge duration.
Figure 12. Storage Costs and Discharge Duration
3.1.2. Cost Analysis for Hydrogen in the Power Sector
As a form of chemical energy, with its advantage of low-cost, long-duration storage, hydrogen is more comparable to natural gas than to battery, pumped hydropower, or compressed air storage. Furthermore, hydrogen—like natural gas—may be used in a combustion turbine (CT) for flexible generation or in a CC plant for longer-duration power supply. Indeed, hydrogen may also be blended with natural gas in either CT or CC power plants. In this section, we analyze the costs of hydrogen versus natural gas power in dedicated CT and CC plants, as well as the costs of hydrogen blended with natural gas. Power cost (in $/MWh) is the levelized cost of electricity (LCOE) to account for a plant’s capital and operating costs as well as its utilization. LCOE is calculated as the ratio of the present value of total costs to the present value of electricity generation. Because hydrogen does not emit CO2 on combustion, we assume that natural gas power incurs the SCC for its greenhouse gas emissions (of CO2 and methane) to provide a fair comparison of total electricity costs. However, we do not include the costs of conventional air pollutants (SO2, NOX, PM2.5, and PM10), which vary by location within the United States and are typically more modest than the costs of greenhouse emissions of natural gas (however, in areas with stringent pollution controls, such as Los Angeles, PM2.5 emissions would incur substantial costs). The combustion of hydrogen may also cause NOX emissions, but the magnitude is uncertain. In the CC case, we include the option of natural gas with 90 percent CO2 capture, which appears to be a viable choice for low-carbon natural gas power. Given the lower capacity factor of CT plants, carbon capture is not considered in that case. As shown in Figure 14, a high capacity factor is needed to amortize the increased capital costs for power plants with carbon capture. Lastly, although fuel cells are potential generators using either natural gas or hydrogen, we do not include them because high capital costs make them less competitive than CC plants (Lazard 2018).
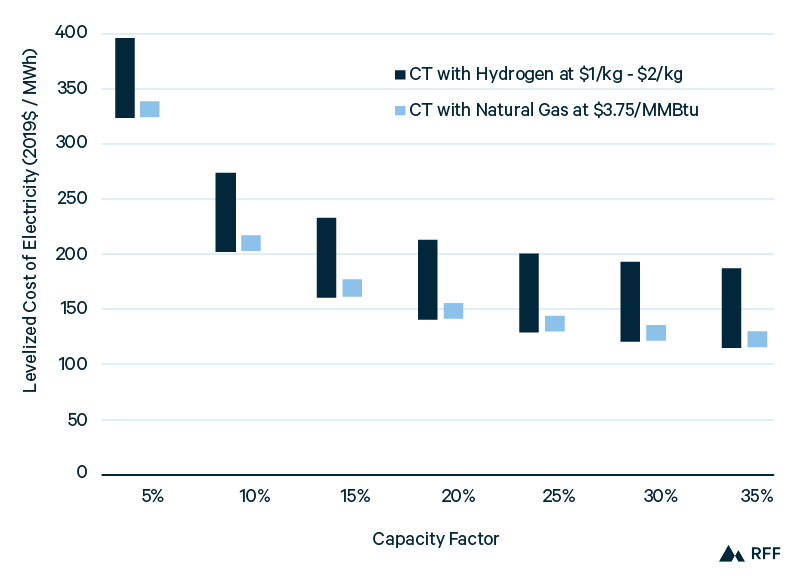
Figure 13 shows the power costs of CT plants using hydrogen or natural gas as a function of plant capacity factor. CT power plants, though less efficient than CC plants, have the ability to ramp generation up and down quickly in response to demand, and thus provide valuable flexibility. Hydrogen, at least at the low end of its range, is competitive with natural gas power. However, the cost-effectiveness of hydrogen rests on several optimistic assumptions, which we make throughout this analysis. First, the range of hydrogen costs considered is $1.00/kgH2 to $2.00/kgH2; even the high end of this range (which is uncompetitive with natural gas) is below the midpoint projection of $2.15/kgH2 for green hydrogen production in 2030 (Figure 9). For hydrogen power costs to equal the high end of natural gas power costs in Figure 13, the cost of hydrogen would have to be about $1.25/kgH2. Furthermore, the fuel cost to the power plant is the delivered cost of natural gas or hydrogen and thus is inclusive of storage and transportation costs. With its mature infrastructure and greater volumetric energy density, natural gas storage and transportation costs are relatively inexpensive—about $0.50/MMBtu. Calculated as the approximate difference between the natural gas electric power price (see https://www.eia.gov/dnav/ng/ng_pri_sum_a_EPG0_PEU_DMcf_a.htm) and the Henry Hub natural gas price (EIA 2020b) since 2016. For hydrogen (from Figure 11), even with salt cavern storage and a pipeline distance of just 100 km, storage and transportation would cost approximately $0.33/kgH2 in 2020 and $0.21 in 2050 (equal to $2.50/MMBtu and $1.50/MMBtu, respectively). Therefore, to be competitive with natural gas in CT plants, hydrogen production costs would need to decline below $1.00/kg, an optimistic scenario even in 2050.
Figure 13. Combustion Turbine Power Costs for Hydrogen and Natural Gas, without CO2 Capture
The second key assumption is a comprehensive climate policy for natural gas power, with all greenhouse gas emissions priced at the global SCC. Emissions include the CO2 from natural gas combustion as well as noncombustion emissions from both the natural gas fuel cycle (energy consumed in natural gas production, processing, and transmission) and methane leaks in the supply chain (NREL 2012; Rhodes et al. 2016). For LCOE calculations, we assume that methane has a GWP of 30. Over a 100-year period, the GWP for methane is between 28 and 36 (EPA 2020). With an SCC of $61/tonCO2-eq in 2030 (the low case) and $84/tonCO2-eq in 2050 (the high case), From IWG (2016), inflated from 2007$ to 2019$. greenhouse gas emissions add $39/MWh to $54/MWh to power costs for CT with natural gas. Noncombustion emissions account for about $8/MWh to $11/MWh, so without a price on these emissions, hydrogen costs would need to decline by an additional $0.11/kgH2 to $0.15/kgH2 to be competitive. Conversely, we assume that hydrogen-based CT power incurs no greenhouse gas charges at the plant level, Blue hydrogen, of course, would be charged for uncaptured emissions. which may be too optimistic an assumption. Although hydrogen combustion has no climate impact, hydrogen itself is an indirect greenhouse gas with a GWP of 5 (Derwent et al. 2020). Therefore, leaks in hydrogen infrastructure would cause an external cost, albeit a much smaller one per MMBtu of hydrogen than per MMBtu of methane. Compared with methane, H2 has not only a lower GWP (5 versus 30) but also a higher energy density by mass (142MJ/kg versus 56MJ/kg), so a lower mass of hydrogen is needed for the same energy content. Given the limited scale of dedicated hydrogen infrastructure, the leakage rate for hydrogen is unclear, so we do not estimate a leakage cost for hydrogen power.
Other assumptions include equivalent heating efficiencies and equivalent turbine costs and performances for hydrogen and natural gas. Hydrogen may incur a slightly greater loss in heating efficiency compared with natural gas. Hydrogen has a 15 percent difference between its lower heating value (LHV) and higher heating value (HHV), compared with 10 percent for natural gas, because a greater mass of water is produced per kgH2 than per kgCH4. The difference between HHV and LHV reflects the heat required to vaporize water, which may not be recovered. As for turbines, MHPS (2019) asserts that modern turbines could be upgraded from natural gas to hydrogen with modest modifications, but validation of a turbine using 100 percent hydrogen is not planned until 2025, so there may be some differences in cost and performance.
Figure 14 presents the power costs from using hydrogen or natural gas in a CC power plant. Although CC plants lack the fast ramping ability of CT plants, power costs are significantly lower: the addition of the steam turbine increases fuel efficiency by about 50 percent with a comparatively small percentage increase in the capital cost per MW (NREL 2019). Therefore, CC plants are utilized more consistently to supply power. For example, in 2019, the average capacity factors for CCNG and CTNG power plants were 57 percent and 11 percent, respectively (see https://www.eia.gov/electricity/monthly/epm_table_grapher.php?t=epmt_6_07_a). Comparing CC using hydrogen (CCH2) with CC using natural gas (CCNG) without CO2 capture, CCH2 is competitive only with hydrogen costs below $1.25/kgH2. This result is almost identical to what is shown for CT plants in Figure 13. The relative benefit to hydrogen of a lower fuel cost per MWh is offset by the lower emissions costs per MWh for natural gas in CC versus CT power plants. Significantly, the assumptions discussed above—the low delivered costs of hydrogen, comprehensive carbon pricing, and equivalent cost and efficiency of power plants using hydrogen versus natural gas—apply to this analysis as well.
Figure 14. Combined-Cycle Power Costs for Hydrogen and Natural Gas, with and without CO2 Capture
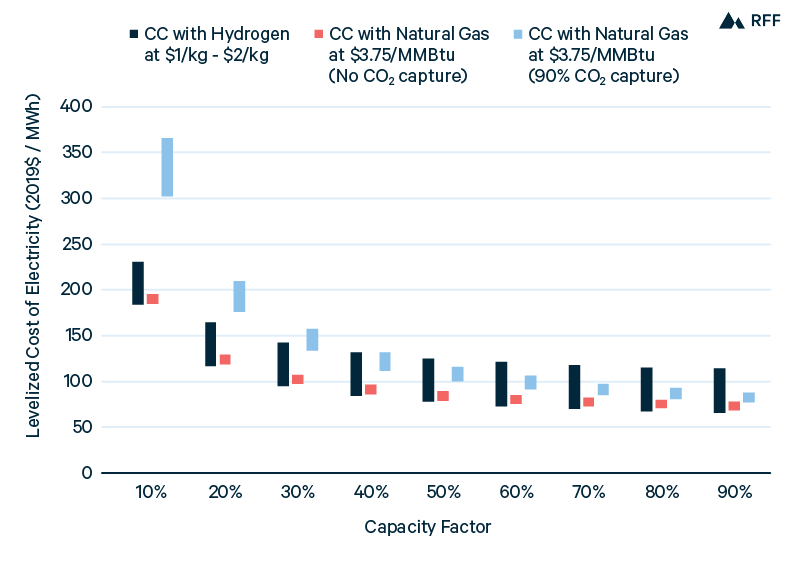
The important difference between Figures 13 and 14 is the potential for CCNG with 90 percent CO2 capture. The cost of CCNG with carbon capture is expected to decline over time, so we model a high-end capital cost of $2,200/kW (the 2020 cost from NREL 2019) and a low-end capital cost of $1,700/kW (the 2050 cost from NREL 2019). Having higher capital costs than CC plants without capture and lower variable costs—through lower fuel costs than CCH2 and lower emissions costs than CCNG without capture—the capacity factor has a greater effect on the power costs of CCNG with CO2 capture. From Figure 14, only at a 90 percent capacity factor is the inclusion of carbon capture potentially cost-effective for CCNG power plants.
A significant reason for the less favorable economics of CCNG with capture is that these plants still incur between $11/MWh and $15/MWh in greenhouse gas costs, respectively assuming either the 2030 SCC or the 2050 SCC. Although 90 percent of CO2 from combustion is captured, noncombustion emissions from the natural gas fuel cycle and methane leakage are not reduced. Indeed, noncombustion emissions are slightly higher for CCNG plants with CO2 capture than without capture because of their increased natural gas consumption. NREL (2012) and Rhodes et al. (2016) assume national averages for fuel cycle emissions and leakage rates; more efficient production, processing, and transmission of natural gas and reduced methane leaks would improve the cost-effectiveness of CO2 capture for CCNG plants. Additionally, the cost of CCNG plants with CO2 capture may decline more than anticipated, and new technologies, such as the Allam Cycle currently under demonstration in a 50MW power plant in Texas, offer alternative pathways to natural gas power with carbon capture (NET Power 2020). Without reduced methane emissions or CCUS costs, CCNG without capture—using either low-cost hydrogen (less than $1.25/kgH2) or natural gas—will be the most economic option for dispatchable power through 2050.
As we discussed in Section 2.4, blending hydrogen with natural gas is feasible in the power sector and could allow hydrogen to gradually scale before dedicated infrastructure is built. Figure 15 compares the power costs from a hydrogen and natural gas blend with the power costs from natural gas alone, in both CT and CC plants. We assume a blend of 30 percent hydrogen by volume—consistent with the tolerance of modern gas turbines (MHPS 2019)—which is equal to 12.5 percent hydrogen by energy content, given the lower volumetric energy density of H2. Figure 15 presents costs with an illustrative capacity factor for CT and CC plants of 20 and 60 percent, respectively, but since plant costs and efficiencies are assumed to be equal for hydrogen blend and natural gas generators, the capacity factor does not affect differences in power costs.
Figure 15. Combustion Turbine and Combined-Cycle Power Costs with Natural Gas and H2–CH4 Blend
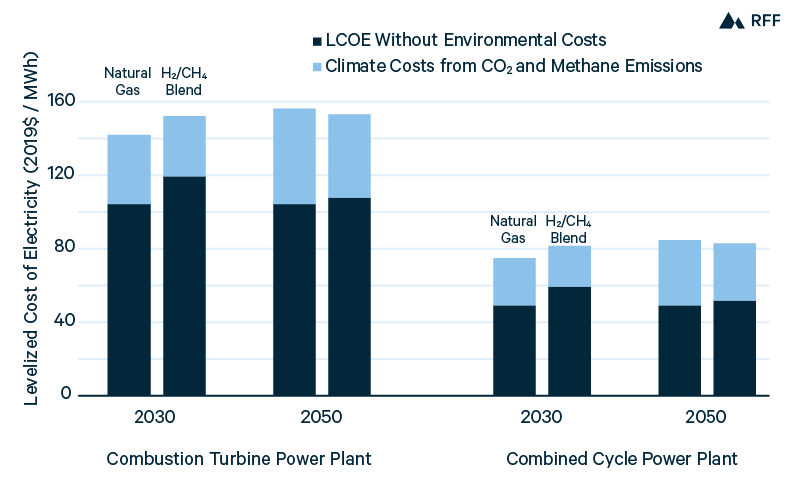
Assumes capital costs and capacity factors of $800/kW and 20 percent, respectively, for CT plants, and $900/kW and 60 percent, respectively, for CC plants. Fixed and variable operation and maintenance costs are from NREL (2019). 2030 and 2050 hydrogen costs of $2.15/kg and $0.90/kg, respectively, are converted with an energy density of 0.134MMBtu/kg. Natural gas cost of $3.75/MMBtu is based on an average Henry Hub price from 2020 to 2050 of $3.25/MMBtu, from EIA (2020a), and a transportation cost of $0.50/MMBtu. Assumes no environmental costs other than from CO2 and CH4.
Figure 15 shows that with the SCC and an average green hydrogen cost ($2.15/kgH2, from Figure 9) in 2030, blending hydrogen would not be cost-effective in either CT or CC plants. However, with a reduced green hydrogen cost (of $0.90/kgH2, from Figure 9) and a higher SCC in 2050, hydrogen blending yields slightly lower CT and CC power costs. Figure 15 separates the power costs into environmental and nonenvironmental costs, illustrating how the disadvantage of higher fuel costs from hydrogen blending is offset by the lower costs from reduced greenhouse gas emissions. Even at $0.90/kgH2, hydrogen is nearly twice as expensive as natural gas on an energy basis ($/MMBtu), so environmental cost savings are essential to the cost-effectiveness of hydrogen blending. We do not assume any additional transport cost for hydrogen blended into natural gas or an environmental cost from hydrogen leakage. This latter assumption may be less tenable for hydrogen blending with natural gas than for it is for dedicated hydrogen infrastructure. Melaina et al. (2013) finds that hydrogen in natural gas infrastructure has a leakage rate at least three times higher than that of natural gas. Although hydrogen has a lower GWP and higher energy density by mass than methane, hydrogen leakage would reduce the benefit of hydrogen blending. The variable quality of infrastructure and leakage propensities of different gases causes uncertainties in the climate effects of both natural gas and hydrogen.
3.1.3. Blue and Green Hydrogen in the Power Sector
In assessing the opportunity for decarbonized hydrogen in the power sector, green hydrogen is likely to have greater potential than blue hydrogen, for two reasons: hydrogen cost and integration value. Although the cost of blue hydrogen is currently far below that of green hydrogen (Figure 4), green hydrogen production costs could fall below $1.00/kgH2 in the long term, as discussed in Section 2.3. Conversely, it is unclear how blue hydrogen would achieve such a cost. SMR is a technology with both maturity and scale, and low-end production costs are $1.05/kgH2 (Friedmann et al. 2019).
Even if the additional cost of 90 percent carbon capture falls to $0.20/kgH2 (whether by adding CCUS to SMR or by switching to ATR reactors with carbon capture), the total production cost would still exceed $1.30/kgH2 after including the social cost of uncaptured CO2. Equal to $0.06/kgH2 to $0.08/kgH2, assuming an emissions intensity of 1 kgCO2/kgH2 (IEA 2019) and social costs of $61/tCO2 and $84/tCO2, respectively. If fugitive methane costs from leaks in natural gas infrastructure and the costs of hydrogen storage and transportation were also included, the delivered cost of hydrogen would be well above $1.50/kgH2. Therefore, blue hydrogen is unlikely to reach cost-effectiveness with natural gas in the power sector without some unforeseen technological advancement.
On-site blue hydrogen would save $0.20/kgH2 to $0.50/kgH2 by eliminating the need for hydrogen storage and transportation, but it is an inefficient method for applying CCUS to power generation. Blue hydrogen for power generation is precombustion carbon capture, in which natural gas is reformed to hydrogen—with the CO2 captured in this step—and then the hydrogen is combusted to generate power. Postcombustion carbon capture, with CO2 captured from the combustion flue gases, and oxy-combustion, in which natural gas is burned in pure oxygen with subsequent CO2 separation, are preferred methods for natural gas with CCUS (DOE 2017). In precombustion carbon capture, more than 30 percent of the energy is lost in the conversion of natural gas to hydrogen (IEA 2019), which constrains the total efficiency of the process. Rather than using blue hydrogen, power generators could achieve carbon capture at lower cost through postcombustion or oxy-combustion carbon capture, illustrated in Figure 14 at capacity factors above 60 percent. From Figure 14, there is a potential opportunity for blue hydrogen as an alternative to NGCC plants with carbon capture that run at low capacity factors (< 50 percent). Blue hydrogen itself is optimally produced at a high capacity factor, but one blue hydrogen facility (running at a high capacity factor) could supply multiple CC power plants running at low capacity factors. However, this approach would require hydrogen storage and transportation, which are costlier than natural gas storage and transportation. Moreover, it would not be competitive with NGCC without capture at the 2050 SCC.
Besides its cost, blue hydrogen lacks the capacity for energy storage that offers prospective value to grid-connected green hydrogen. Blue hydrogen could provide low-carbon dispatchable power to the grid, but it could not serve to store power between periods of low and high net demand. Similarly, green hydrogen from a dedicated power source could only supply zero-carbon fuel for power generation. In contrast, grid-connected green hydrogen—as a process of energy storage—has the potential to reduce curtailment and provide greater demand for wind and solar power on the grid, as well as to supply electricity during periods of scarcity. Thus, the motivation for blue hydrogen (or green hydrogen from a dedicated source) is less compelling than that for grid-connected green hydrogen in integrating large shares of intermittent renewable energy in the power sector.
3.1.4. Hydrogen in the Power Sector: Conclusions
Although hydrogen has the potential to contribute to a low-carbon power sector, it will likely be cost-effective only in the long term. Green hydrogen capital costs need to decline substantially, and inexpensive storage and transportation need to be established beyond the US Gulf Coast. The longer time horizon would also lead to a higher SCC, increasing the cost of natural gas power. Lastly, with falling costs and increasing shares of wind and solar power over time, the cost of grid-connected green hydrogen would fall and the value of long-term storage would rise. As these factors vary by region, so too will the timing for cost-effective hydrogen in the power sector. In Europe, for example, higher natural gas prices and a greater need for inter-seasonal storage (given its latitude) may motivate green hydrogen sooner than in the United States.
Figure 16. Breakeven Costs for Hydrogen Power, by Fuel and Climate Benefits
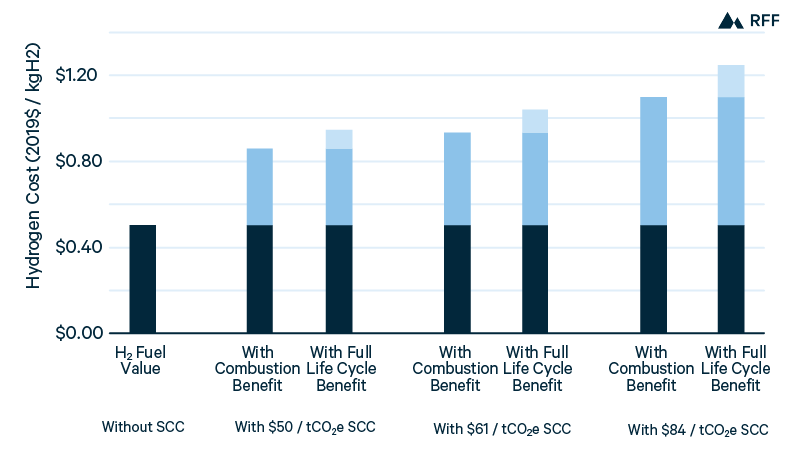
Figure 16 presents the breakeven costs for hydrogen power, assuming various social costs of carbon and including combustion only or both combustion and noncombustion emissions. Consequently, Figure 16 shows the necessary hydrogen incentive to achieve a certain breakeven cost. Without an incentive to account for climate costs, the delivered cost of hydrogen would have to fall to $0.50/kgH2 to compete with natural gas. With an incentive of $50/tCO2-eq—the current SCC—hydrogen of about $0.95/kgH2 would be cost-effective. Incentives of $61/tCO2-eq and $84/tCO2-eq—the SCC of 2030 and 2050, respectively—would provide values of about $0.55/kgH2 and $0.75/kgH2, allowing hydrogen to be competitive with delivered costs of $1.05/kgH2 and $1.25/kgH2. If the incentive accounted for the benefit of reducing natural gas combustion emissions but not noncombustion emissions, the value of the incentive would fall by one-fifth and the breakeven hydrogen cost would be even lower. In other terms, the replacement by hydrogen of natural gas power leads to a reduction of about 7 kgCO2/kgH2 for combustion emissions and 1.75 kgCO2-eq/kgH2 for noncombustion emissions. This is not to suggest that a hydrogen incentive is the optimal mechanism for reducing noncombustion emissions from natural gas; a methane-focused policy would be more appropriate. The breakeven costs in Figure 16 are valid whether hydrogen is subsidized (or natural gas is taxed) for the climate costs of natural gas power. As we conclude throughout Section 3, the cost-effectiveness of decarbonized hydrogen depends on the fuel value of hydrogen and the carbon-intensity of the fuel it would replace. Given the low costs of US natural gas and its relatively modest emissions (compared with, say, coal), hydrogen production, transport, and storage costs must be fairly low for decarbonized hydrogen to be competitive—and that will likely be achievable only in the long term, even with a hydrogen incentive equal to the SCC. Of course, with a higher incentive, the competitiveness of hydrogen can be improved.
3.2. Hydrogen for Industrial Heat
3.2.1. Overview
Because the industrial sector is a large source of global CO2 emissions with particular challenges to decarbonization, low-carbon hydrogen has significant potential as a source of heat and a feedstock. Feedstock and integrated processes—where hydrogen is used for both feedstock and fuel—account for nearly all current hydrogen demand. In Section 3.3, we discuss how decarbonized hydrogen can lower emissions in these applications. In this section, we examine the role for hydrogen in providing industrial heat, an area with minimal hydrogen use at present. Industrial processes often require heat to melt or vaporize substances or to enable chemical reactions. As a fuel that produces no CO2 in combustion, hydrogen could substitute for the fossil fuels that currently supply most industrial heat.
Fossil fuel combustion for heat is responsible for a large fraction of industrial emissions, with process emissions and the energy to operate machinery being the other principal sources. CO2 emissions from the industrial sector have risen faster than total CO2 emissions over the past 20 years, increasing at a rate of 2.8 percent per year versus total CO2 emissions growing 2.0 percent per year from 1997 to 2017. Consequently, industrial emissions now account for approximately 22 percent of total global CO2 emissions (Friedlingstein et al. 2019). Heat accounts for 42 percent of industrial emissions globally, and this proportion rises to 58 percent in the United States (Friedmann et al. 2019). The energy required for industrial heat is correspondingly massive, equal to 130 EJ or 23 percent of global primary energy supply (Hydrogen Council 2017; IEA 2020b).
Despite the scale of industrial heat and the large opportunity for decarbonization, there has not yet been investment in reducing emissions from industrial heat comparable to that in the electric power and transportation sectors. Friedmann et al. (2019) and Sandalow et al. (2019) suggest several reasons for the relative inactivity in decarbonizing industrial heat. First, industrial facilities are capital intensive and have long operating lifetimes. Therefore, owners may be reluctant to invest in emerging technologies that entail increased risk, and any investments will only slowly affect the sector, given the low turnover of industrial equipment. Second, industrial goods are not consumer products, so consumer preferences for low-carbon varieties may not support much of a price premium in the industrial sector. Third, as we discuss next, industrial processes generally have specific technical requirements that limit the options for substituting low-carbon heat sources. Two significant policy considerations for industrial decarbonization are relevant to the discussion in Section 4. First, most industrial goods (besides cement) face considerable international competition, so increased domestic costs would result in leakage—shifting production and CO2 emissions to countries without a carbon price for industry. This is in contrast to the US power sector, where the lack of international trade allows cost increases for emissions-reducing investments to be more easily passed on to customers. Second, the industrial sector often has outsized political importance, and policymakers may be resistant to imposing even modest costs on producers.
3.2.2. Industrial Heat Requirements and Types
The technical requirements of industrial heat have several dimensions, the most obvious being the temperature. Industrial processes often necessitate temperature at or in excess of a particular level based on chemical reaction needs or transitions between solid, liquid, and gaseous states. Depending on its temperature, industrial heat is categorized as high, medium, or low, which we discuss further below. Heat flux is also important, as heat lost during an industrial process needs to be replenished to maintain a certain temperature. A process that requires a fast rate of heat to be added to the system would necessitate a heat source with high flux. A third dimension is heat availability, an indicator of whether the heat applied to the system is able to sufficiently heat all of the necessary components. Friedmann et al. (2019) contrast the internal heating of a cement kiln through fuel combustion with external surface heating through electrical resistance; the latter option may not achieve a uniform temperature inside the kiln. Lastly, heat reliability would present an obstacle for the use of intermittent renewable energy. Variability of heat would reduce the utilization of costly plant capital and may create operational problems.
Industrial heat is classified as high, medium, or low, with high-temperature heat above 400 degrees C, medium-temperature heat between 100 and 400 degrees C, and low-temperature heat below 100 degrees C. IEA (2019) and Hydrogen Council (2017, 2020) consider 400 degrees C to be the boundary between medium- and high-temperature heat; McKinsey (2018) divides the categories at 500 degrees C. Currently, high-temperature heat is most often supplied through the combustion of fossil fuels, with electricity contributing where heat flux, cost, and availability allow. Medium-temperature heat generally comes from natural gas–, oil–, or coal-fired steam, and low-temperature heat is typically waste heat (from higher-temperature processes) or from boilers (McKinsey 2018). Biomass is also a heat source, particularly in the agriculture and pulp and paper sectors (see https://www.eia.gov/energyexplained/use-of-energy/industry.php).
High-temperature heat accounts for roughly half of global demand for industrial heat, and its use is concentrated in three industries. More than 85 percent of high-temperature heat is consumed in the production of iron and steel, chemicals, and cement (IEA 2019). Medium- and low-temperature heat each account for about one-quarter of global demand, and their use is distributed across numerous industries. Chemicals manufacturing is a large end use, but the pulp and paper, agriculture and food processing, mining, textile, and construction sectors are also significant consumers of medium- and low-temperature heat (McKinsey 2018).
The interest in hydrogen for industrial heat is based, in part, on its favorable technical characteristics—hydrogen can supply heat of high temperature with generally high flux, availability, and reliability. Because hydrogen is not the only option for decarbonizing industrial heat (and may not be the least costly), we next consider other options and then compare them with hydrogen in terms of cost and technical feasibility. Finally, we analyze particular industrial applications where hydrogen is likely to be most competitive. We thus infer the hydrogen cost and incentive that would be necessary for hydrogen to replace fossil fuels as a heat source in certain industrial processes.
3.2.3. Other Low-Carbon Industrial Heat Options
To assess the potential of hydrogen for industrial heating, we review the low-carbon heat sources that have received greatest consideration— electricity and biomass—as well as CCUS, before turning to hydrogen. Other options may lack geographic range (in the case of solar thermal) or the ability to provide heat of sufficient temperature for many industrial processes (in the case of nuclear power). For a broader discussion of low-carbon heat sources, see Friedmann et al. (2019). Note that electricity is not necessarily a low-carbon heat source because it depends on the generation mix. Similarly, biomass may entail substantial emissions given the CO2 releases throughout its life cycle. Along with the technical advantages and disadvantages of the various low-carbon heat options, we discuss the extent to which these options are indeed low carbon.
3.2.3.1. Electricity
Electricity is already a source of industrial heat, and with a decarbonizing power grid and expanded set of industrial heating applications, electrification could reduce emissions from the sector. However, because of the conversion losses in generating electricity, the grid may need to be significantly decarbonized for electrification of heat to be beneficial. For instance, conversion of heat to power and then power to heat may be very inefficient. The numerous methods of electric heating can be categorized as either direct (from electricity passing through the material to be heated) or indirect (from electricity passing through a separate material, whose heat is transferred to the material of interest). Indirect resistance heating is the most versatile method, but industrial processes and material properties may dictate finely tuned technologies for efficient electric heating. For descriptions of electric heating technologies and potential industrial applications, see Sandalow et al. (2019) and Friedmann et al. (2019).
The advantages of electric heating over fuel combustion are its capacity for precise temperature regulation and rapid adjustment as well as lower maintenance costs from the lack of combustion-related damages (Sandalow et al. 2019). Conversely, electrification of heat often involves substantial redesigns of industrial equipment and thus considerable capital expenditures. Therefore, it is less suited to plant retrofits; McKinsey (2018) finds that electrification is a more cost-effective option in greenfield versus brownfield applications. Additionally, high-temperature processes may be designed to utilize waste heat from combustion, in which case electrification would require supplementary low-temperature heat.
Given those considerations, electric heating is well suited to low- and medium-temperature applications and to specific high-temperature processes, particularly in new plants. Naturally, the price and CO2 content of power used are the main factors in determining the cost-effectiveness of electricity in reducing emissions from industrial heat.
3.2.3.2. Biomass
As with electricity, biomass is an existing industrial heat source with potential for expanded use. Currently, almost 10 percent of fuel consumed in US manufacturing is biomass, primarily used in the pulp and paper sector. Manufacturing accounts for about three-quarters of industrial energy use in the United States (see https://www.eia.gov/energyexplained/use-of-energy/industry-in-depth.php). Biomass covers a wide range of fuels, most often derived from plant sugars and starches, cellulose (fiber), woody materials, and fats. From these raw materials, biomass may be processed into solid, liquid, or gaseous forms. Its varieties and forms allow biomass to potentially substitute for coal, petroleum, or natural gas. Moreover, biomass may provide high-temperature heat—biodiesel combustion reaches 2,200 degrees C, sufficient for all major high-temperature industrial processes (Friedmann et al. 2019). In steel production, biomass-derived products (e.g., charcoal) may substitute for coke from coal, which is already common in Brazil (Sandalow et al. 2019). The steel production process illustrates how biomass, like hydrogen, can serve as a feedstock as well as a fuel. As a source of industrial heat, biomass could expand beyond its current niche in the pulp and paper sector, assisted by its comparatively simple substitution for fossil fuels.
Despite its versatility, biomass has challenges as a low-carbon industrial fuel. In many of its forms, biomass has a lower energy density than its fossil fuel substitute. Furthermore, substitution of fossil fuels with biomass may cause industrial plants to incur additional costs, since biomass fuels may require precombustion processing or contain greater impurities.
The extent to which biomass reduces greenhouse gas emissions is also challenged by several factors. First, biomass entails energy-intensive inputs for fertilizing, harvesting, processing, and transporting. Second, an expansion of biomass production would cause land-use changes directly and indirectly (through higher land prices) that would increase emissions, at least initially. By offsetting fossil fuel use over time, biomass consumption would gradually make up for emissions from land-use changes, but this compensation would take a long time if substantial carbon were lost up front. Sustainable global biomass production—with modest emissions from land-use changes—is estimated to be 100 EJ/year currently and 200 EJ/year in the long run (IEA 2020c). Although this range includes the current energy supply for industrial heat, there are competing energy uses for biomass, notably as a transportation fuel and for power generation.
3.2.3.3. CCUS
Rather than switch to a low-carbon fuel, an industrial facility could capture emissions from fossil fuel combustion to decarbonize its production. CCUS involves separating CO2 from other exhaust gases, transporting it from the industrial facility, and then either injecting it into a geological reservoir or utilizing it (e.g., for enhanced oil recovery). CO2 can be separated using various processes, but postcombustion capture—in which it is separated from flue gases with solvents or adsorbents—is likely the most suitable to industrial facilities. As discussed in Section 3.1, the other methods of CO2 separation are oxy-combustion (fuel combustion in pure oxygen rather than air) and precombustion capture, which produces blue hydrogen. Both of these methods would require the industrial facility to redesign its heat supply, and precombustion capture entails significant energy conversion losses. Once separated, CO2 is transported by pipeline to its end location, whether geological storage or place of utilization.
The advantage of CCUS is its potential to capture emissions throughout the industrial sector. Postcombustion carbon capture does not impose a particular fuel or heating method on the industrial facility; it can be introduced as an “end-of-pipe” solution to almost any combustion process (Sandalow et al. 2019). This feature also allows CCUS to be well-matched to plant retrofits, which would be significant for reducing emissions in the near term, given the long lifetimes of industrial facilities. Finally, CCUS has extensive potential to reduce feedstock emissions, such as the CO2 generated from limestone calcination in the production of cement. However, CCUS has its own limitations, most importantly the proximity of geological storage. CO2 capture, storage, and pipeline infrastructure create economies of scale for CCUS at the plant and regional scales. Thus, CCUS may not be cost-effective at smaller or geographically dispersed facilities. Other than CO2 transportation and storage, the cost of CCUS will depend, inversely, on the concentration of CO2 in the industrial exhaust gases.
CCUS is a compelling alternative for industrial decarbonization in several cases. The first is in processes, such as cement and blast furnace steel production, where both fossil fuel combustion and feedstock reactions generate substantial CO2 emissions. Second, compared with other low-carbon options, CCUS often has a relative advantage for existing versus new industrial facilities (McKinsey 2018). Third, in processes that are ill suited to fuel switching, CCUS may be the only feasible option. And fourth, where carbon capture facilities can be co-located with plants utilizing the CO2 in products or processes, CCUS costs can come way down. This fact underlies the motivation for building CCUS “hubs” in industrial areas. The nascent Houston-area hub is attractive because of its existing CO2 pipeline infrastructure and nearby oil wells where the CO2 can be used for enhanced oil recovery.
3.2.4. Hydrogen for Industrial Heat
In comparison with the three other low-carbon heat options, hydrogen has some significant advantages. The combustion of hydrogen provides heat that, in general, meets the technical requirements of industry. Hydrogen burns at a high temperature (2,100 degrees C) and delivers high heat flux. The heat will be reliable if hydrogen supply is continuous, and as a combustion process, the heat availability is sufficient for most applications. In ranking low-carbon industrial heat alternatives, Friedmann et al. (2019) find that hydrogen is second only to biofuel and biogas in its feasibility to substitute for fossil fuels. If the current fuel is natural gas, substitution with hydrogen may entail only minor plant modifications, and a certain amount of hydrogen can be blended with natural gas without modifications. The blending limit of hydrogen in natural gas depends on the application, but this limit has not yet been confirmed for many industrial applications (IEA 2019). Aside from its technical properties, blue and green hydrogen have low and nearly zero CO2 emissions, respectively.
Although hydrogen-based heat appears generally suitable, industrial processes and equipment may have specific requirements that impede switching from fossil fuels. If the current fuel is integrated into the process, as is the case for coal in blast furnace steel production, substitution with heat from hydrogen would be particularly complex. Even switching to hydrogen from natural gas heat could be costly in certain processes. Compared with natural gas, IEA (2019) notes that hydrogen (i) has a higher combustion velocity and nonluminous flame (potentially requiring censors, controls, or added gases), (ii) has lower radiation heat transfer (potentially requiring added material for heat transport and new burners), and (iii) may cause corrosion or brittleness in some metals (potentially requiring protective coatings).
If industrial requirements can be satisfied at reasonable cost, low-carbon hydrogen has considerable potential to lower emissions from industrial heat. Replacing natural gas and coal with hydrogen combustion would reduce emissions by 7 kgCO2/kgH2 and 12 kgCO2/kgH2, respectively (Blank and Molloy 2020). Because blue hydrogen production (from natural gas with 90 percent capture) entails emissions of 1 kgCO2/kgH2, net emissions reduction would be 86 to 92 percent, and green hydrogen would eliminate virtually all heat-related emissions. The major considerations are (i) whether decarbonized hydrogen is more cost-effective than the alternative methods of low-carbon industrial heat, and (ii) whether the SCC exceeds the additional cost of heat from decarbonized hydrogen versus fossil fuels.
We next compare hydrogen with the other low-carbon heat options to determine where hydrogen is likely to be most efficient. We then assess the cost-effectiveness of decarbonized hydrogen as a substitute for natural gas or coal.
Biofuel and biogas are most similar to hydrogen as feasible substitutes for fossil fuels, but these forms of biomass involve significant processing, and thus costs. For example, the heating prices of biofuels (biodiesel and ethanol) are almost twice the heating price of wood pellets, which are less useful in high-temperature industrial processes (Friedmann et al. 2019). Additionally, biomass fuels generally have a greater carbon footprint than decarbonized hydrogen, and there may be more valuable end uses for sustainable biomass (e.g., in heavy transportation).
Like biomass, grid electricity may have substantial associated CO2 emissions. Power that is zero-carbon may be intermittent, and even if it is continuous, electricity is less usable for high-temperature industrial heating. With these considerations, green hydrogen can be seen as a method of converting potentially intermittent zero-carbon power to a medium that can be stored relatively cheaply and used relatively effectively for industrial heat. The choice of green hydrogen versus zero-carbon electricity depends on whether the benefits of cheap storage and combustion heating outweigh the conversion cost from electric power to hydrogen.
Just as green hydrogen compares to zero-carbon electricity, blue hydrogen can be evaluated against industrial CCUS. This is not to imply that green hydrogen could not compete with CCUS or blue hydrogen with zero-carbon power. These comparisons are intended to provide an ordering of low-carbon heat alternatives based on conversion costs, capital requirements, and heating qualities. Both options would require infrastructure for the industrial facility: hydrogen pipelines for blue hydrogen, and CO2 pipelines for CCUS. In applications where fuel switching from natural gas is inexpensive, blue hydrogen could entail less capital investment than CCUS. If there are significant plant economies of scale with CCUS, smaller facilities may find blue hydrogen more economical. The cost advantage for CCUS is that it allows for postcombustion carbon capture, which incurs lower energy conversion losses than the precombustion capture for blue hydrogen. Beyond heat supply, CCUS also has the distinctive capacity to capture feedstock emissions.
In general, the largest opportunity for hydrogen is in high-temperature applications (for which electricity and solid biomass are less suited) that involve only minor plant modifications for fuel switching (giving it an advantage over CCUS). In its 2050 roadmap, Hydrogen Council (2017) finds that 12 percent of industrial heating could be supplied by hydrogen, including 23 percent of high-temperature heat, 8 percent of medium-temperature heat, and 4 percent of low-temperature heat. Hydrogen Council (2017) is a study of likely hydrogen adoption based on industry perspectives assuming the increase in global temperature is limited to 2 degrees C.
Next, we assess the market size and cost estimates for hydrogen in providing heat for cement, aluminum, glass, and pulp and paper manufacturing. Together, these sectors account for a large majority of high-temperature heat demand besides the integrated feedstock and fuel processes discussed in Section 3.3.
3.2.5. Sectors for High-Temperature Industrial Heat
3.2.5.1. Cement
Approximately 70 percent of global high-temperature heat is used in the steel and chemicals sectors, and of the remaining 30 percent, cement accounts for a majority (IEA 2019). Including all grades of heat, cement production consumes 11 EJ per year, more than 8 percent of global industrial heat (Hydrogen Council 2017). Since roughly 85 percent of heat for cement production is high temperature, cement offers a large decarbonization opportunity for which hydrogen is well suited.
The process of cement manufacturing involves several steps: (i) the input of limestone and other minerals, (ii) grinding and preheating, (iii) limestone calcination at 900 degrees C, (iv) clinker production in a kiln at 1,450 degrees C, and (v) cooling, blending, and storing the cement. In 2014, the heat for global cement production was supplied by fuels in the following proportions: coal (70 percent), oil and natural gas (24 percent), and waste and biomass (6 percent) (Sandalow et al. 2019). Emissions from cement production are approximately 3 GtCO2/year (equal to 7 percent of the global total), but only 40 percent of cement emissions are from fossil fuel combustion (McKinsey 2018). The remaining 60 percent of cement emissions are from the calcination of limestone, which generates CO2 along with the calcium carbonate for clinker.
With appropriate equipment modifications, decarbonized hydrogen could substitute for fossil fuels to reduce the heating emissions in cement production. BNEF (2020) finds that zero-carbon hydrogen at a delivered price of $1.00/kgH2 would be a cost-effective source of heat for cement production if there were a carbon price of $60/tCO2. Hydrogen Council (2020) has a similar estimate, albeit slightly more favorable to hydrogen. It finds that hydrogen at $1.10/kgH2 would be a cost-effective heat source for cement production, versus an alternative of petroleum coke at $3.50/MMBtu, if there were a carbon price of $50/tCO2. Because most cement emissions are from process CO2 rather than heating, CCUS would appear a more effective option than fuel switching to hydrogen. However, although CO2 from calcination is almost pure (allowing for low-cost carbon capture), the concentration of CO2 in combustion gases is low (increasing the cost of carbon capture), thereby reducing the efficiency of applying CCUS to the combined stream of process and flue gases. Technology under development to separate the process gases from the combustion gases would enable low-cost CCUS for calcination and a low-carbon fuel, like hydrogen, for combustion (Project LEILAC 2020). With this method, both CCUS and hydrogen could be applied to cement production to achieve deep reductions in cement emissions.
3.2.5.2. Aluminum
After steel, chemicals, and cement, the production of aluminum is the largest global consumer of high-temperature industrial heat, using about 3 EJ per year (Hydrogen Council 2017). In primary production, bauxite ore is converted to aluminum oxide and then to aluminum; in secondary production (recycling), aluminum scrap is melted and recast. Primary production is far more energy intensive, but the energy used is predominantly in the form of electricity. Aluminum smelting (the conversion of aluminum oxide to aluminum) involves electrolysis to separate oxygen from aluminum. Electricity represents 20 to 40 percent of the cost of producing primary aluminum (see https://www.aluminum.org/industries/production/primary-production).
The more promising role for hydrogen is in secondary production, which accounts for more than 80 percent of US aluminum production (EIA 2017a). In secondary production, furnaces—which are typically fired by natural gas—heat aluminum scrap to around 750 degrees C. Gas-fired furnaces could be modified to burn hydrogen instead. BNEF (2020) estimates that substituting zero-carbon hydrogen at a delivered price of $1.00/kgH2 in aluminum recycling would be cost-effective with a carbon price of $90/tCO2.
3.2.5.3. Glass
The production of glass accounts for about 1 percent of US industrial energy use (EIA 2013). Although its energy usage is comparatively minor, the energy intensity and temperature requirements of glass manufacturing may favor the utilization of hydrogen. To form glass, raw materials are melted at temperatures above 1,500 degrees C in furnaces, the majority of which are fired by natural gas in the United States (EIA 2013). For flat and container glass, the two largest subsectors by energy use, fuel combustion generates 70 percent of production emissions (Friedmann et al. 2019). As in the aluminum sector, glass furnaces could be retrofitted to use hydrogen instead of natural gas— which would also be cost-effective with a carbon price of $90/tCO2 and zero-carbon hydrogen delivered at $1.00/kgH2 (BNEF 2020).
3.2.5.4. Pulp and Paper
The global pulp and paper sector consumes approximately 6 EJ of energy per year, equal to that of the aluminum sector (Hydrogen Council 2017). However, about 80 percent of energy consumption is for low- and medium-temperature heat, for which hydrogen is generally less cost-effective. The 1 EJ per year of high-temperature heat for the global pulp and paper sector nonetheless presents a significant opportunity for hydrogen in uses where biomass is not suitable. A particular high-temperature application that has been identified for hydrogen is to supply the high-purity flame required to flash-dry paper (Hydrogen Council 2017).
3.2.6. Hydrogen for Industrial Heat: Conclusions
If delivered hydrogen costs fall to $1.00/kgH2, a carbon price of $60/tCO2 to $90/tCO2 would enable decarbonized hydrogen to displace substantial CO2 emissions from industrial heating, as illustrated in Figure 17. Hydrogen substitution for fossil fuels in the combined production of cement, aluminum, and glass could cut CO2 emissions by almost 800 MtCO2/year (BNEF 2020), or more than 2 percent of annual global emissions (Friedlingstein et al. 2019). Hydrogen Council (2017) envisions that decarbonized hydrogen could decrease industrial heating emissions by 1,200 MtCO2/year by 2050, so cement, aluminum, and glass manufacturing would likely account for a majority of the CO2 reductions.
Figure 17. CO2 Price and Abatement Potential for H2, by Industry
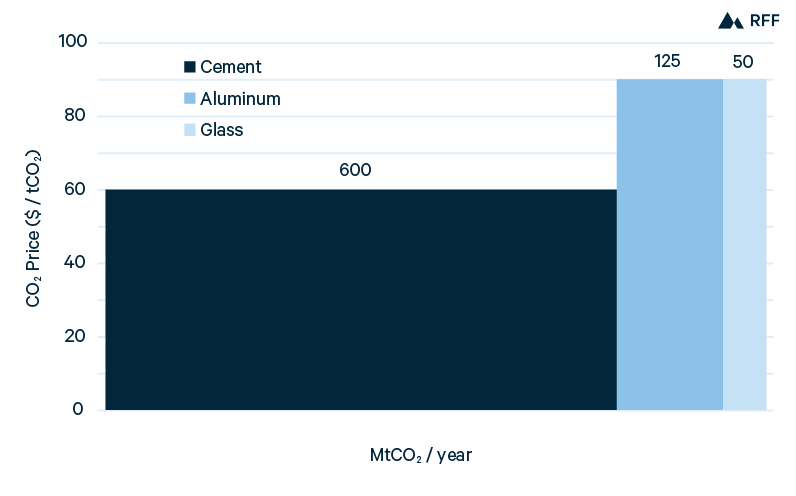
The CO2 prices that would enable zero-carbon hydrogen of $1.00/kgH2 to be cost-effective—$60/tCO2 for cement and $90/tCO2 for aluminum and glass—correspond roughly to the SCC in 2030 and 2050 (IWG 2016), respectively. Although the assumptions in BNEF (2020) are not specified, that cement kilns are typically fired with coal whereas aluminum and glass furnaces are generally fired with natural gas is likely significant. Because the heating cost of hydrogen exceeds that of natural gas or coal, the cost-effectiveness of decarbonized hydrogen depends critically on the carbon intensity of the fuel it would replace. Hydrogen displaces 7 kgCO2/kgH2 from natural gas and 12 kgCO2/kgH2 from coal combustion (Blank and Molloy 2020), so an incentive equal to $60/tCO2 would provide value of $0.42/kgH2 and $0.72/kgH2 for hydrogen to replace natural gas and coal, respectively. There are also the potential benefits of reducing noncombustion emissions from natural gas and coal, as discussed in Section 3.1 for the power sector. For further discussion, see NREL (2012, Appendix C-1) and Rhodes et al. (2016). With an incentive of $84/tCO2 (the 2050 SCC), the value for hydrogen would increase to $1.00/kgH2 for coal replacement, implying that hydrogen may be cost-effective in cement with delivered costs of $1.20/kgH2 to $1.30/kgH2.
As with hydrogen in power generation, the cost reduction required for hydrogen to supply industrial heat implies greater potential for green versus blue hydrogen. An external benefit of green hydrogen in the industrial sector is that even though it does not serve as energy storage (as it does in the electricity sector), it could provide additional demand for otherwise low-priced hours of solar and wind energy, thereby increasing the revenues and thus installations of solar and wind plants. Attaining a delivered cost of $1.20/kgH2 (or less) necessitates that hydrogen production costs fall below $1.00/kgH2, after accounting for the costs of hydrogen storage and transportation. Sufficient reductions in electrolyzer and power prices would create a pathway to green hydrogen production costs below $1.00/kgH2. The maturity and current scale of SMR suggest that blue hydrogen, with the addition of costs for carbon capture, would be challenged to meet that benchmark. Blue hydrogen could be produced at the industrial site, thereby avoiding the costs of hydrogen storage and transportation, but applying CCUS to fossil fuel combustion (postcombustion carbon capture) is generally more efficient than producing and burning blue hydrogen.
The use of green hydrogen as a source of almost zero-carbon industrial heat holds promise, but it could take a long time to become competitive: industry, intergovernmental, and research organizations consider 2050 a time when production costs could fall below $1.00/kgH2 (Snam 2019; IRENA 2019; BNEF 2020). In addition, hydrogen storage costs need to decline, and the network of hydrogen pipelines needs to expand to reach prospective industrial consumers. Lastly, if a hydrogen incentive reflects the rising SCC over time, the cost-effectiveness of hydrogen will improve as fossil fuel emissions become more costly.
3.3. Hydrogen for Feedstock and Integrated Uses
3.3.1. Iron and Steel Production
3.3.1.1. Overview
With the vast quantity of steel production and the high carbon intensity of the process, reducing emissions from the iron and steel sector is a significant component of economy-wide decarbonization. Iron and steel production emits nearly 3 GtCO2/year (about 7 percent of global emissions), and coal accounts for more than 75 percent of the energy consumed (McKinsey 2018; Sandalow et al. 2019).
The sector is composed of primary steel production, where iron ore is converted to steel, and secondary steel production, in which scrap steel is reprocessed. Steel production can be further separated by process technology. A large majority of primary production results from the blast furnace–basic oxygen furnace (BF-BOF) process. A much smaller contribution of primary steel production is from the direct reduction of iron (DRI), subsequently processed into steel in an electric arc furnace (EAF). Table 1 shows the amounts and proportions of steel produced by method. US and global steel production are similar in that BF-BOF steelmaking accounts for more than 90 percent of primary steel production, and EAF is the predominant method for secondary production. The significant difference between US and global steelmaking is that 70 percent of US steel is from secondary production, nearly the opposite of the global proportion.
Table 1. US and Global Steel Production, by Method
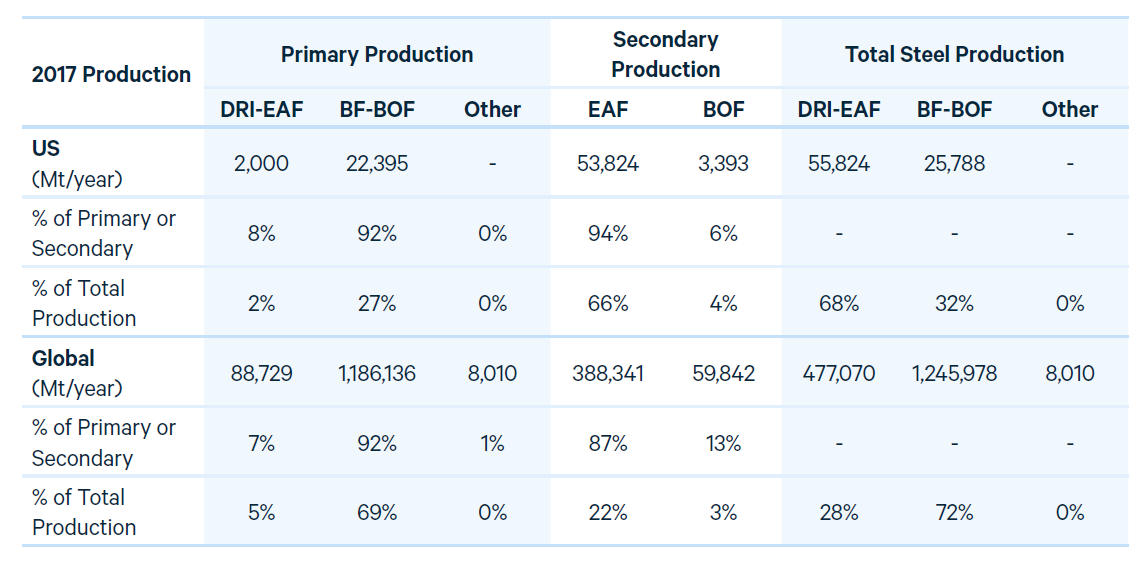
It is in the DRI-EAF process of primary steelmaking where hydrogen is currently used and where decarbonized hydrogen has potential for future contribution. Notably, in current usage (and proposed future designs), the role of hydrogen is as a reducing agent for iron, rather than a heating source for the production processes.
To assess the potential for low-carbon hydrogen in steel production, we discuss the following aspects. First, we review the BF-BOF and DRI-EAF processes, emissions, and pathways to decarbonization. Second, we evaluate the cost-effectiveness of low-carbon hydrogen in steel production, both in relation to other low-emitting methods as well as to the predominant high-emitting method. Third, we consider the prospects of green versus blue hydrogen in steel production. Fourth, we calculate the incentive for low-carbon hydrogen based on its displacement of emissions in steelmaking and the SCC. Finally, we conclude with a summary of the potential demand for low-carbon hydrogen in DRI-EAF production and consider how an incentive could support the transition to decarbonized steelmaking.
3.3.1.2. BF-BOF Process
The BF-BOF process involves the conversion of iron ore to high-carbon crude iron (also known as pig iron) and subsequently the processing of crude iron to form low-carbon steel. Sinter (compacted iron ore), additional iron ore, coke (high-carbon coal, purged of volatile compounds), and limestone enter the blast furnace, where the iron ore is reduced by carbon monoxide to produce iron and CO2 (Sandalow et al. 2019). In chemical terms, the BF process is 3CO + Fe2O3 → 2Fe + 3CO2, with carbon monoxide as the reducing agent for iron. The resulting molten crude iron (often combined with some scrap steel) is transferred to a BOF, where oxygen reacts with some of the carbon in the crude iron to yield low-carbon steel and further CO2. Total CO2 emissions from the BF-BOF steelmaking route are high—with an average of 1.73 tCO2/ton steel (IEA 2019)—because the sintering, coking, and blast furnace processes are all carbon intensive.
Decarbonizing the BF-BOF process is challenged by the role of coal, which provides heat, carbon monoxide, and physical structure for the reaction within the blast furnace. Consequently, complete fuel switching to hydrogen is not feasible, and any role for decarbonized hydrogen would be limited to reducing the amount of coke used. Given the technical limitations of fuel switching, efforts to lower the emissions from BF-BOF steelmaking have focused on CCUS. Sandalow et al. (2019) reviews three CCUS methods for BF-BOF steelmaking (one oxy-combustion and two postcombustion processes). The three methods would lower emissions by 47 to 60 percent at avoided costs of $57/tCO2 to $81/tCO2, with avoided costs rising with increased emissions reduction. To achieve further CO2 reductions in coal-based steelmaking, the HIsarna process eliminates the coking and sintering steps. Currently in demonstration phase, HIsarna could reduce CO2 emissions by 80 to 90 percent, if integrated with CCUS (IEA 2019).
3.3.1.3. DRI-EAF Process and Hydrogen Usage
As with the BF-BOF route, DRI-EAF steelmaking converts iron ore to steel, but the DRI-EAF process differs substantially and uses electricity and, most often, natural gas. The typical DRI process starts with natural gas reforming to produce carbon monoxide and hydrogen, which is the first step of producing pure hydrogen from natural gas. However, the second step of SMR hydrogen production—the conversion of carbon monoxide and water to carbon dioxide and more hydrogen—would be unnecessary because both carbon monoxide and hydrogen are used to reduce iron ore. In chemical terms, the DRI process is 3CO + 3H2 + 2Fe2O3 → 4Fe + 3CO2 + 3H2O, showing the role of both carbon monoxide and hydrogen as reducing agents for iron. The reduction of iron ore occurs in a shaft furnace heated by natural gas, and the product is in a solid state (hence, direct reduced iron). Specifically, this describes the MIDREX process, which accounts for two-thirds of global DRI production (Sandalow et al. 2019). The iron is subsequently combined with scrap steel and melted in an EAF, which removes impurities in the form of slag and produces molten steel.
Because of the wide range in carbon intensities of input energy and feedstock, CO2 emissions from the DRI-EAF route are more variable than emissions from BF-BOF steelmaking. Natural gas, as described above, is used in three-quarters of DRI production, and coal accounts for the remainder (IEA 2019). In coal-based DRI production (particularly common in India), coal is gasified—the first step of brown hydrogen production—to generate the gases to reduce iron ore. In the EAF stage, emissions depend on the carbon intensity of the electricity consumed. For natural gas–based DRI-EAF steelmaking with the average carbon intensity of US electricity, CO2 emissions would total 0.86 tCO2/ton steel, 50 percent of the average emissions from the BF-BOF route (EIA 2020e; IEA 2019).
Decarbonized hydrogen can lower the emissions from the DRI-EAF process by substituting for the carbon monoxide and hydrogen mixture—from natural gas reforming or coal gasification—that is used to reduce iron ore. The HYBRIT project, currently in its pilot phase, would use 100 percent hydrogen as the reductant in its production process with minimal fossil fuels and CO2 emissions (HYBRIT 2018). Another low-carbon route for DRI-EAF steelmaking, which is already in commercial operation, is applying CCUS to the natural gas–based DRI-EAF process. The Al Reyadah project in the UAE captures CO2 from the DRI reactor, with the CO2 delivered for use in EOR (Sakaria 2017).
3.3.1.4. Cost-Effectiveness of H2 DRI-EAF
In comparison with the power sector and industrial heat applications discussed in Sections 3.1 and 3.2, hydrogen in steelmaking is generally cost-effective at a higher price of H2 and a lower price of CO2. As shown in Figure 18, the average breakeven price for hydrogen against alternative methods of steel production (excluding the more expensive option of BF-BOF with CCUS) is between $1.30/kgH2 and $1.40/kgH2.
Figure 18. Breakeven Cost for H2 in DRI-EAF versus Competing Steelmaking Methods
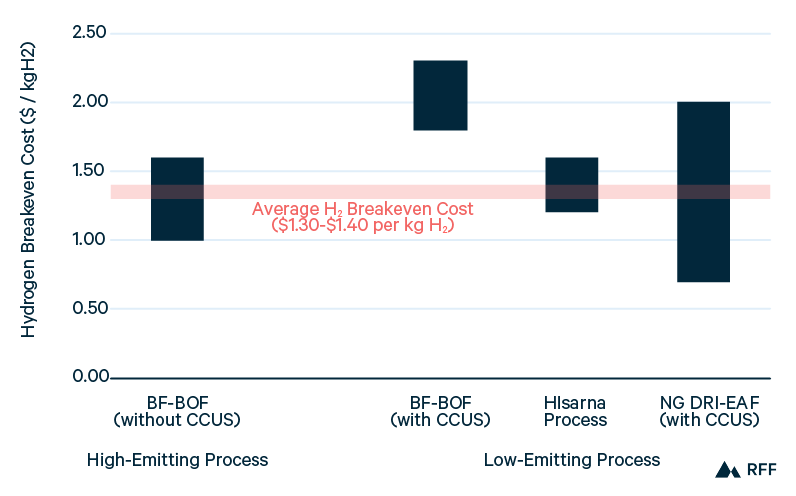
Comparing H2 DRI-EAF with individual alternatives, BNEF (2020) and Hydrogen Council (2020) find that hydrogen would be cost-effective against the BF-BOF process at hydrogen prices between $1.00/kgH2 and $1.60/kgH2 and a carbon price of $50/tCO2. Therefore, H2 DRI-EAF could be competitive with the predominant steelmaking method well before 2050, given projected hydrogen costs from Figure 11 and the SCC, which rises from $61/tCO2 in 2030 to $84/tCO2 in 2050 (in 2019$).
Of course, H2 DRI-EAF is not the only low-carbon production process for steel. Hydrogen Council (2020) estimates that H2 DRI-EAF would break even with BF-BOF with CCUS at hydrogen prices between $1.80/kgH2 and $2.30/kgH2, and with the HIsarna process (with 90 percent capture) at hydrogen prices between $1.20/kgH2 and $1.60/kgH2. IEA (2019) notes that the HIsarna process may have lower production costs—requiring a greater reduction in hydrogen prices for H2 DRI-EAF to be cost-effective—but cautions that HIsarna technology is still in a demonstration phase. IEA (2019) estimates a midpoint price of $1.35/kgH2 for H2 DRI-EAF to be cost-effective against natural gas–based DRI-EAF with CCUS but with a wide range of breakeven hydrogen prices—$0.70/kgH2 to $2.00/kgH2. IEA (2019) does not include a CO2 price in comparing the production costs of steelmaking methods, so residual emissions from natural gas–based DRI-EAF with CCUS would slightly improve the cost-effectiveness of H2 DRI-EAF, if it were lower emitting.
3.3.1.5. Green Versus Blue Hydrogen in Steel Production
With breakeven cost estimates centering on $1.30/kgH2 to $1.40/kgH2, green hydrogen could attain the necessary costs for steelmaking within a couple of decades. A further question is whether the higher breakeven cost for hydrogen in steel production—compared with power generation or industrial heating—suggests a greater opportunity for blue hydrogen in this sector. To assess the potential for blue hydrogen in the steel sector, we compare blue hydrogen in H2 DRI-EAF (i.e., capturing CO2 in the production of H2 for use in DRI) with natural gas–based DRI-EAF with CCUS (i.e., capturing CO2 in the DRI process).
Both blue hydrogen for use in H2 DRI-EAF and natural gas–based DRI-EAF with CCUS start with natural gas reforming; the two processes differ in whether the hydrogen is purified and at which stage the CO2 is captured. First, in blue hydrogen production, after natural gas is reformed to produce carbon monoxide and hydrogen, the carbon monoxide is reacted with water to consume carbon monoxide and increase the yield of hydrogen (CO + H2O → CO2 + H2). However, in the DRI process, carbon monoxide is a valuable reducing agent, so the second step taken in blue hydrogen production would be unnecessary and could be detrimental (if CO is a more effective reducing agent than H2). The other consideration is where the CO2 is most efficiently captured. Carbon capture costs vary inversely with CO2 purity; the DRI reactor yields a high concentration of CO2, so it seems unlikely that blue hydrogen would have much advantage here. For the Al Reyadah project, the DRI process yields 99 percent CO2 and water (Sakaria 2017), reducing the cost of CO2 separation. Therefore, these process considerations appear to favor natural gas–based DRI-EAF with CCUS over blue hydrogen for use in H2 DRI-EAF.
In contrast, green hydrogen has a production process that is decoupled from natural gas. With its greater capacity for cost reductions than blue hydrogen, green hydrogen is the likely source for low-carbon hydrogen in steel production.
3.3.1.6. Determining the Incentive for Decarbonized Hydrogen in Steelmaking Based on Emissions Reductions
To calculate the appropriate level of an incentive for hydrogen used in steel production, we consider how emissions from steelmaking would be reduced in transitioning from BF-BOF or NG DRI-EAF to H2 DRI-EAF. Producing one ton of steel would require an average of 58 kgH2 in the H2 DRI-EAF process (IEA 2019). With emissions of 1,730 kgCO2/ton steel and 864 kgCO2/ton steel in the BF-BOF and NG DRI-EAF processes, respectively, each kg of zero-carbon hydrogen might appear to offset 30 kgCO2 and 15 kgCO2 in steelmaking. However, as discussed below, such a credit to hydrogen would overstate its role in reducing emissions from steel production. Accordingly, next we assess the contribution of hydrogen to the decarbonization of steelmaking to determine the appropriate incentive for hydrogen.
Table 2. Energy and Emissions Intensities for BF-BOF and DRI-EAF Steelmaking Processes
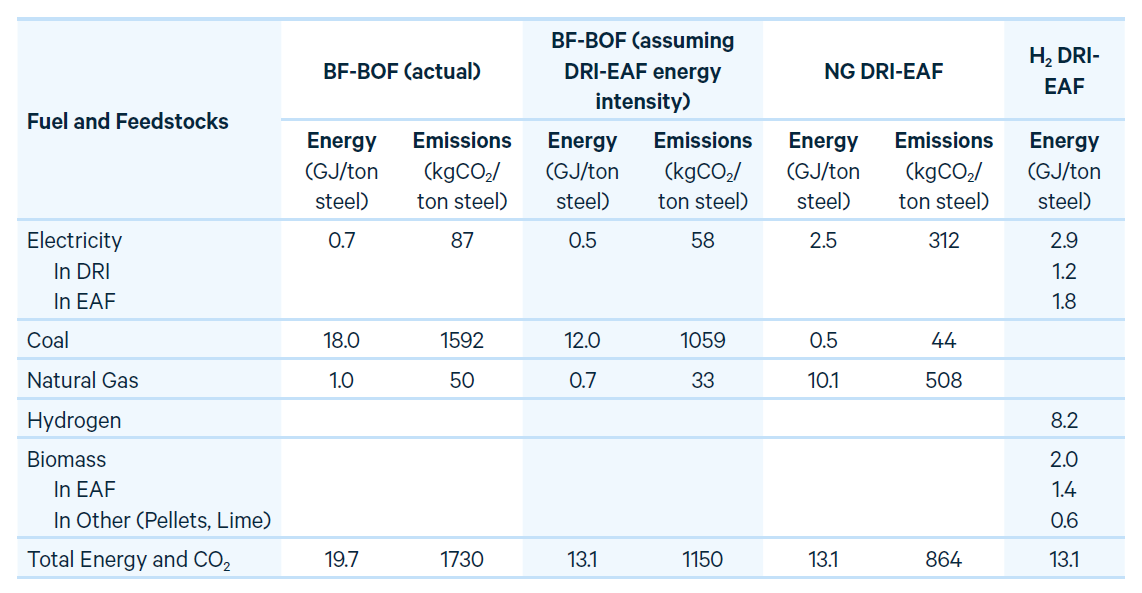
Table 2 disaggregates the energy intensities of the BF-BOF and DRI-EAF processes by fuel and feedstock sources. For BF-BOF and NG DRI-EAF, fuel and feedstock consumption is converted to emissions with the CO2 content of natural gas and metallurgical coal as well as the average emissions of power from the US grid. Furthermore, to understand how the difference in energy efficiency between BF-BOF and DRI-EAF processes affects emissions, Table 2 also shows what CO2 emissions would be if BF-BOF had the same energy intensity as DRI-EAF.
Figure 19. Emissions Reductions by Feedstock and Fuel Changes from NG DRI-EAF to H2 DRI-EAF Steelmaking
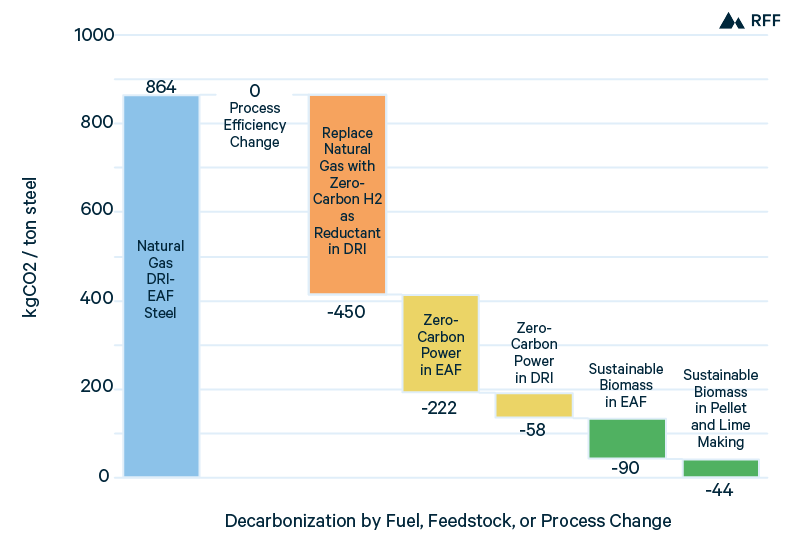
Figure 19 illustrates how emissions from NG DRI-EAF can be reduced by transitioning to H2 DRI-EAF (as represented by HYBRIT). The largest reduction in emissions (450 kgCO2/ton steel) comes from the substitution of zero-carbon hydrogen for natural gas as a reductant in DRI. Using zero-carbon power causes a total reduction of 280 kgCO2/ton steel, of which 222 kgCO2/ton steel is from substituting for average US grid power in the EAF and 58 kgCO2/ton steel is from replacing natural gas as a heat source in the DRI. Note that natural gas acts as a heat source as well as a reductant in DRI. Since hydrogen replaces natural gas only as a reductant, DRI requires an additional heat source, supplied by electricity in the HYBRIT design (HYBRIT 2018). Lastly, sustainable biomass reduces emissions of 134 kgCO2/ton steel in the HYBRIT design, both from use in the EAF and (in lesser quantities) for pellet and lime making. Besides heat, sustainable biomass could also provide a low-emitting source of carbon, which is a small but necessary component of steel. Steel is an alloy of iron, containing up to 2 percent carbon and smaller amounts of other elements (see https://www.worldsteel.org/about-steel.html). If all of these components (zero-carbon hydrogen, zero-carbon power, and sustainable biomass) are utilized, CO2 emissions from steelmaking will be minimal (HYBRIT 2018).
If an H2 DRI-EAF plant were to replace a BF-BOF plant, the potential for emissions reductions would be twice that of a change from NG DRI-EAF. Figure 20 separates emissions reductions (from BF-BOF to H2 DRI-EAF steelmaking) by changes in process, feedstock, and fuels. Notably, DRI-EAF is a more energy-efficient process than BF-BOF—consuming about one-third less energy—which would cause emissions to decline by 580 kgCO2/ton steel even if the feedstock and fuels did not change (as shown in Table 2). The replacement of zero-carbon hydrogen for coal as the reducing agent for iron would reduce emissions by 772 kgCO2/ton steel, which is greater than the corresponding amount (450 kgCO2/ton steel) in Figure 19 because of the higher emissions from coal versus natural gas. Assuming that the high-carbon fuels are replaced by zero-carbon power and sustainable biomass, emissions would be further reduced by 250 kgCO2/ton steel and 178 kgCO2/ton steel, respectively.
Figure 20. Emissions Reductions by Process, Feedstock, and Fuel Changes from BF-BOF to H2 DRI-EAF Steelmaking
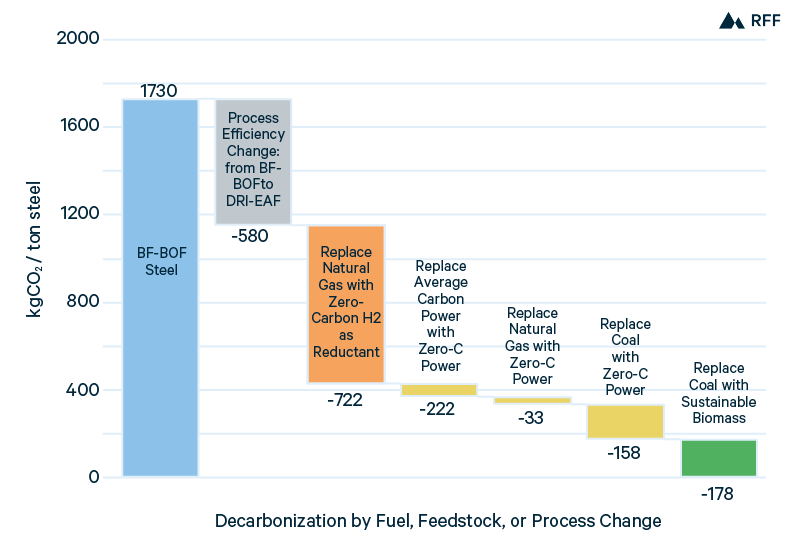
From Figures 19 and 20, we note that the use of decarbonized hydrogen reduces emissions of 450 kgCO2/ton steel (if it replaces natural gas in DRI-EAF) and by 772 kgCO2/ton steel (if it replaces coal in BF-BOF steelmaking). With an average of 58 kgH2 per ton of steel in the H2 DRI-EAF process (IEA 2019), the appropriate incentive for hydrogen in steelmaking would be based on 7.8 kgCO2/kgH2 or 13.4 kgCO2/kgH2, depending on whether it displaced natural gas (in DRI-EAF) or coal (in BF-BOF), respectively. Does not include any upstream emissions from natural gas or coal, as discussed in Section 3.1 for the power sector. For example, using the 2030 SCC of $61/tCO2, the hydrogen incentive would be $0.48/kgH2 (in displacing NG DRI-EAF) and $0.82/kgH2 (in displacing BF-BOF).
The incentives computed above would be appropriate for retrofitting an existing NG DRI-EAF plant or directly replacing either a NG DRI-EAF or a BF-BOF plant, but a greenfield H2 DRI-EAF plant would be more fairly measured against an average of current production methods. Of primary production (where hydrogen may be used), US steelmakers produced only 12 percent of steel from NG DRI-EAF in 2018, which suggests that the hydrogen incentive for greenfield H2 DRI-EAF plants should be closer to that for direct replacement of BF-BOF steel. US DRI-EAF primary steel production has increased in recent years, from 1,100 Mt in 2015 to 3,500 Mt in 2018 (World Steel Association 2019).
With the incentives based on 7.8 kgCO2/kgH2 for replacing natural gas in DRI-EAF and 13.4 kgCO2/kgH2 for replacing coal in BF-BOF steelmaking, hydrogen would receive an incentive based on 12.7 kgCO2/kgH2 for new construction of H2 DRI-EAF plants in the United States. Assuming the 2018 mix of 88 percent BF-BOF and 12 percent NG DRI-EAF for US primary steel production. A potential concern is whether a hydrogen credit, which would provide an incentive for primary steelmaking, would reduce the demand for steel recycling. To avoid such a distortion, zero-carbon power for EAFs should also be credited, as shown in Figure 19. Notably, this incentive would be almost twice that of a hydrogen incentive to replace natural gas for combustion in power generation or industrial heat. The implied greater social value of hydrogen in steelmaking is due both to the prevalence of coal in primary steelmaking and to the energy intensity of reducing iron ore.
3.3.1.7. H2 in Steel Production: Conclusions
Beyond being a more cost-effective use of green hydrogen than in the power and industrial heating sectors, steel production offers a large market for dedicated hydrogen. IEA (2019) estimates that transitioning to 100 percent of primary steel production from H2 DRI-EAF by 2050 could require up to 67 MtH2/year, nearly equal to the entire global supply of dedicated hydrogen in 2018.
However, increasing the use of hydrogen in steelmaking faces challenges beyond hydrogen production costs. Global steel production capacity has risen faster than demand over the past decade, leaving the current fleet of steel plants both relatively new and underutilized (Sandalow et al. 2019). With long operating lifetimes, construction of new steel plants may be limited for many years. Although some transition from NG DRI-EAF to H2 DRI-EAF could be accomplished with modest capital expenditures (e.g., blending pure H2 into the DRI process), DRI-EAF accounts for small proportions of US and global primary steel production. The larger transition to H2 DRI-EAF production would necessitate new construction of H2 DRI-EAF plants and the retirement of BF-BOF plants.
In the transition from a fleet of high-carbon to low-carbon steelmaking plants, an appropriately priced incentive for decarbonized hydrogen could prove pivotal. From Figure 20, the emissions reductions due to changing from BF-BOF to DRI-EAF processes suggest that an incentive for DRI-EAF equipment could also be warranted. Between 2030 and 2050, as projected costs for delivered hydrogen fall below $1.50/kgH2 (Figure 11) and the SCC rises from $61/tCO2 to $84/tCO2 (implying average hydrogen incentives above $0.75/kgH2), With an SCC of $61/tCO2 and a credit of 12.7 kgCO2/kgH2, the incentive would be $0.77/kgH2. Although the credit should decline with a decarbonizing steel sector, this will likely occur slowly (given the long plant lifetimes) and would be offset by a rising SCC. hydrogen would be highly competitive in steel production, with the potential for substantial demand and displaced emissions.
3.3.2. Oil Refining and Chemicals Production
3.3.2.1. Overview
The processes of oil refining and chemicals production account for more than 90 percent of current pure hydrogen consumption (Hydrogen Council 2020). With nearly all existing hydrogen production from natural gas or coal and only a minute proportion integrated with CCUS, there is a vast opportunity for reducing emissions from current hydrogen feedstocks, particularly in replacing merchant-supplied gray hydrogen with decarbonized hydrogen. For chemicals production, hydrogen demand is expected to increase by 50 percent from 2018 to 2050, so a decarbonized hydrogen supply would reduce emissions that would otherwise grow substantially. In refining, hydrogen demand would decrease with falling use of gasoline, diesel, and other oil products under a Paris Agreement scenario in IEA (2019), but the declines would be comparatively modest over the next decade. IEA (2019) projects that hydrogen demand for refining would fall by about 4 MtH2/year from 2018 to 2030 under the Paris Agreement, but hydrogen demand for chemicals would rise by 13 MtH2/year over the same period.
In chemicals production, hydrogen is used overwhelmingly in the synthesis of ammonia and methanol. In oil refining, hydrogen is utilized to remove impurities such as sulfur (by hydrotreatment) and to upgrade heavier to lighter hydrocarbons (by hydrocracking) (IEA 2019). Although oil refining, ammonia, and methanol differ in their supply and usage of hydrogen, as well as their emissions, grouping these end uses together is informative for two reasons. First, unlike power generation, industrial heat, or a large majority of steel production, the contemporary processes of oil refining and ammonia and methanol production utilize hydrogen. Second, decarbonizing the production of hydrogen is the only evident route to reducing emissions associated with hydrogen feedstocks. With a vast industrial base and lacking alternatives for lowering feedstock emissions, oil refining and chemicals production provide the greatest opportunity for near-term emissions reductions through decarbonized hydrogen.
To evaluate the potential for decarbonized hydrogen in oil refining and chemicals production, we review the current uses and emissions associated with hydrogen in these sectors. We then assess the cost-effectiveness of decarbonized hydrogen by application—whether the additional cost of supplying decarbonized hydrogen is worth its climate benefit. Based on their cost-effectiveness, we consider how and when blue and green hydrogen may be utilized. Lastly, we conclude with a summary of the benefits of decarbonized hydrogen by application and estimates of when decarbonized hydrogen may break even, if it receives appropriate incentives.
3.3.2.2. Oil Refining, Ammonia, and Methanol Processes
Oil refining is the largest current consumer of hydrogen, with global use of 38 MtH2/year and associated emissions that account for 20 percent of total refinery emissions. The global supply of hydrogen in refining is varied, with roughly 33 percent generated as a byproduct from other petrochemical processes, about 42 percent from on-site SMR or coal gasification, and the remaining 25 percent from merchant hydrogen supply (IEA 2019).
Hydrogen in US refining differs from typical global practices in several important ways. First, refining demand for hydrogen is determined, in part, by the requirements for hydrotreatment and hydrocracking. Aside from the requirements for hydrotreatment and hydrocracking, the demand for hydrogen in refining is determined by the demand for petroleum products, which are highly dependent on transportation sector end use. Because US crude oil is comparatively light and low in sulfur (EIA 2017b), less hydrogen is needed in US refineries. Consequently, a higher percentage of byproduct hydrogen (about 45 percent) fulfills the demand from US oil refining. Second, all of the US on-site hydrogen production (about 20 percent) involves SMR; coal gasification is not employed. Third, with developed hydrogen pipeline infrastructure on the Gulf Coast, merchant hydrogen is able to supply a greater proportion of refining demand, about 35 percent.
Therefore, even though US refinery demand for hydrogen is lower than the global average (per unit of refined petroleum product), the larger proportion of merchant hydrogen could allow for earlier decarbonization. Investment in decarbonized hydrogen by merchant providers could benefit the regional refining industry, thus requiring fewer on-site CCUS modifications to US refineries. On-site SMR would need to be decarbonized with CCUS at refineries or a shift to merchant supply of decarbonized hydrogen. Reducing emissions from byproduct hydrogen would involve decarbonizing the processes that generate that hydrogen, most likely with CCUS.
Ammonia production is the second-largest user of hydrogen, consuming 31 MtH2/year globally and 3.5 MtH2/year in North America (IEA 2019). As with oil refining, natural gas accounts for a majority of hydrogen used to produce ammonia globally and an overwhelming majority in North American production. Chemicals production generates substantial amounts of byproduct hydrogen, but much of this hydrogen stems from the processing of oil derivatives and is used in the refining sector. Consequently, the synthesis of ammonia generally entails dedicated hydrogen production. With the inputs of pure hydrogen along with nitrogen separated from air, ammonia is generated through the Haber-Bosch process, in which hydrogen and nitrogen react under high pressures and temperatures in the presence of catalysts.
The global production of ammonia accounts for approximately 500 MtCO2/year (1.5 percent of total CO2 emissions), of which the production of hydrogen is responsible for more than 50 percent (Sandalow et al. 2019). About 80 percent of ammonia is currently used in fertilizers (Hydrogen Council 2020), a proportion that may increase only modestly as countries aim to limit fertilizer use or increase its efficiency. Nevertheless, the remaining 20 percent of current ammonia demand—for other industrial applications—is expected to grow significantly, which could grow global hydrogen demand for ammonia to 44 MtH2/year by 2050 (IEA 2019). In the United States, substituting low-carbon hydrogen for gray hydrogen in ammonia synthesis represents a large opportunity for reducing carbon emissions.
Methanol production is the other large consumer of hydrogen in the chemical sector, using approximately 12 MtH2/year globally and 0.7 MtH2/year in North America (IEA 2019). As it is for ammonia, natural gas is the predominant global feedstock for methanol, especially so in North America; coal use is prevalent in Asia. However, in contrast to ammonia production, the hydrogen to produce methanol is not pure hydrogen but hydrogen mixed with carbon monoxide (as with DRI in steel production). The synthesis of methanol starts with the reforming of natural gas or gasification of coal to generate hydrogen and carbon monoxide, which are subsequently reacted to form methanol (CO + 2H2 → CH3OH).
Emissions from methanol production are about 100 MtCO2/year (Sandalow et al. 2019), one-fifth of the global emissions from ammonia. Beyond its lower global hydrogen usage compared with ammonia, methanol production does not entail the separation of hydrogen from carbon monoxide. Indeed, carbon is part of methanol—the period for which that carbon remains stored depends on the end use of methanol. The largest uses are in fuels (about 35 percent), adhesives (about 30 percent), and plastics (about 25 percent) (Hydrogen Council 2020). In fuel usage, the carbon in methanol is not stored for long; adhesives and plastics release carbon more slowly as they degrade. With the growth in adhesives and plastics demand, methanol production could nearly double by 2050 (IEA 2019). As with ammonia, the growth in methanol presents an opportunity for low-carbon hydrogen, but the need for carbon monoxide or CO2 (along with hydrogen) in methanol synthesis presents an additional challenge to decarbonizing methanol.
3.3.2.3. Cost-Effectiveness of Decarbonized H2 in Oil Refining, Ammonia, and Methanol
Assessing the cost-effectiveness of decarbonized hydrogen in oil refining and chemical production is simpler than in power generation, industrial heating, and steel production. Hydrogen is the current feedstock, and replacing it with a different, and low-carbon, feedstock (e.g., biomass) would be uneconomic (IEA 2019). With hydrogen as the incumbent feedstock and low-emitting alternatives impractical, decarbonized hydrogen compares only to high-emitting hydrogen. Therefore, the cost-effectiveness of decarbonized hydrogen from a social perspective depends on whether the additional cost to produce blue or green hydrogen (relative to gray hydrogen) is less than the cost of associated emissions in the processes of oil refining and chemicals production.
Figure 21. Marginal Cost of CO2 Reduction from Decarbonized Hydrogen, Relative to Gray Hydrogen
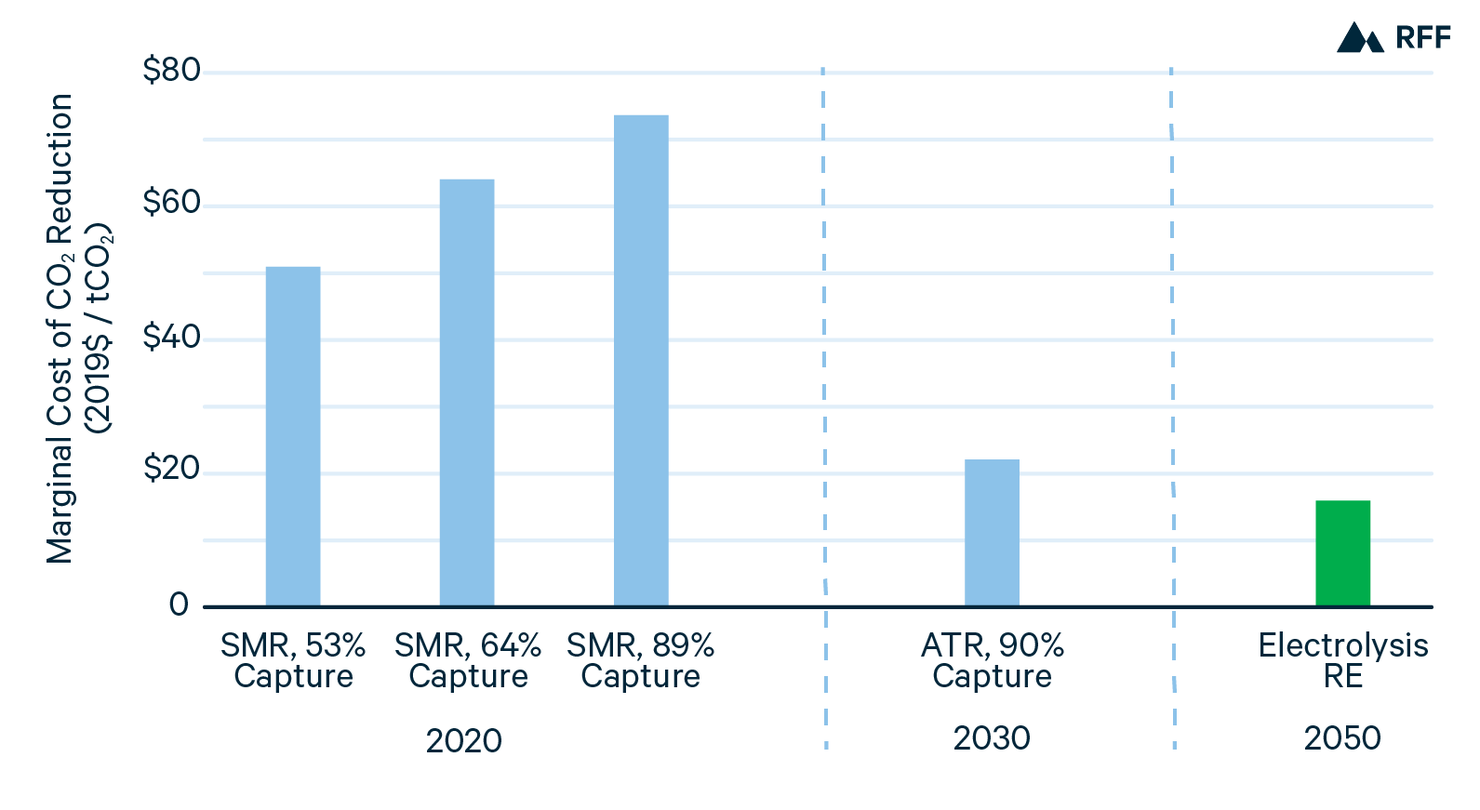
Figure 21 shows the cost of reducing emissions by substituting decarbonized hydrogen for gray hydrogen, which accounts for nearly all hydrogen in US ammonia production and the majority of hydrogen in US oil refining. The remainder of hydrogen for US oil refining is generated as a byproduct of other refining and petrochemical processes. In the near term, switching to blue hydrogen with about half the emissions of gray hydrogen would be cost-effective at a carbon price of $50/tCO2. As discussed in Section 2.3, the marginal costs of CO2 reduction for blue hydrogen rise with greater capture rates. However, by 2030, a change from SMR to ATR reactors (along with increased scale and technological improvements) may reduce the cost of decarbonized hydrogen such that the marginal cost of emissions reduction is only $22/tCO2. By 2050, declining costs of green hydrogen production (as well as of hydrogen transportation and storage) may make off-site green hydrogen cost-effective with a carbon price as low as $16/tCO2. Of course, such low marginal costs of emissions reduction in oil refining and ammonia production require that the costs of hydrogen production, storage, and transportation fall substantially from their current levels. Moreover, even with dramatic cost reductions, adoption of decarbonized hydrogen may be restrained by the slow turnover in capital equipment.
Although the marginal costs of emissions reduction in Figure 21 are applicable to dedicated hydrogen in oil refining and ammonia production, there is an exception in the production of urea. Urea accounts for about half of US nitrogen-based fertilizer consumption, and fertilizer accounts for nearly 90 percent of US ammonia consumption (USGS 2020a, 2020b). Urea synthesis is generally integrated into ammonia production, utilizing both ammonia as well as the process CO2 that is separated during hydrogen production. In other words, urea production represents a form of CCUS. However, the carbon in urea is not stored for long; CO2 is released into the atmosphere within a week of urea-based fertilizer application (McKinsey 2018).
If decarbonized hydrogen replaced SMR in ammonia produced for urea, the process would require an alternative source of CO2. Unless the substitute CO2 for urea synthesis is from a nonemitting source (e.g., direct air capture), the climate benefit of decarbonized hydrogen would be reduced—and in this case, the nonemitting source of CO2 should be credited for its emissions reduction. Whereas total emissions from gray hydrogen are 10 kgCO2/kgH2 (Figure 2), if the process emissions from hydrogen production are effectively reused in urea synthesis, the baseline for hydrogen emissions in urea may be around 5 kgCO2/kgH2. This is the amount of emissions that could be reduced by switching to zero-carbon hydrogen. The remaining emissions reduction would need to come from using a nonemitting source of CO2.
As discussed earlier, methanol has a similar concern as urea: carbon is retained during its production process but released with its usage (either immediately in fuels or over time in plastics and adhesives). Hydrogen Council (2020) estimates that methanol produced from natural gas retains about 70 percent of the carbon from production. Consequently, the emissions benefit of decarbonized hydrogen is substantially less in methanol than in oil refining or ammonia production (or, to a smaller extent, than in ammonia used for urea). The reduced benefit of decarbonized hydrogen in methanol is apparent in the lower sensitivity of high-emitting hydrogen to a carbon price.
For example, Hydrogen Council (2020) finds that a carbon price of $50/tCO2 would increase the breakeven price of decarbonized hydrogen in oil refining or ammonia production by $0.40/kgH2 to $0.50/kgH2 but only by $0.10/kgH2 to $0.20/kgH2 in methanol synthesis. The breakeven cost analyses of Hydrogen Council (2020) imply a benefit for decarbonized hydrogen of 8 kgCO2/kgH2 to 10 kgCO2/kgH2 in oil refining and ammonia production (except for urea) and of 2 kgCO2/kgH2 to 4 kgCO2/kgH2 in methanol.
3.3.2.4. Blue and Green H2 in Oil Refining, Ammonia, and Methanol
For oil refining, as well as ammonia production not used for urea, blue hydrogen is a viable near-term method for reducing emissions. Current hydrogen supply is through SMR, so the addition of CCUS would provide a transition to lower-carbon hydrogen. From Figure 21, blue hydrogen with 50 to 55 percent CO2 reduction (capturing the process stream emissions) is currently competitive with gray hydrogen, assuming an emissions credit near the global SCC. Although blue hydrogen with 90 percent CO2 reduction (capturing both combustion emissions and process stream emissions) is not yet cost-effective, it may become so for new facilities by 2030.
Green hydrogen, in contrast, is likely to require a longer time to be a competitive source of hydrogen for ammonia production and oil refining. Electrolyzer costs must decline and average input power prices will need to fall well below $30/MWh, which may not happen (in most locations) within this decade (IEA 2019). Blue hydrogen is thus the most promising decarbonization option in oil refining and ammonia production for the near future. For the production of methanol, as well as of ammonia for urea, decarbonized hydrogen costs will need to decline further to be cost-effective, given the lower emissions from these production processes. Blue hydrogen may not be able to attain such low costs, which would leave green hydrogen as the long-term decarbonization option for methanol and urea. For example, with an average benefit for decarbonized hydrogen of 3 kgCO2/kgH2 in methanol and a carbon price of $60/tCO2, the incentive for decarbonized hydrogen would be only $0.18/kgH2 (even less if the hydrogen was not zero-carbon). Reducing the cost of blue hydrogen to be within $0.20/kgH2 of the cost of gray hydrogen could prove difficult.
3.3.2.5. Decarbonized H2 in Oil Refining, Ammonia, and Methanol: Conclusions and Incentive Implications
This section describes both a massive near-term opportunity for decarbonized hydrogen—oil refineries and ammonia producers have already established blue hydrogen projects in the United States and internationally (Section 2.3, Figure 6)—and a long-term market in the production of methanol and urea. In both cases, decarbonized hydrogen is the only viable option for reducing associated feedstock emissions.
For oil refining and ammonia (not used for urea), decarbonized hydrogen would earn a carbon benefit of about 10 kgCO2/kgH2, the emissions intensity of gray hydrogen (Section 2.2, Figure 2). In urea and methanol production, the benefit of decarbonized hydrogen is diminished by the amount of carbon stored during the production process, which is often released as the urea and methanol are subsequently utilized. For urea and methanol, the benefits of decarbonized hydrogen may only be 5 kgCO2/kgH2 and 3 kgCO2/kgH2, respectively. For urea, the estimate of 5 kgCO2/kgH2 assumes that the CO2 from the process stream of hydrogen production is effectively used in urea synthesis. An incentive for decarbonized hydrogen would be the carbon benefit multiplied by the SCC (e.g., 5 kgCO2/kgH2 × $50/tCO2 = $0.25/kgH2).
In oil refining and ammonia production, the additional cost to produce lower-carbon hydrogen is already worthwhile for its climate benefit. Therefore, an incentive set to an appropriate level could currently make this process cost-effective. In methanol and urea production, the cost difference between low- and high-carbon hydrogen must narrow considerably for the climate benefits of decarbonized hydrogen to exceed the costs. However, with the cost reductions anticipated by 2050, decarbonized hydrogen could be efficiently used for methanol and urea production as well.
4. Tax Credit Considerations for Decarbonized Hydrogen
The above chapters have identified some options for spurring the penetration of decarbonized hydrogen into the US economy. But all need some help from government policy. Indeed, they deserve some help because of the social benefits they bring beyond their private benefits in the form of lowering GHG emissions. This chapter considers alternative ways in which this help could be delivered, settling on a 45Q-like credit program as a second-best alternative to a carbon pricing policy.
4.1. Why a Tax Credit?
4.1.1. Hydrogen Tax Credit
Of the policy options for promoting decarbonized hydrogen in the industrial sector, a tax credit has the advantages of being a well-trodden federal policy and having a decent track record (e.g., in stimulating renewables). The production tax credit (PTC) for wind and the investment tax credit (ITC) for solar have aided their growth from being negligible energy sources in 2000 to accounting for 10 percent of electricity generation today (EIA 2020a). More recently, the 45Q tax credit for carbon capture, utilization, and storage See https://uscode.house.gov/view.xhtml?req=(title:26%20section:45Q%20edition:prelim). has garnered the interest of federal policymakers to support a decarbonization pathway other than renewable energy, energy efficiency, and vehicle electrification. Tax subsidies are far more popular than taxes with policymakers, the public, and of course the regulated entities.
The use of 45Q for CCUS as a model for decarbonized hydrogen (DH2) works because of their similarities: both involve capital-intensive and generally large projects, technological uncertainty, and broader (often regional) infrastructure development needs (H2 pipelines and storage, CO2 pipelines and storage).
As general disadvantages, tax credits tend to be narrowly drawn (potentially excluding promising options) and are a drain on the Treasury. For hydrogen specifically, a tax credit for low-carbon hydrogen production may not fully address barriers to consumption. In contrast to wind and solar power, which substitute readily for fossil fuel power, low-carbon hydrogen may require investment by the end user to replace natural gas, for example. Therefore, a tax credit for hydrogen production may not be sufficient, which suggests the possible role for an investment incentive for the end user.
4.1.2. Carbon Price
An economy-wide price on CO2 would be the most efficient mechanism, but the near-term political likelihood appears to be very low. Additionally, there may be particular resistance to applying carbon pricing to the industrial sector, where global trading of goods could result in carbon leakage and domestic job losses.
4.1.3. Hydrogen Standard in the Industrial Sector
A common policy for encouraging low-carbon fuels is a renewable portfolio standard (RPS), See the following for a detailed explanation: https://www.eia.gov/energyexplained/renewable-sources/portfolio-standards.php a requirement that retail electricity suppliers purchase an increasing proportion of renewable power, passing on incremental costs to electricity consumers. However, an RPS applies to a single-commodity sector in which low-carbon fuel alternatives are limited—given the barriers to new hydroelectric and nuclear supply—and retail customers are mostly captive.
A hydrogen standard in the power sector would be straightforward to implement and potential carbon leakage and job losses would not be much of a concern. But, of course, meeting such a standard would entail very high costs and would therefore be politically challenging. Moreover, a grid with substantial existing nuclear or hydropower, for example, may need less long-term energy storage than a grid with mostly wind and solar.
Implementing this approach in the industrial sector, with so many end uses, would be far more cumbersome. In some of these end uses, other decarbonizing options, such as CCUS or electrification, may turn out to be cheaper. Lastly, final customers of industrial goods are not captive, so cost increases may lead to carbon leakage and job losses.
4.1.4. Contract for Difference (CfD)
A contract for difference is a hedging mechanism that guarantees a fixed price for a product (e.g., green hydrogen) over a specified duration. If the market price is beneath the fixed price, the green hydrogen producer receives the difference; if the market price exceeds the fixed price, the producer pays the difference.
CfDs have been used as an incentive for renewable power, notably in the United Kingdom. See: https://www.gov.uk/government/publications/contracts-for-difference/contract-for-difference#:~:text=The%20Contracts%20for%20Difference%20(%20CfD,supporting%20low%2Dcarbon%20electricity%20generation.&text=Successful%20developers%20of%20renewable%20projects,%2C%20a%20government%2Downed%20company.As a policy, CfDs are generally paired with auctions that set the fixed price (also known as the strike price), which projects then receive for a long duration (e.g., 15 years in the United Kingdom) to enable project financing.
Several concerns arise in using CfDs for hydrogen. First, although the auction ensures that the fixed price is competitive at the time of the auction, if production costs for green hydrogen decline over time, there is a risk of overprocuring comparatively expensive green hydrogen in the early years with contracts that last a long time. Similarly, solar contracts signed 10 years ago continue to receive a payment far in excess of current prices. Second, CfDs are simpler to implement when the spot market price for the product is transparent. We can say, with confidence, that hydrogen markets have not yet developed to the point of transparency: 85 percent of hydrogen is currently produced and consumed on-site, and the very limited hydrogen pipeline infrastructure constrains trading. Also, the current proportions of green and blue hydrogen supply are insignificant, so there are certainly no spot market prices for green or blue hydrogen.
4.1.5. Procurement
Governments at the federal state, and even local levels use their leverage as large buyers to stimulate markets by adding stipulations to commodity purchase rules. The justification for such interventions is that procurement policies can increase demand and bolster economies of scale and learning by doing in production, lowering costs (Krupnick 2020).
Procurements have disadvantages, of course. The government rules may be inflexible and lead to production and design decisions that are less efficient than if the manufacturers were simply responding to a price signal. And for all governments’ collective monopsony power, the relatively small size of each government’s procurement need for H2-related or embodied products and the difficulties of coordinating demands and rules across government entities suggest a relatively small and inefficient effect. Still, if governments are willing to shoulder the costs of decarbonized hydrogen products, there is nothing to preclude use of this approach with other, more market-based approaches.
Some people might think that government procurement of hydrogen in the power sector would be more feasible, given the larger role of government in power production versus industrial production: 16 percent of US electricity customers are served by a public-owned utility. See https://www.eia.gov/todayinenergy/detail.php?id=40913 However, most of those public utilities are small, municipally run organizations. Of the five federally owned utilities, four are hydropower and transmission operations (e.g., Bonneville Power Administration). The fifth federally owned utility (Tennessee Valley) has fossil fuel plants, but it is an independent corporation that does not receive taxpayer funding. See https://www.energy.gov/sites/prod/files/2017/02/f34/Appendix--Electricity%20System%20Overview.pdf
4.1.6. Clean Energy Standard (CES)
With carbon taxes off the table, a clean energy standard for the power sector is touted (Bartlett et al. 2019) as a “suitable alternative.” With this approach, generators are awarded clean energy credits in relation to their carbon intensity relative to a benchmark. That benchmark might be the intensity of an efficient natural gas generator. The credits earned can be traded, providing generators an incentive to reduce emissions intensity by using low- or zero-carbon fuels. Life-cycle emissions could be captured in the calculation of emissions intensity.
Thinking about hydrogen in this context, the capturing of life-cycle emissions would be vital, since hydrogen produced from average grid electricity would have significant CO2 emissions (Section 2.2). Consideration of emissions intensity would also apply to hydrogen mixed with natural gas and burned at the power plant. Up to a 30 percent hydrogen mixture is compatible with current natural gas generation technology (Section 3.1).
The main consideration with hydrogen used in the power sector, however, is storage. Here, if green hydrogen were credited for using clean energy in its production, it could not also be credited for generating clean power (a double-counting issue).
We could also imagine a CES applied to industrial sectors. See https://media.rff.org/documents/IB_20-06_v4.pdf. Hydrogen produced with CCUS (blue hydrogen) may be a better candidate for a CES in the industrial sector than in the power sector. An advantage of an industrial CES is that it allows for the choice of least-cost decarbonization options: hydrogen, CCUS, low-carbon electricity, low-carbon biomass, etc. A downside is its potential complexity (e.g., what is the decarbonization effect of grid electricity?), although even properly designed tax credits have the same issue. The larger concern is the political economy and carbon leakage issues of the industrial sector. A CES would raise the price of US industrial products. As a comparison, we note that RPS policies have raised electricity costs. See slide 43 for estimates of RPS price effects: https://eta-publications.lbl.gov/sites/default/files/rps_annual_status_update-2019_edition.pdf.
4.1.7. Investment Tax Credit for Hydrogen-Using Equipment
This policy would encourage firms to invest in equipment to use hydrogen that is currently more expensive than equivalent equipment using other fuels. To be reasonably efficient, the credit would be for the differential investment cost between the two types of equipment.
4.1.8. Summary of Incentive Options
Assuming that a carbon price that includes the industrial sector is unrealistic in the near term, a hydrogen tax credit would be the most practical and efficient incentive of those we have considered. Along with Congress’ familiarity and track record with tax credits, several factors favor a tax credit over a hydrogen standard, a CES standard in which hydrogen is an eligible fuel, or a CfD: (i) the numerous industrial applications of decarbonized hydrogen; (ii) its uncertain cost trajectory; (iii) the alternative pathways to industrial decarbonization; and (iv) political economy and carbon leakage concerns. In addition, as we discuss below, a tax credit may be more flexible than standards or a CfD when low-carbon hydrogen is not fully green but instead has a range of emissions intensities. And as noted, procurement policies would be complementary to whichever of the above policies are implemented.
Several issues are important to an effective tax credit: (i) its structure (either production- or investment-based); (ii) the assignment to the producer or user; (iii) coordination with the 45Q tax credit for CCUS; (iv) level of the credit; and (v) design issues, including the definition of eligible DH2 CO2 reductions, timing issues, duration, and monitoring, reporting and verification. The IRS rules for implementing 45Q are still in flux. See the following for a good summary: https://www.natlawreview.com/article/treasury-issues-proposedregulations-section-45q-tax-credit-carbon-capture. See the following for the authors’ comments on these rules: https://www.resourcesmag.org/common-resources/45qseries-comments-45q-tax-credit-carbon-capture-utilization-and-storage-ccus/.
4.2. Tax Credit Choices
4.2.1. Production- versus Investment-Based Credit
The solar and wind power sectors have benefited from both production and investment tax credits. The former stimulates the actual production of electricity with wind by lowering the production costs and, therefore, the price of such power. This happens directly in a competitive market, but if the resulting demand is large enough, it could also stimulate innovation and economies of scale to further drop prices.
An investment tax credit, in contrast, lowers the hurdle for companies that need to make big capital expenditures. This fits well with solar and wind power, where fuel costs are nonexistent and operating and maintenance costs are relatively minor; investment dollars therefore have a big bang for the buck in stimulating solar and wind projects. In addition, the full amount of the credit is received in the first year of the project, increasing its present value relative to a production tax credit, which is received as production occurs and which could be years (e.g., up to 10 years for the PTC) after the project is placed into service. Also, since the credit is a percentage of the capital cost, the ITC naturally declines as costs are reduced. Thus, less legislative involvement is required to set an incentive that is sufficiently generous in the beginning but not excessive as the technology matures.
What about using these tools to stimulate decarbonized hydrogen? We would argue that a production-based credit would promote low-carbon hydrogen production more efficiently than an investment-based tax credit. The latter skews behavior toward capital investments—supporting the purchase of electrolyzer equipment—and away from actually producing hydrogen. For the solar ITC, this is a minor concern; capital equipment accounts for more than 85 percent of solar power costs, and the equipment is utilized whenever the sun shines. Hydrogen production, on the other hand, is significantly affected by electrolyzer costs, power costs, and the choice of electrolyzer utilization (given the cost of power at the time). A production-based credit would not distort firms’ hydrogen production decisions.
For a hydrogen producer that faces fluctuating power costs (as grid electricity prices vary hourly and seasonally with supply and demand), the firm must weigh power prices against amortizing its capital costs to minimize the total cost of production. Using only the lowest-priced hours of electricity would lead to higher production costs due to low capital utilization; using the electrolyzer all the time would lead to higher production costs by incurring higher power prices.
An investment-based credit would reduce the effective capital cost for the hydrogen producer. Consequently, it would lessen the penalty for low capital utilization and cause the producer to underutilize the electrolyzer. In contrast, a production-based credit would not bias the producer from choosing the optimal balance between power prices and capital utilization. For an investment-based credit and a production-based credit of equal present values, the production-based credit would enable a lower subsidized cost of hydrogen. The greater the variability in power prices (and increasing solar on the grid tends to increase price variability This is an effect of the so-called duck curve for solar. See the following for a summary of this price effect in California: https://www.spglobal.com/marketintelligence/en/newsinsights/blog/caiso-electricity-forecast-brightens-for-wind-and-storage.), the greater the efficiency of a production-based credit compared with an investment-based credit for hydrogen.
4.2.2. Tax Credit to Producer versus User
The issue of whether a tax credit should be provided to the producer or user of hydrogen (or both) doesn’t come up with wind and solar tax credits because production of electricity goes right to the grid as carbon-free power. Producing decarbonized hydrogen, in contrast, does not reduce CO2 emissions until it displaces some other fuel or feedstock. A producer tax credit could easily be denominated in units of decarbonized hydrogen produced. A user credit would most uniformly be denominated in units of CO2 reduced through displacement. Alternatively, one could imagine a set of credits being denominated in physical units corresponding to the particular use being affected—say, in tons of cement—of kWhs of fossil-based electricity.
As noted, the consideration on the production side is the CO2 emissions of hydrogen production, and the consideration on the usage side is the CO2 displacement from decarbonized hydrogen of high-carbon fuels and feedstocks. Is it easier for the user to determine production-CO2 intensity or for the producer to determine use-CO2 displacement? As discussed below, we think the former would be the case, which would argue for a credit to the user.
On the production side, under either approach an issue is how to account for the way in which DH2 is produced and transported. Partial credit could be given based on the percentage of zero-carbon power in the grid mix. The “grid mix” could be based on the state, the utility territory, or some other region. The tax credit should ideally deduct the emissions associated with power consumption for electrolysis as well as emissions for hydrogen transportation.
Note, however, that electrolytic hydrogen quickly becomes CO2-increasing relative to SMR as the power mix moves away from carbon free. Therefore, power would have to be nearly carbon free for electrolytic hydrogen to be eligible.
On the user side, requiring that the tax credit be earned based on displacement adds another level of complexity to the credit process, where it would be necessary to show evidence of displacement and of CO2 reductions. The emissions displaced will vary depending on industrial application. For example, is the low-carbon hydrogen replacing high-carbon hydrogen in ammonia production or natural gas used for industrial heat?
Whether the low-carbon hydrogen can be easily traced from production to end use will affect how credible a credit will be. If contracts between buyers and sellers specify specific uses and baselines, these displaced emissions could be estimated within reasonable margins. But if, as one would hope, markets develop for green hydrogen, the link between buyers and sellers will be broken and any estimation of displacement would have to be much cruder or based on heavier requirements for documentation. Because contracts may well be the way forward in the near term, we are sanguine about this measurement issue.
One way to account for both production and end-use issues would be to have both a base-level credit and a verified credit. The base-level credit would be set by average production and end-use emissions intensities and would be offered with relatively low-level documentation and certification, whereas the verified credit would give a larger credit to projects that demonstrate a higher level of climate benefits as a result of cleaner production processes or greater CO2-intensive displacement. For the power sector, this accounting is not too complicated, since the displaced fuel is likely to be natural gas, and hydrogen and natural gas are assumed to have the same heat rate (MMBtu/MWh) in combined-cycle and combustion turbine plants. A credit to the user would encourage minimizing H2 leaks in infrastructure, but this may be of limited significance.
Figure 22. CO2 Reduction from Zero-Carbon Hydrogen, by Application and Fuel or Feedstock Displaced
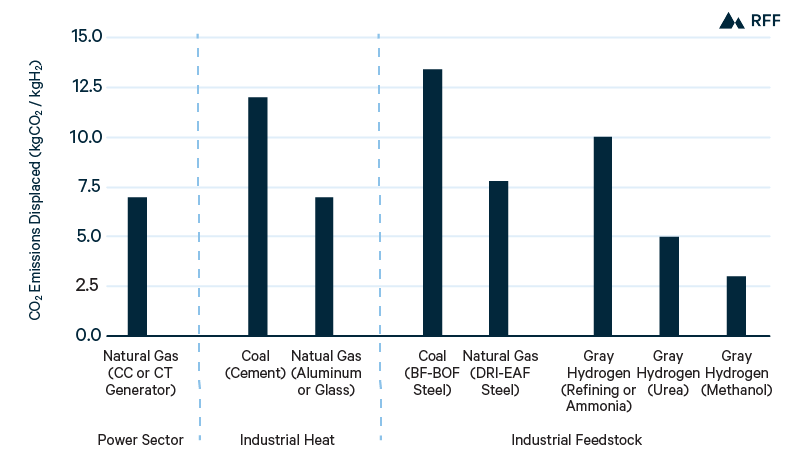
As shown in Figure 22, the use of hydrogen in the industrial sector (whether as a fuel or feedstock) has a wide range of emissions effects, given the variations in displaced energy sources and industrial processes. Therefore, in the industrial sector, a verified tax credit may be necessary to appropriately compensate decarbonized hydrogen for its emissions reduction.
Another option, and one identified in a recent report from the House Select Committee on Climate Change (2020), is to have two separate tax credit programs—one for production of hydrogen and the other for its use (and presumably displacement of other fossil fuels)— designed to avoid double counting. Our issue with this structure is that the linkage between production and use matters, and with two credit policies that linkage is broken.
4.3. Coordination with 45Q
We envision that the DH2 tax credit will coexist with the 45Q credit. Thus, we assume that such credits are available to subsidize CCUS when hydrogen is created from natural gas with carbon capture (blue hydrogen).
The bluer the hydrogen, the greater the tax credit under 45Q. Thus, blue hydrogen with 60 percent capture would be rewarded less than blue hydrogen with 90 percent capture. The one caveat is the potential perverse incentive of rewarding higher-carbon input fuels (e.g., coal) that would generate more CO2 for capture but still result in higher-carbon blue H2. For example, coal with 90 percent capture has twice the uncaptured emissions as natural gas with 90 percent capture.
Thus, we do not propose that blue hydrogen projects receive a hydrogen production tax credit, although they could be eligible for an end-use credit for the hydrogen that displaced other fuels and inputs to lower the CO2 footprint. Nonetheless, the approaches that we outline to setting the level of a hydrogen tax credit could be adapted to blue hydrogen (if 45Q were no longer available) or to other clean production processes that are yet to be developed.
4.4. Level of a Production Tax Credit for Decarbonized Hydrogen
The level of the tax credit can be set in two basic ways: based on the social cost of carbon, and based on the value that is necessary to stimulate low-carbon hydrogen production (and/or use). The justification for the former is that, as a climate policy, the value of the tax credit should be equal to the climate benefit. The justification for the latter is that the policy aims at technological development through economies of scale and learning-by-doing, so it may be reasonable for the value of the tax credit to initially exceed its present climate benefit.
4.4.1. Credit Based on the Social Cost of Carbon
If a social cost of carbon approach is to be taken, we favor use of the global SCC (valued by the Obama Administration’s Interagency Working Group at $46/tCO2 for 2025, in 2007$). Throughout this paper we use the global SCC, inflated from 2007$ to 2019$. However, the Trump administration favored use of the domestic SCC, which is around $7/tCO2. See the 2020 GAO report: https://www.gao.gov/products/GAO-20-254. Precedent for using the global SCC to fix the level of the tax credit may be found in 45Q, where the $35/tCO2 to $50/tCO2 credits are comparable to the global SCC. Similarly, before the wind PTC phased down, its credit of $23/MWh implied an incentive of $49/tCO2 based on the emissions from displaced power generation. See http://www.catf.us/wp-content/uploads/2017/12/CATF_FactSheet_Cost_of_CO2_Avoided.pdf. If the denominator for the credit calculation were physical units of product rather than tons of CO2, then conversions would need to be made based on some average CO2 content of the inputs being displaced, or some other metric.
For example, replacing natural gas with hydrogen for combustion would displace 7 kgCO2/kgH2, so if the hydrogen were 100 percent green (and assuming no emissions from transportation), a price of $50/tCO2 would translate to a credit of $0.35/kgH2. Figure 23 shows the credit for zero-carbon hydrogen by application, from Figure 22, increasing over time as the SCC rises from $51/tCO2 in 2020 to $84/tCO2 in 2050.
Figure 23. Incentive for Zero-Carbon Hydrogen, by Power and Industrial Application
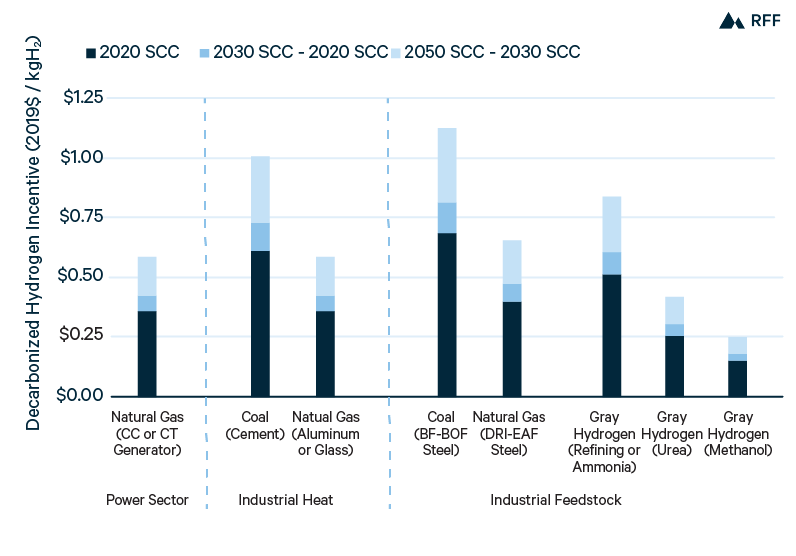
4.4.2. Credit Based on the Cost of Production and Distribution
The second method would set the tax credit to be sufficient to make low-carbon hydrogen production economic. The challenge with the first method is that although the SCC rises over time, the cost of low-carbon hydrogen production should fall over time from scale and learning effects. If the SCC values in the early years are too low to make decarbonized hydrogen projects feasible, it may take an undesirably long period of time before the SCC rises to a level that allows such projects to be developed. This second method would thus set the tax credit at a level that stimulates initial projects and declines over time as production costs fall.
4.4.3. The Tax Basis
Whichever value is used, a question remains about the amount of CO2 that should be multiplied by the unit value. Figure 22 illustrates the climate benefits of using hydrogen, but the production emissions of hydrogen must be accounted for in a tax credit. In the absence of 45Q, blue hydrogen should be credited based on its emissions profile. This would be similar to 45Q if natural gas were the only fuel source for blue hydrogen, but different from 45Q if coal were also used (e.g., Figure 2 and Section 4.3).
Figure 3 shows why hydrogen that is merely electrolytic should not be credited—even in a 2050 grid, electrolytic hydrogen could have emissions higher than SMR because of the energy conversion losses. Power used in electrolysis needs to be close to zero-carbon for the hydrogen to have a climate benefit. How would green hydrogen producers show compliance? For example, EDF Renewables has a designed an instrument called a GTECH (Green Technology Energy Credit Hourly) for corporate customers to verify that the electricity purchased (on an hourly basis) is carbon-free. See https://www.greentechmedia.com/articles/read/transforming-corporate-sustainability-with-24-7-365-carbon-free-energy-matching. Should RECs be used for renewable power? What about nuclear power— how might it be tracked?
4.4.4. Putting It All Together
Under the first method, the tax credit (in units of $/kgH2) would ideally be equal to the amount of CO2 displaced by the user of H2 less the CO2 emitted in the production and transportation of H2 (through fossil energy use) times the social cost of carbon. The tax credit thus requires a calculation of each of those three terms.
4.5. Other Tax Credit Design Issues
Bartlett and Krupnick (2019) produced a detailed analysis of issues in the implementation of the tax credit for carbon capture, utilization, and storage, known as 45Q, in response to a request for comment from IRS (the implementing agency) before it wrote rules, and also produced a blog on the first set of rules issued by the IRS in March 2020. https://www.resourcesmag.org/common-resources/45q-series-comments-45q-tax-credit-carbon-capture-utilization-and-storage-ccus/ These comments are the starting point for our thinking about the details of a DH2 tax credit analogous to the issues raised by the 45Q tax credit for CCUS projects.
4.5.1. Definition of DH2
A definition is needed for decarbonized hydrogen for purposes of earning a tax credit. The simplest, most narrow definition is that DH2 is hydrogen produced with net zero CO2 emissions. Alternatively, a benchmark for “standard” hydrogen could be defined, and then DH2 produced with less net CO2 emissions would be eligible for tax credits (provided that is it used to reduce CO2 emissions).
4.5.2. Timing Issues of a Tax Credit
The IRS rules for energy-related tax credits have a long history. The 45Q rules built on earlier rules for the wind PTC and solar ITC and covered starting construction, making continual progress, and having the ability to aggregate or disaggregate a project to meet required deadlines or safe harbors. Presumably, DH2 legislation would also have the IRS make rules along similar lines. Is there any reason that the law or subsequent regulations should be different for hydrogen than for CO2?
One way into this issue is to think about the criticisms of the 45Q legislation. In particular, industry felt that the deadlines to begin construction (2023, with IRS guidance published in 2020) were too short for CO2 technologies. With hydrogen arguably on a slower path, even more time is needed to stimulate the new technologies.
Considering the rules for establishing eligibility with respect to beginning construction and making continuous progress, some modifications of 45Q rules might be appropriate for a hydrogen rule.
The IRS rules allow either construction work of a “significant nature” or use of the safe harbor provision (spending at least 5 percent of total project cost) to mark the start of the project. If the project is placed in service within six years of its start, the project is satisfying the continuous progress requirement. For hydrogen projects, we can imagine allowing a longer period to demonstrate continuous progress and counting the purchase of specific hydrogen-producing or hydrogen-using equipment as work started.
For 45Q, the IRS guidance gives project developers considerable flexibility throughout the development and construction process to obtain eligibility. For instance, the IRS acknowledged and allowed various disruptions to construction and cost overruns because of the novelty of CCUS projects. In the same vein, the DH2 project process, involving both producers and users, is novel and complex, so maximum flexibility is needed. One example: multiunit carbon capture projects can be aggregated and considered a single project, so a multipart project could meet the deadline even if parts of the project had not yet commenced construction. For DH2, the same could apply and perhaps be extended, such that one part to use hydrogen and another to produce it are considered one project.
Finally, the 45Q guidance contains the notable statement that the IRS will not issue private letter rulings or determination letters to taxpayers. Thus, taxpayers will need to follow the rules in the guidance and not have separate upfront dialogues with the IRS about particular circumstances. This approach promises to streamline IRS decisionmaking and be more equitable for all taxpayers seeking the 45Q credits. A similar approach would be good for a 45Q-type legislation for DH2.
At the same time, in many places in the 45Q guidance, the IRS says its eligibility determinations will be based on “facts and circumstances.” This ambiguity raises issues of how applications need to be structured, what their evidentiary basis must be, the criteria for IRS determinations, the existence and nature of an appeal process, and so on. These details are lacking, which may cause near-term uncertainty and challenges as projects are being prepared. We hope the IRS would correct this shortcoming in its future 45Q guidance and in any future DH2 guidance.
4.5.3. Monitoring, Reporting, and Verification
IRS proposed guidance for 45Q associated with monitoring, reporting, and verification (MRV) has recently been released. See https://www.irs.gov/pub/irs-drop/reg-112339-19.pdf. It requires that the Environmental Protection Agency (EPA) approve an MRV plan for Class VI wells designed to sequester CO2, but gives flexibility for Class II wells using and capturing CO2 for enhanced oil recovery. Eligible taxpayers can either submit a plan for EPA approval or follow and have verified use of an ISO plan for EOR wells that the IRS says have many of the same characteristics as an EPA-approved plan.
In contrast to CO2, there are no MRV plans or models or ISOs for decarbonized hydrogen, from production through use, in the power and industrial sectors. However, California’s Low Carbon Fuel Standard (a policy to reduce the carbon intensity of transportation fuel) has protocols for different types of hydrogen production, which could serve as a starting point for establishing production emissions. See https://ww2.arb.ca.gov/sites/default/files/classic//fuels/lcfs/ca-greet/lut-doc.pdf. Components that would need to be created include the following:
- tracking the net CO2 content of the electricity or other processes used to produce hydrogen;
- tracking the use of the DH2 through partnerships or bilateral trades with producers and users;
- tracking the CO2 backed out by the use of DH2;
- computing the eligible CO2 reduction credits; and
- developing certification and reporting protocols and having third-party institutions implement them.
Even the mechanism for tracking the CO2 content of power is still nascent. We had mentioned RECs to track renewable power, but of course this would not cover nuclear (or perhaps even hydropower). Furthermore, even RECs may not accurately track zero-carbon power, since there may be double counting when the RECs are unbundled from the underlying electricity. https://media.rff.org/documents/TN230338_20191024T130612_Jay_Bartlett_Comments.pdf
The CO2 emissions, or even energy requirements, associated with hydrogen transportation and storage are hard to find. Although likely to be lower in magnitude than the displacement benefit of DH2, transportation and storage emissions should be included to accurately value the net climate benefit of DH2.
4.5.4. Duration of the Tax Credit
The development times for decarbonized hydrogen may be lengthy, as they are for CCUS projects and even large wind projects with permitting, interconnection, and transmission requirements. We can therefore base the duration of a DH2 credit on the durations of the PTC and 45Q. The PTC provides tax credits for the first 10 years of wind power production, and CCUS credits under 45Q have a 12-year duration. Thus, the 10- to 12-year range seems appropriate for a DH2 program as well.
5. Conclusion
Decarbonizing the world’s economy will require enlightened policies, technological advancements, and creative use of all that Nature has provided us. This report has looked at one component of that effort—decarbonized hydrogen for use in the US power and industrial sectors. Large amounts of what is termed gray hydrogen are already used by industry and produced by relatively dirty steam methane reforming, to the point that even though hydrogen has no carbon emissions when consumed, it would still emit more CO2 than natural gas per Btu produced. Blue hydrogen, in which carbon capture, utilization, and storage reduce production emissions, is one viable low-carbon pathway. Hydrogen produced with electrolysis is no better for the climate than gray hydrogen unless the electricity itself is fairly cleanly produced. However, if power for electrolysis is exclusively from renewable and nuclear energy, the resulting green hydrogen is an almost zero-carbon energy resource.
In this report, we have reviewed the processes of hydrogen production—both the high-emitting SMR and gasification methods, which currently predominate, as well as the decarbonized methods, including electrolyzer technologies, the application of CCUS, and some other approaches.
We find that blue hydrogen (with 50 to 55 percent of CO2 captured) is already competitive with gray hydrogen, after accounting for a global social cost of carbon of around $50/ton CO2 (Figure 5). And CCUS is already subsidized through the 45Q program, which provides tax credits rising to $50/ton by 2026. With increased scale—particularly of regional CCUS infrastructure—and development of autothermal reforming technology, lower-carbon blue hydrogen (with 90 percent of CO2 captured) could become the most efficient hydrogen production method by 2030 (Figure 9).
Green hydrogen has a longer way to go but has the potential for even lower costs, since the process is not tied to natural gas reforming. IRENA (2019) projects that by 2050, green hydrogen cost could be $1.38/kgH2, assuming a capital cost of $200/kW, power cost of $20/MWh, and utilization of 48 percent. However, some industry participants predict that green hydrogen costs will decline further, caused by lower electrolyzer and power costs. Assuming a capital cost of $80/kW and power cost of $15/MWh, green hydrogen production costs would drop to or below $1.00/kgH2 (Mathis and Thornhill 2019), less than the cost of gray hydrogen today in the United States—without accounting for the social cost of carbon.
Delivery to the user and any necessary storage also must be competitive with substitutes. This is challenging because hydrogen is a gas with a very low density and boiling point. Currently, transportation and storage costs are not significant concerns for gray hydrogen, since 85 percent of hydrogen is produced and consumed on-site (IEA 2019). But expanded use would make these costs an issue. For storage, we find that salt caverns, where advantageously located, are already the best option and have predicted future cost reductions of around 50 percent. For transmission within the United States, dedicated hydrogen pipelines would generally be the least expensive alternative. However, in the shorter term, and particularly to get the hydrogen to power stations where it would substitute for natural gas, low proportions of hydrogen (less than 20 percent by volume) could be blended with natural gas and take advantage of the latter’s extensive pipeline infrastructure. Alternatively, decarbonized hydrogen industrial and power hubs can be created so that co-location reduces the distance for transmission. The Gulf Coast, which already boasts hydrogen storage and transmission, has been targeted as a blue hydrogen hub, and Utah has a project in development to take advantage of its wind and solar resources and salt caverns to make and store green hydrogen.
All the blue and green hydrogen produced and delivered will not in and of itself lead to lower CO2 emissions unless it substitutes for dirtier fuels and processes. The most obvious substitute is for gray hydrogen, used in oil refining and ammonia manufacturing. For more widespread and greater carbon reduction benefits, we consider three broad end uses for decarbonized hydrogen: in the power sector, as a source of industrial heat, and as an industrial feedstock (including, but not limited to, its use in oil refining and ammonia production).
In the power sector, decarbonized hydrogen has the unusual advantage of dispatchable electricity generation without CO2 emissions. Only natural gas power with CCUS has a similar combination, and green hydrogen power has the lower emissions profile. Moreover, green hydrogen allows for energy storage: surplus zero-carbon power can be converted to hydrogen and later used to generate power at times of scarcity. Energy storage with green hydrogen is not competitive with other options, such as batteries, pumped hydro, and compressed air, at discharge durations less than one or two days. However, the ability to store hydrogen comparatively cheaply makes hydrogen the most competitive alternative for longer-term storage.
Despite hydrogen’s dispatchability and potential for energy storage, it will likely be cost-effective and widespread only in the long term. Green hydrogen production costs must decline drastically, and inexpensive storage and pipelines must be established beyond the Gulf Coast. Additionally, the value of long-term storage may only be compelling when wind and solar comprise a majority of power generation on the grid. Lastly, a longer time horizon would lead to use of a higher social cost of carbon (it increases every year), improving the comparison of hydrogen with natural gas.
Turning to industrial heat, the combustion of fossil fuels accounts for 58 percent of US industrial CO2 emissions. Yet this sector is likely to be hard to decarbonize for economic and political reasons, as well as technical requirements for heat specific to various industrial processes. Electricity, for instance, is well suited to low- and medium-temperature applications and particularly for greenfield plants. Another substitute, biomass, is also more efficient in low- and medium-temperature processes, and its sustainable production is limited. CCUS installed at an industrial facility is a third competing technology. It is most compelling in retrofit applications and in processes with highly concentrated CO2 emissions, such as in cement and steel production. But CO2 transport and storage options need to be viable and economic.
The largest opportunity for hydrogen as an industrial heat source is in high-temperature processes (for which electricity and biomass are less suited) that can switch fuels with only minor plant modifications (an advantage over CCUS). Cement, aluminum, glass, and certain pulp and paper manufacturing applications present the greatest potential for hydrogen use. However, as in the power sector, hydrogen production and delivery costs must decline substantially before hydrogen’s potential in industrial heating will be realized.
As a feedstock, decarbonized hydrogen is a straightforward substitute for gray hydrogen in oil refining and ammonia production. In the near term, CCUS could be applied to SMR to produce blue hydrogen, either on-site (at a refinery or ammonia plant) or at a merchant hydrogen facility. In the long term, when production and storage costs decline sufficiently, green hydrogen could be introduced as an even lower carbon feedstock for refining and chemicals production. Additionally, low-cost green hydrogen could be used in the production of urea and methanol, where the climate benefits of decarbonized hydrogen are more modest than in oil refining and ammonia manufacturing.
Another novel feedstock application for decarbonized hydrogen is in iron and steel production, the source of 7 percent of today’s global CO2 emissions (McKinsey 2018). The massive scale of current emissions and high carbon intensity of steel production imply a large opportunity for green hydrogen. However, hydrogen use requires a transition in steelmaking processes, which will likely slow its uptake. Moreover, there are competing low-carbon production methods for steel; green hydrogen may need to demonstrate a substantial cost reduction before steelmakers commit to a hydrogen-based process.
Decarbonized hydrogen will need a policy boost that lowers its costs relative to competitors in recognition of its carbon benefits. Thus we have ended the paper with a policy analysis. Comparing a long list of competing policies, we find that a tax credit system that covers production and use of decarbonized hydrogen is the most promising in the short term on the basis of practicality, although it comes with a not inconsiderable drawback of picking winners. Nevertheless, CCUS is already incentivized with a generous tax incentive program (45Q), and we posit a program for decarbonized hydrogen along these lines and with (possibly) a similar implicit low-carbon subsidy (~$50/tCO2 captured, reduced, or displaced). Beyond the level of the tax credit, we discuss several other features important to effective design: the structure of the tax credit (we favor a production basis rather than an investment basis), assignment of the credit to the user, coordination with the 45Q tax credit for CCUS, the duration of a production-based credit, deadlines and eligibility rules, and monitoring and enforcement.
The 45Q tax credit for CCUS and the production tax credit for wind have shown how tax credits can assign a value to CO2 mitigation and serve effectively as climate policies. Additionally, for new technologies, tax credits can enable cost reductions through economies of scale and learning by doing. A tax credit for decarbonized hydrogen is admittedly more complicated than a tax credit for either CCUS or wind. Decarbonized hydrogen has a range of production emissions (Figure 2), and its use has a range of displaced emissions (Figure 22). Production and displaced emissions may be straightforward (e.g., green hydrogen replacing natural gas in combustion), but often they are more complex (e.g., in steel production), which is why we dedicate significant portions of Sections 2 and 3 to emissions. Accordingly, mechanisms to verify and track production and displaced emissions will be essential to the operation of a decarbonized hydrogen tax credit.
Although uncertainties abound in clean energy technologies, decarbonized hydrogen will likely be an important part of a low-carbon portfolio. As a form of chemical energy, hydrogen offers some of the major advantages of fossil fuels—cheap long-term storage and combustion heating—without the carbon. And producing hydrogen from electrolysis creates a valuable industrial feedstock from water, bypassing a fossil fuel value chain. Those properties are unusual, if not unique to decarbonized hydrogen, suggesting that a tax credit designed for decarbonized hydrogen is a worthwhile component of climate policy.