Global Energy Outlook 2023: Sowing the Seeds of an Energy Transition
RFF’s annual Global Energy Outlook report examines a range of projections for the global energy system, summarizing key implications for global energy consumption, emissions, and geopolitics.

1. Introduction
The future of the global energy system is deeply uncertain, and the choices that are made in the coming years will have enormous consequences for the future of the climate and, indeed, human civilization. To understand how our energy system is changing, each year various organizations produce long-term projections that imagine a wide range of futures based on divergent visions about policies, technologies, prices, and geopolitics.
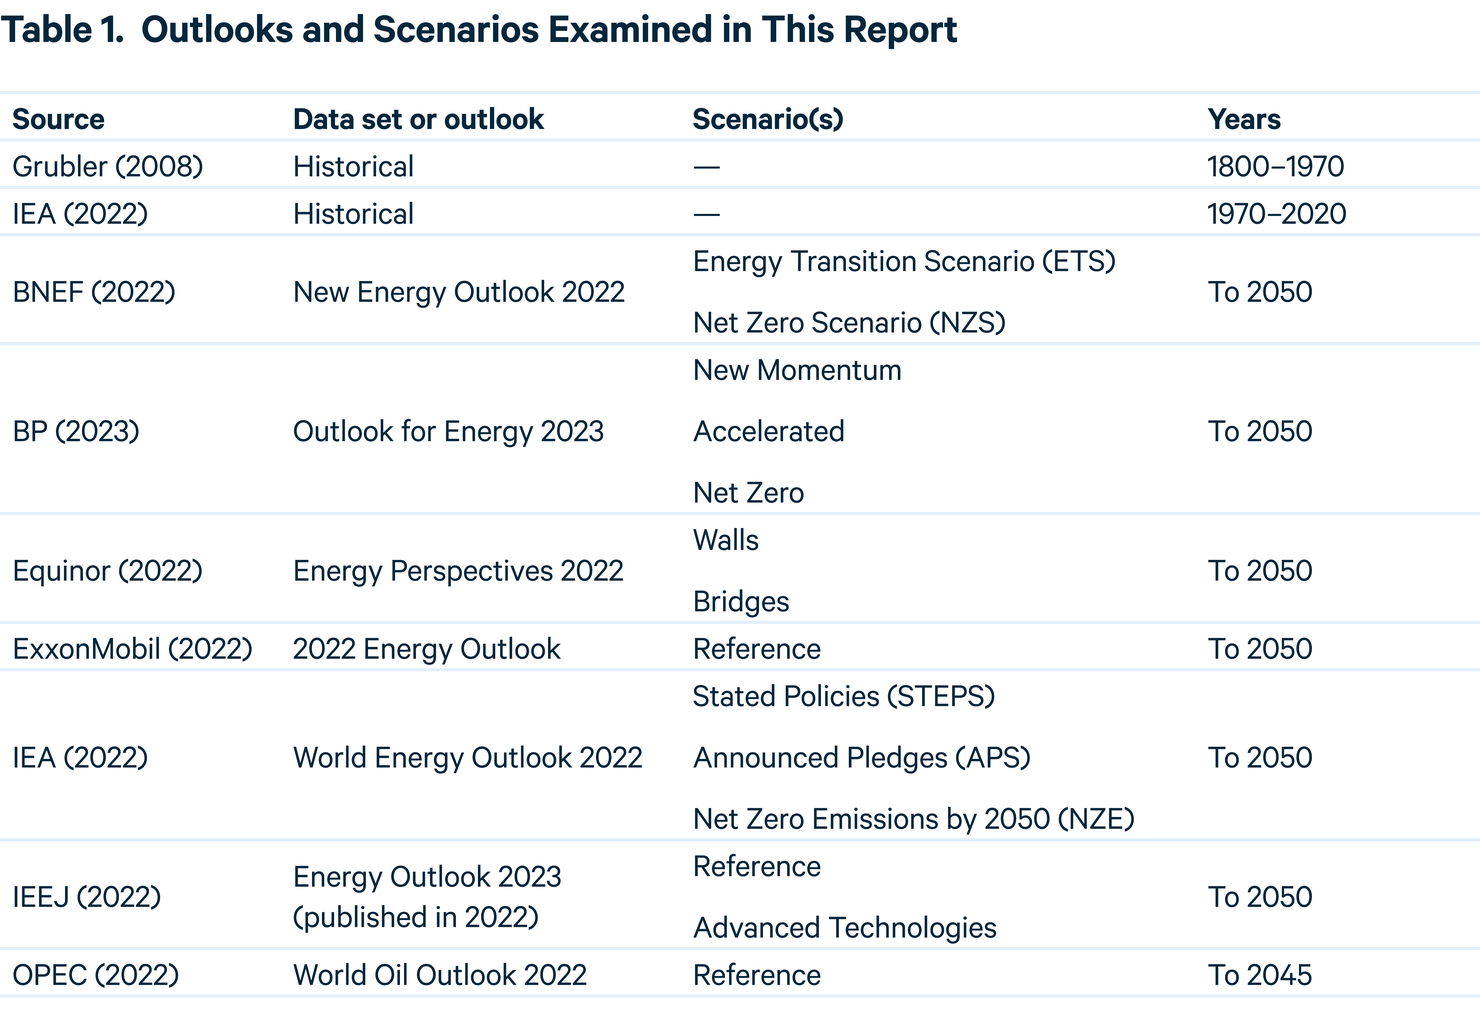
Because these projections vary widely and depend heavily on their different assumptions and methodologies, they are difficult to compare on an apples-to-apples basis. In this report, we apply a detailed harmonization process to compare 14 scenarios across seven energy outlooks published in 2022. We also include BP’s Energy Outlook 2023, which was published in January 2023. Taken together, these scenarios offer a broad scope of potential changes to the energy system as envisioned by some of its most knowledgeable organizations. Table 1 shows the historical data sets, outlooks, and scenarios examined here; details are provided in Section 4.
A brief description of our methodology appears under Data and Methods (Section 4), with select data indicators under Statistics (Section 5). For the full methodology, data sets, and interactive graphing tools, visit www.rff.org/geo.
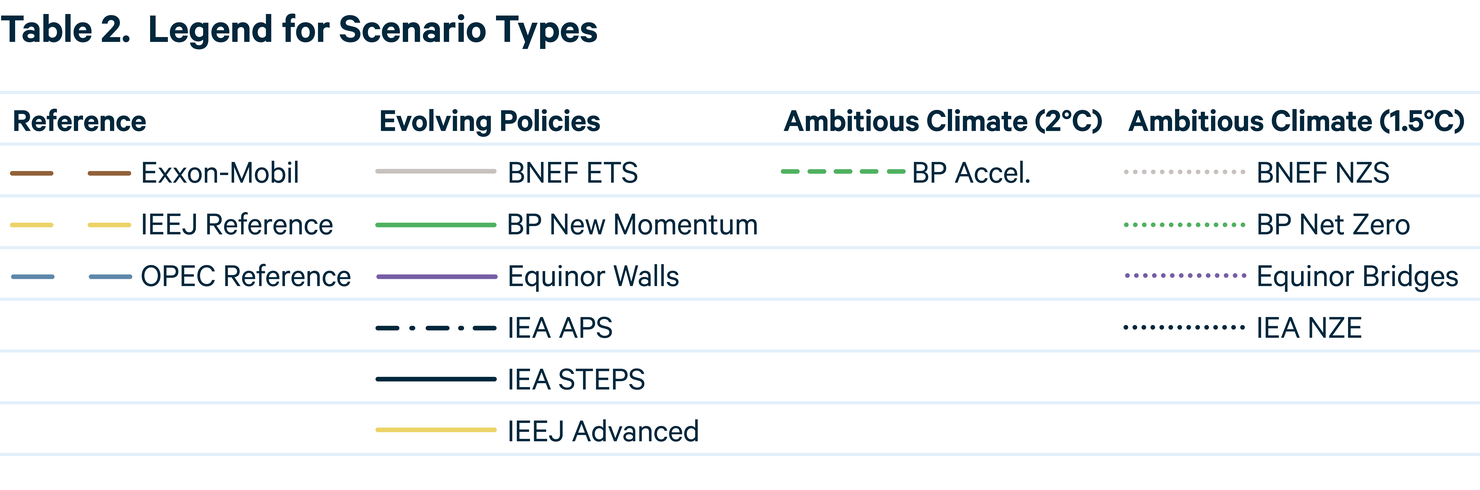
Throughout the figures included in this report, we use a consistent labeling system that distinguishes the different scenarios (see Table 2):
- For “Reference” scenarios, which assume limited or no new policies, we use a long-dashed line. This set comprises Reference scenarios from ExxonMobil, IEEJ, and OPEC.
- For “Evolving Policies” scenarios, which assume that policies and technologies develop according to recent trends and/or the expert views of the team producing the outlook, we use solid lines. This set comprises BNEF ETS, BP New Momentum, and IEA STEPS. Although they do not follow the same sets of assumptions, we also include Equinor Walls and IEEJ Advanced Technologies scenarios in this group because their trajectories for carbon dioxide (CO2) emissions are similar to those in other Evolving Policies scenarios. For IEA APS, which assumes that governments implement all announced energy and climate policies, we use a dot-dash line.
- For “Ambitious Climate” scenarios, which are built around limiting global mean temperature rise below 2°C by 2100, we use short-dashed lines. Just one scenario met this definition: BP’s Accelerated Transition.
- For Ambitious Climate scenarios, designed to limit global mean temperature rise to 1.5°C by 2100 or net-zero emissions by 2050, we use a dotted line. This set includes BNEF NZS, BP Net Zero, Equinor Bridges, and IEA NZE.
Figures and tables in this report sometimes refer to regional groupings of “East” and “West.” This year, regional data were limited for roughly half of the scenarios, making it impossible to create consistent “East” and “West” groupings for many scenarios. Table 3 provides those regional groupings.

2. Key Findings
Despite pledges from governments and major corporations around the world to reduce greenhouse gas emissions, the world is mostly continuing its long history of adding to, rather than transitioning away from, older energy sources. Although policymakers, civil society, and business leaders have begun sowing the seeds of the energy transition, much more action will be required to ensure that these seeds bear fruit at the scale and speed necessary to avert the worst effects of climate change.
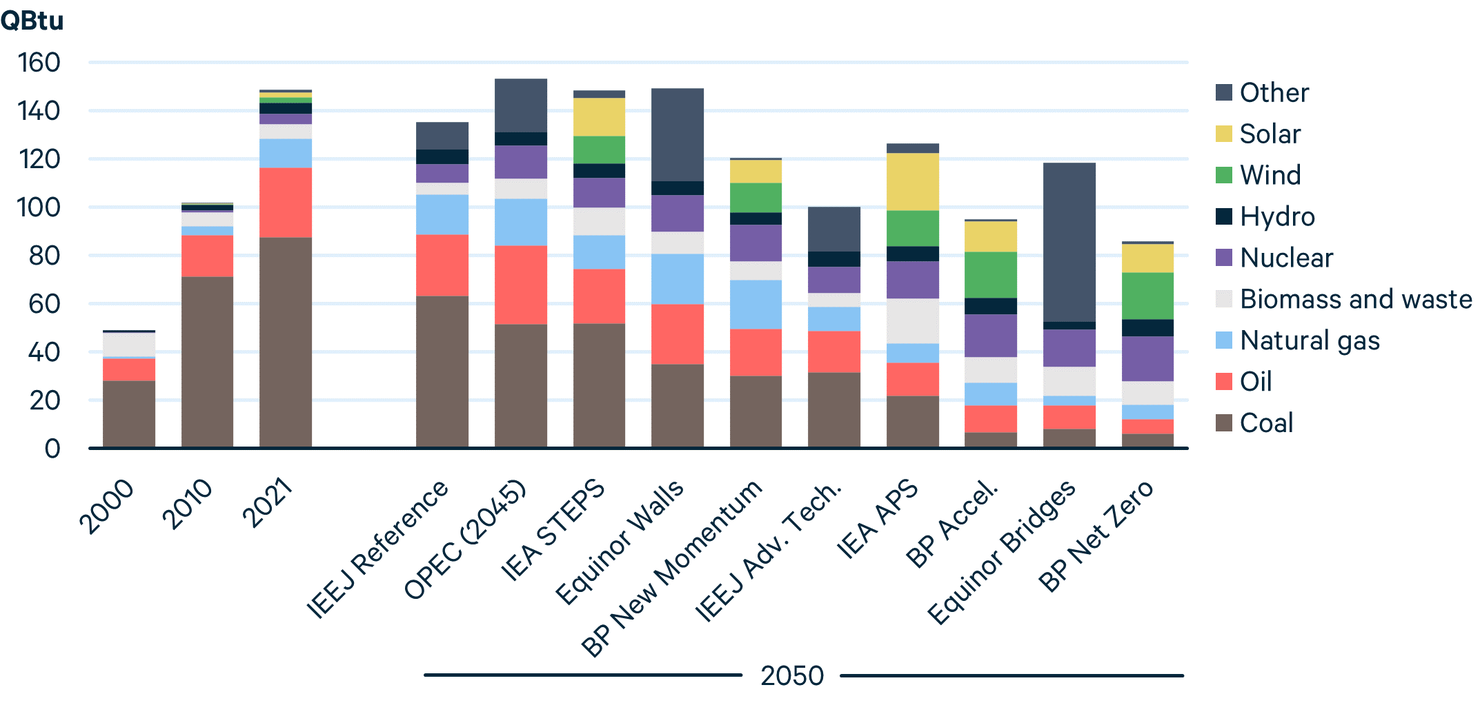
Figure 1. Global Primary Energy Demand, by Source
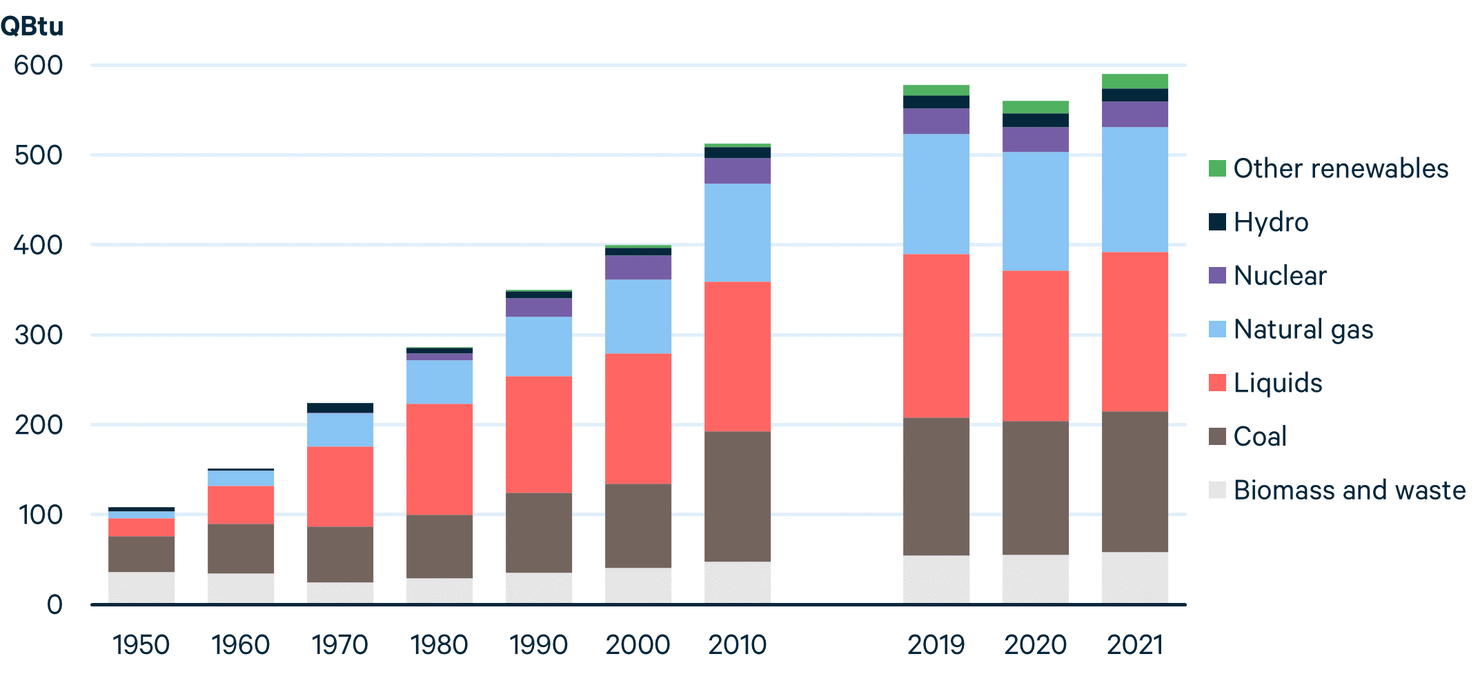
Global investment in clean energy technologies, led by renewable power and electric transportation, grew to an estimated $1.1 trillion in 2022, up 31 percent from the prior year. And yet, preliminary data indicate that world CO2 emissions grew by 1 percent that same year, surpassing their 2019 peak. Such trends illustrate the immense scale of the global energy system and the challenge of shifting it not just toward clean sources but also away from polluting sources.
At the same time, more and more policymakers and private sector leaders are making commitments to reduce emissions to net zero in the decades ahead. These commitments are shifting the energy system at national and regional scales, particularly in developed economies in Europe and North America. Nonetheless, the projections included in this analysis, and those prepared by other experts and organizations, demonstrate clearly that the world needs to match words with actions to reduce emissions and limit global warming to 2°C, let alone 1.5°C, by the end of the century.
Although emissions and fossil fuel consumption remain at or near their all-time highs globally, some regions—particularly Europe—appear to have entered a true energy transition, with fossil fuel sources being displaced at large scale by cleaner technologies. Russia’s invasion of Ukraine and the resulting energy insecurity have accelerated Europe’s shift away from fossil fuels.
Figure 2. Primary Energy Demand in Europe, by Source
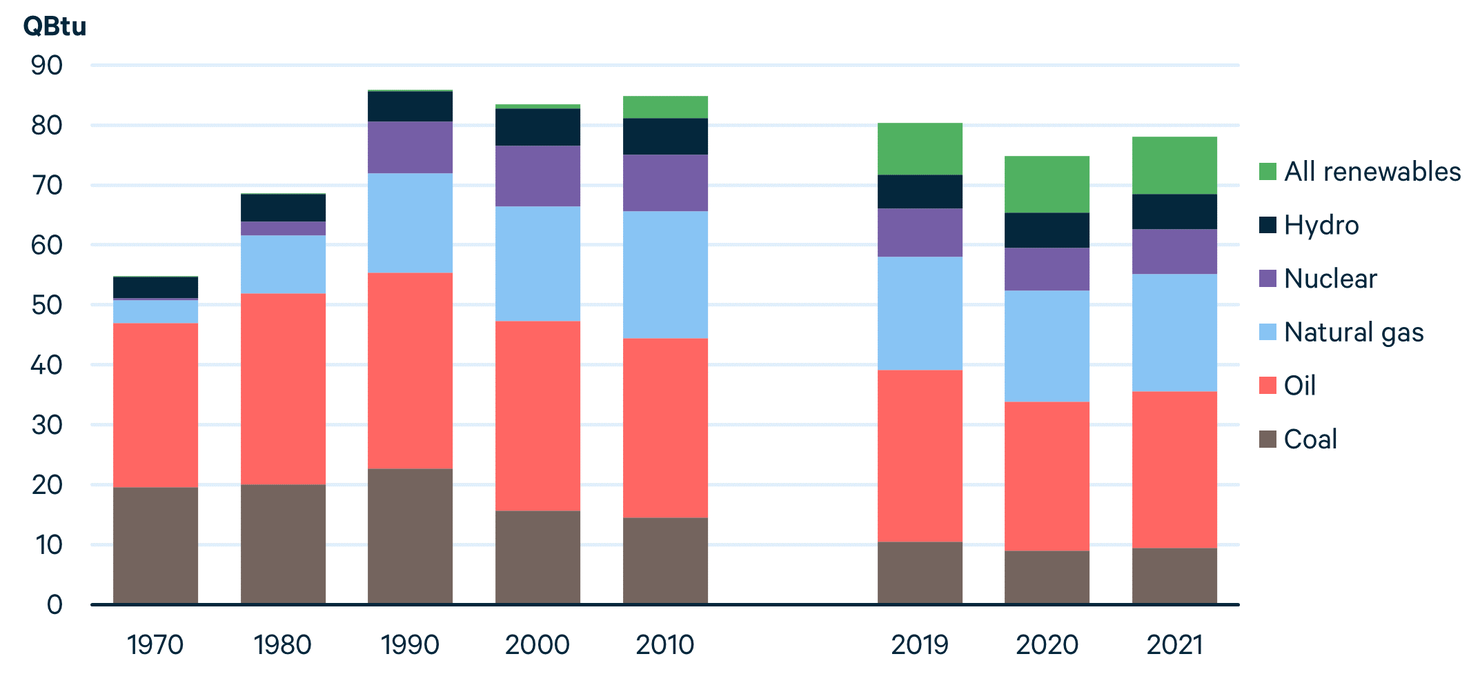
Europe’s progress in reducing emissions has been driven by its pioneering carbon market, along with other policies that support the deployment of renewable electricity, encourage low- or zero-emissions transportation options, and levy high taxes on fuels such as diesel and gasoline.
However, the region’s energy transition has come with challenges, some of which have been exacerbated by the Russian invasion of Ukraine. For example, most European nations have needed to increase their reliance on coal-fired electricity to ensure reliable power supplies in the face of high prices and uncertain supplies for natural gas. In the European Union, coal demand grew by 14 percent in 2021, following the COVID-19 pandemic lows, but is projected to grow again by 7 percent in 2022.
Looking forward, Europe’s policy framework is likely to drive deep reductions in the use of coal and other fossil fuels in the coming years. For example, ExxonMobil’s Reference and IEA’s STEPS project that the share of fossil fuels in Europe’s primary energy mix falls from 68–70 percent in 2021 to 59–62 percent by 2030, followed by further reductions in subsequent years.
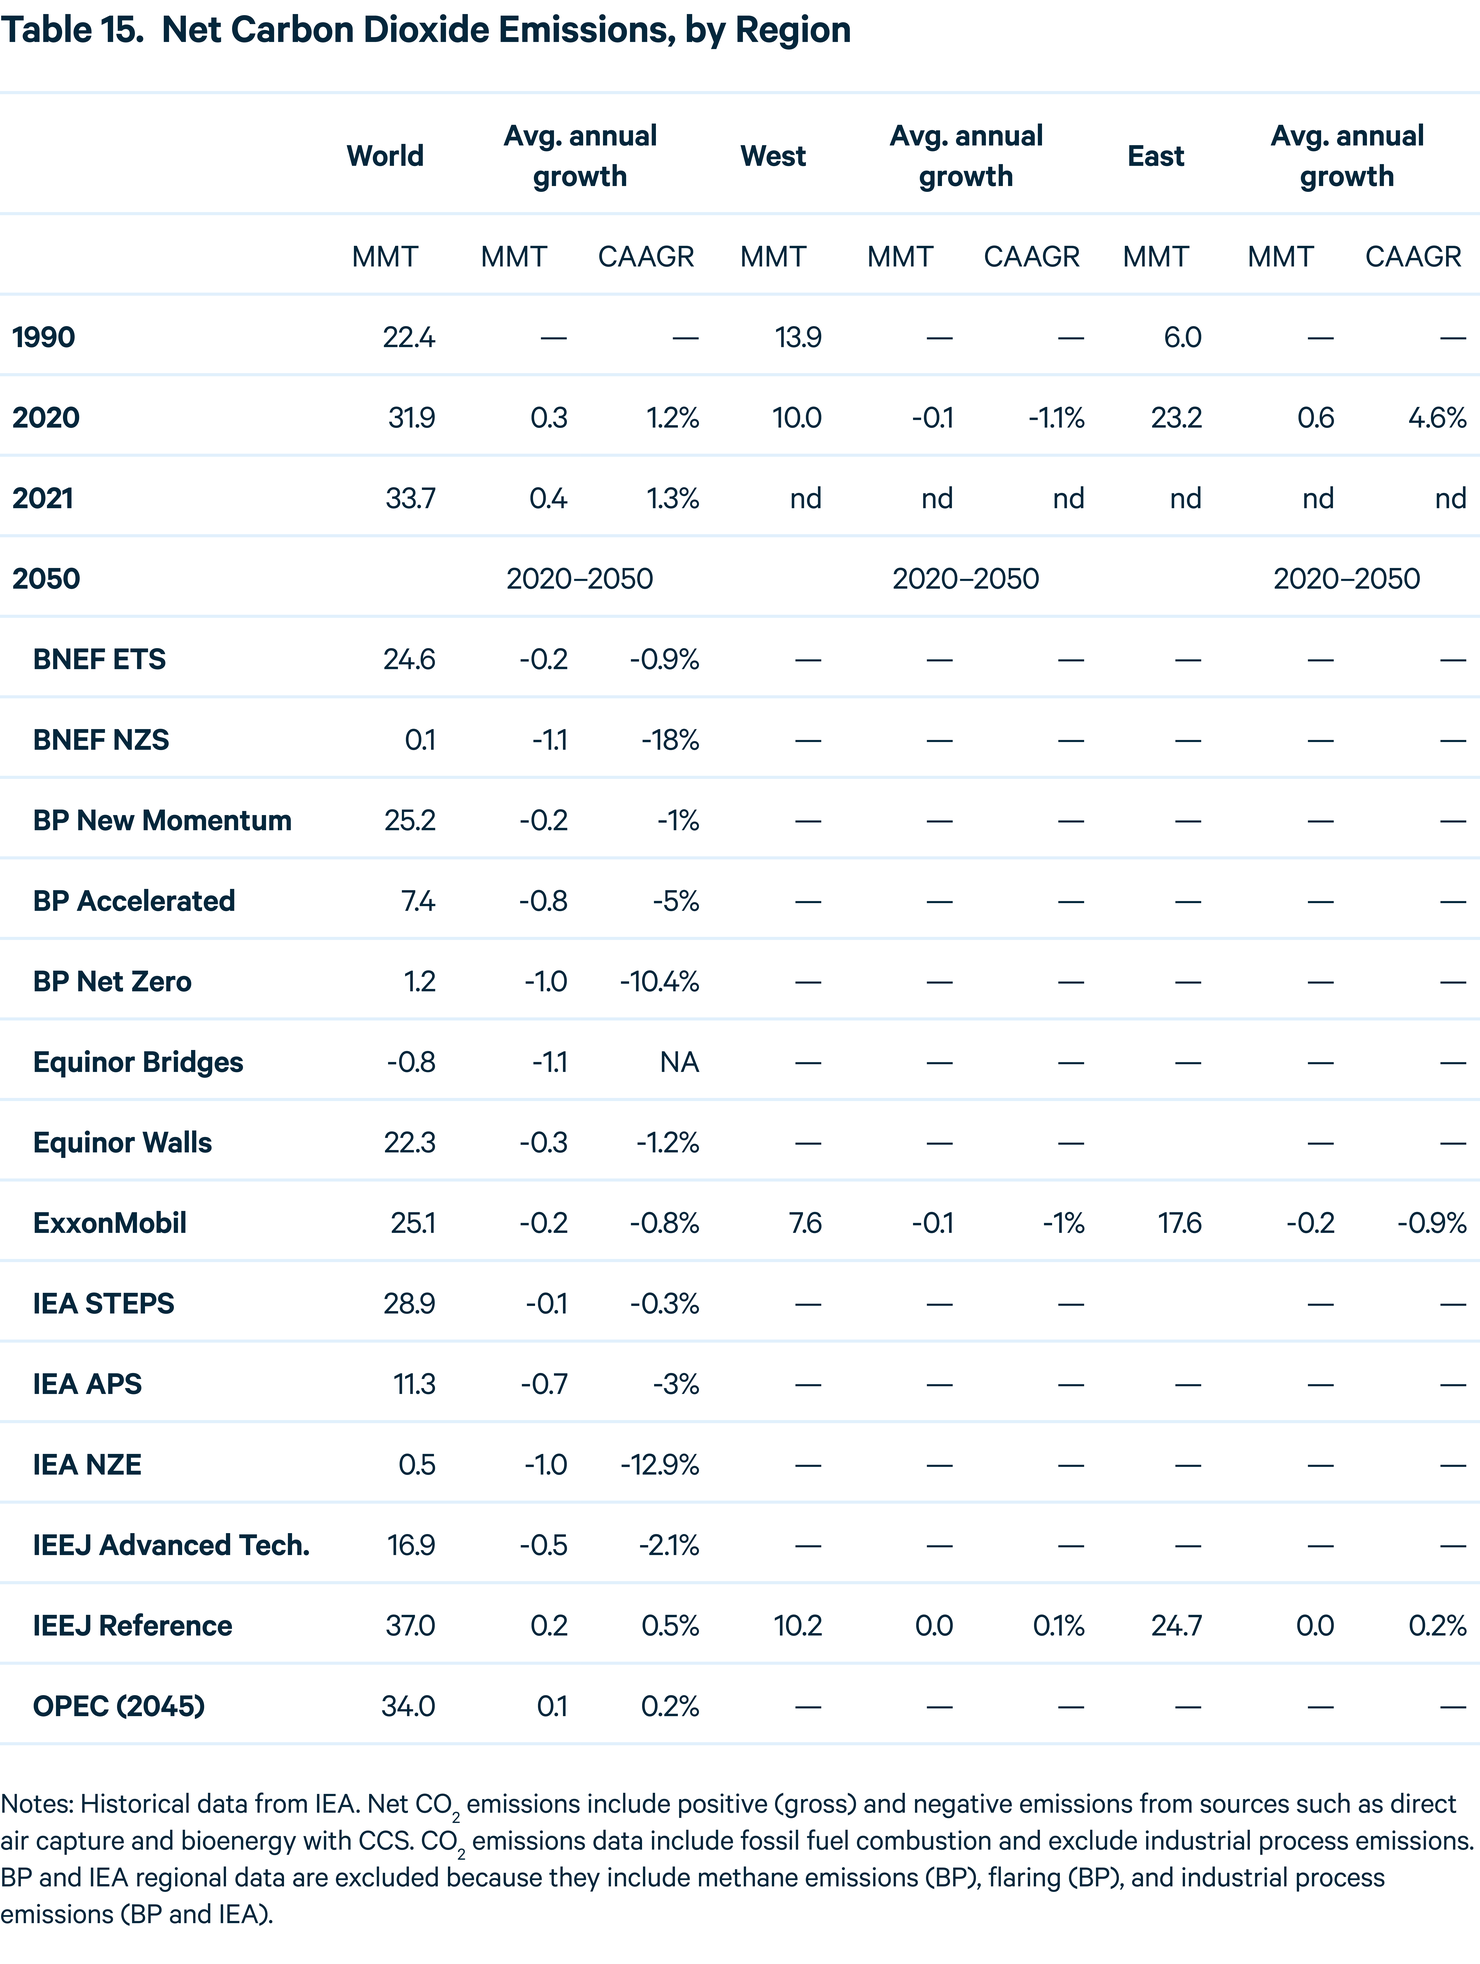
Negative emissions technologies (NETs)—such as direct air capture—and carbon capture and storage (CCS) play a large role in every Ambitious Climate scenario examined here. As long as fossil fuel use and greenhouse gas emissions remain high, achieving international targets of 1.5°C or 2°C by 2100 will become ever more reliant on large-scale NETs, CCS, and perhaps even more controversial technologies such as solar geoengineering.
Figure 3. Global Energy-Related CO2 Emissions
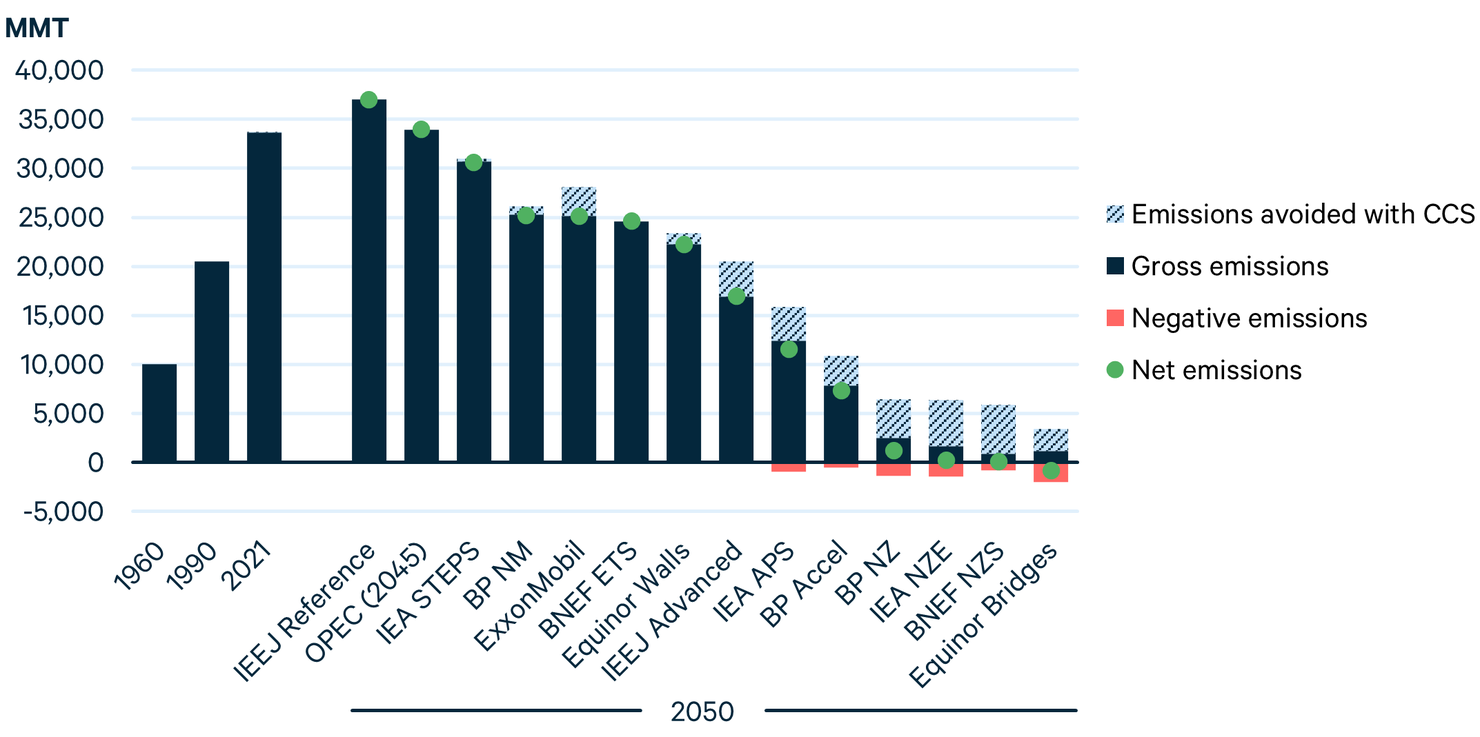
Over roughly the past 30 years, energy-related CO2 emissions grew by almost two-thirds. By 2050, less than 30 years from today, projections range from further emissions growth of 10 percent to emissions reductions of greater than 100 percent, as in Equinor’s Bridges, which envisions net-negative global CO2 emissions by midcentury.
CCS plays a substantial role in many scenarios, including some with relatively modest climate policy assumptions. By 2050, CCS is projected to capture at least 1 gigatonne of CO2 per year in Reference Scenarios from Equinor and ExxonMobil, Evolving Policies scenarios from IEA and bp, and all Ambitious Climate scenarios. The largest volumes of CCS are seen in the four 1.5°C scenarios, where annual capture rates exceed 5 gigatonnes (including NETs and CCS that avoid emissions)—more than all energy-related CO2 emissions from the United States in 2021.
Challenges associated with this scale of CCS deployment include costs, social acceptance of associated infrastructure, and protocols for monitoring, reporting, and verification to ensure that captured carbon remains safely stored for centuries to come.
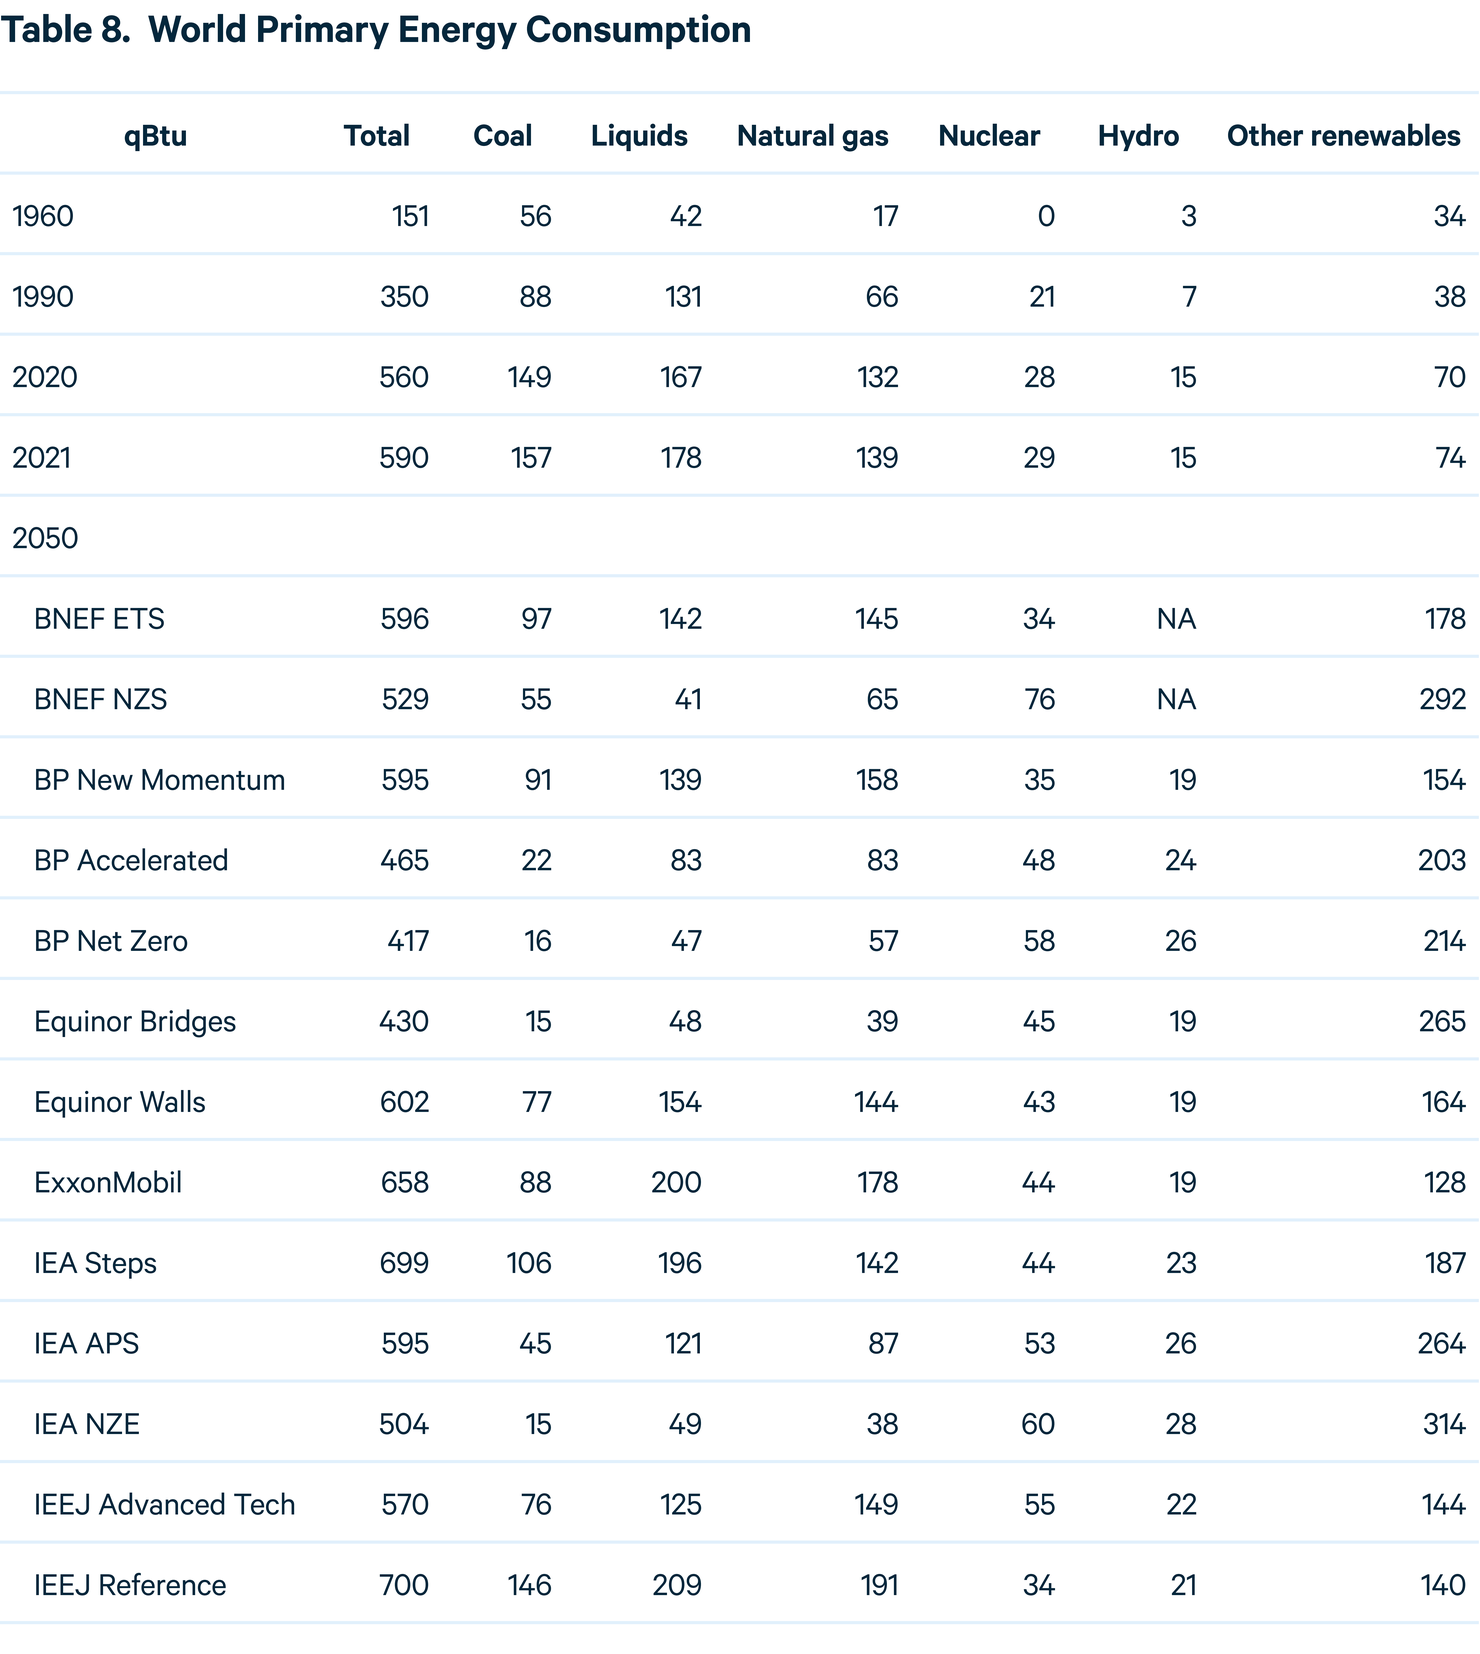
The future of global energy demand varies considerably depending on assumptions about technological innovation, energy efficiency, and government policy. Under several Reference and Evolving Policies scenarios, global energy demand rises to nearly 700 QBtu by midcentury. But under other scenarios, particularly those that achieve net-zero emissions by 2050, global energy demand declines considerably as global demand for energy services is met much more efficiently.
Figure 4.
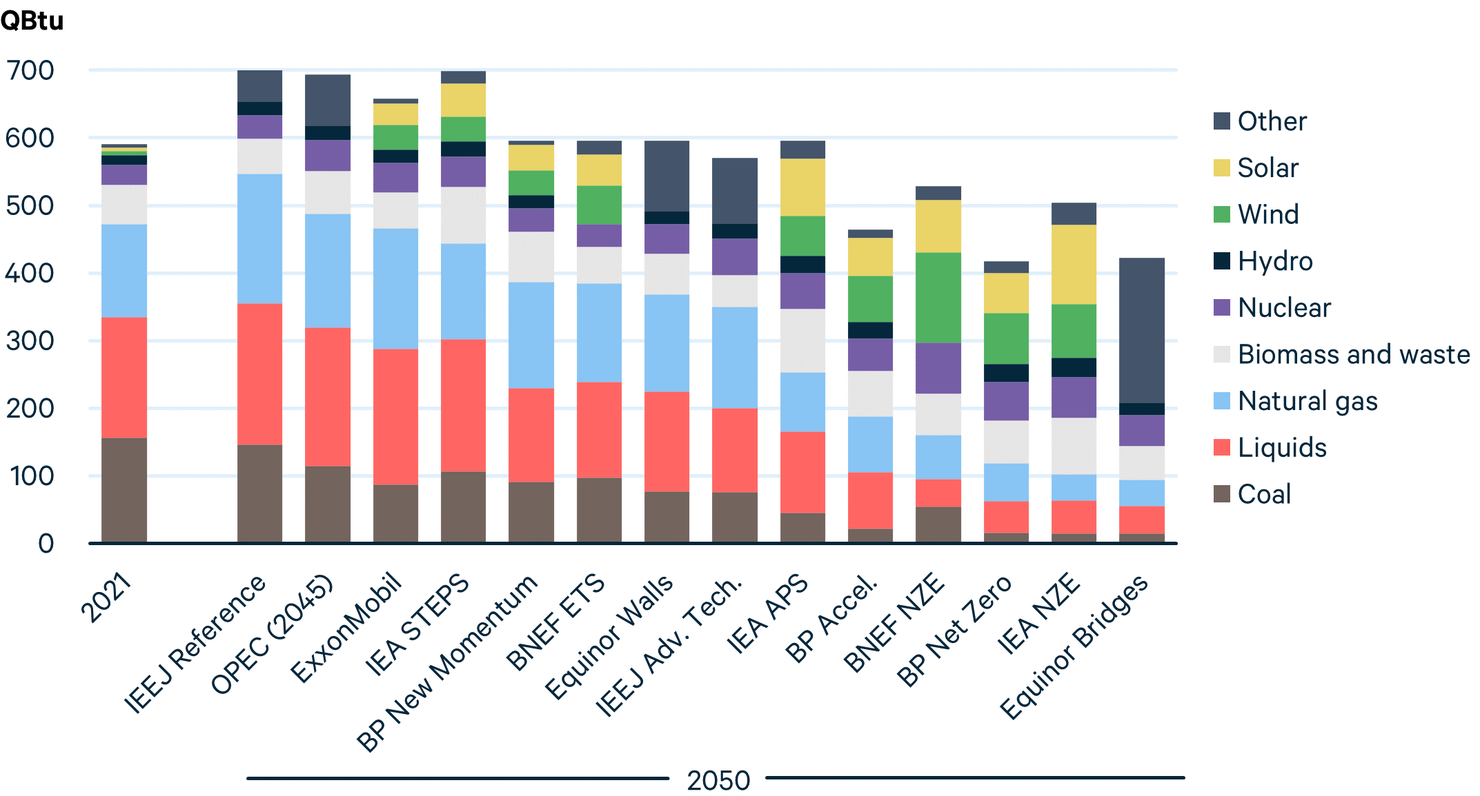
All scenarios envision lower coal consumption in 2050 than 2021, but liquids consumption is higher under four of the 14 scenarios considered here. Natural gas demand is higher in 2050 under eight scenarios. As in previous years, wind and solar grow at dramatic rates under all scenarios, but the range is quite wide. By 2050, wind and solar account for 10 percent (ExxonMobil) to roughly 50 percent (Equinor Bridges) of global primary energy demand.
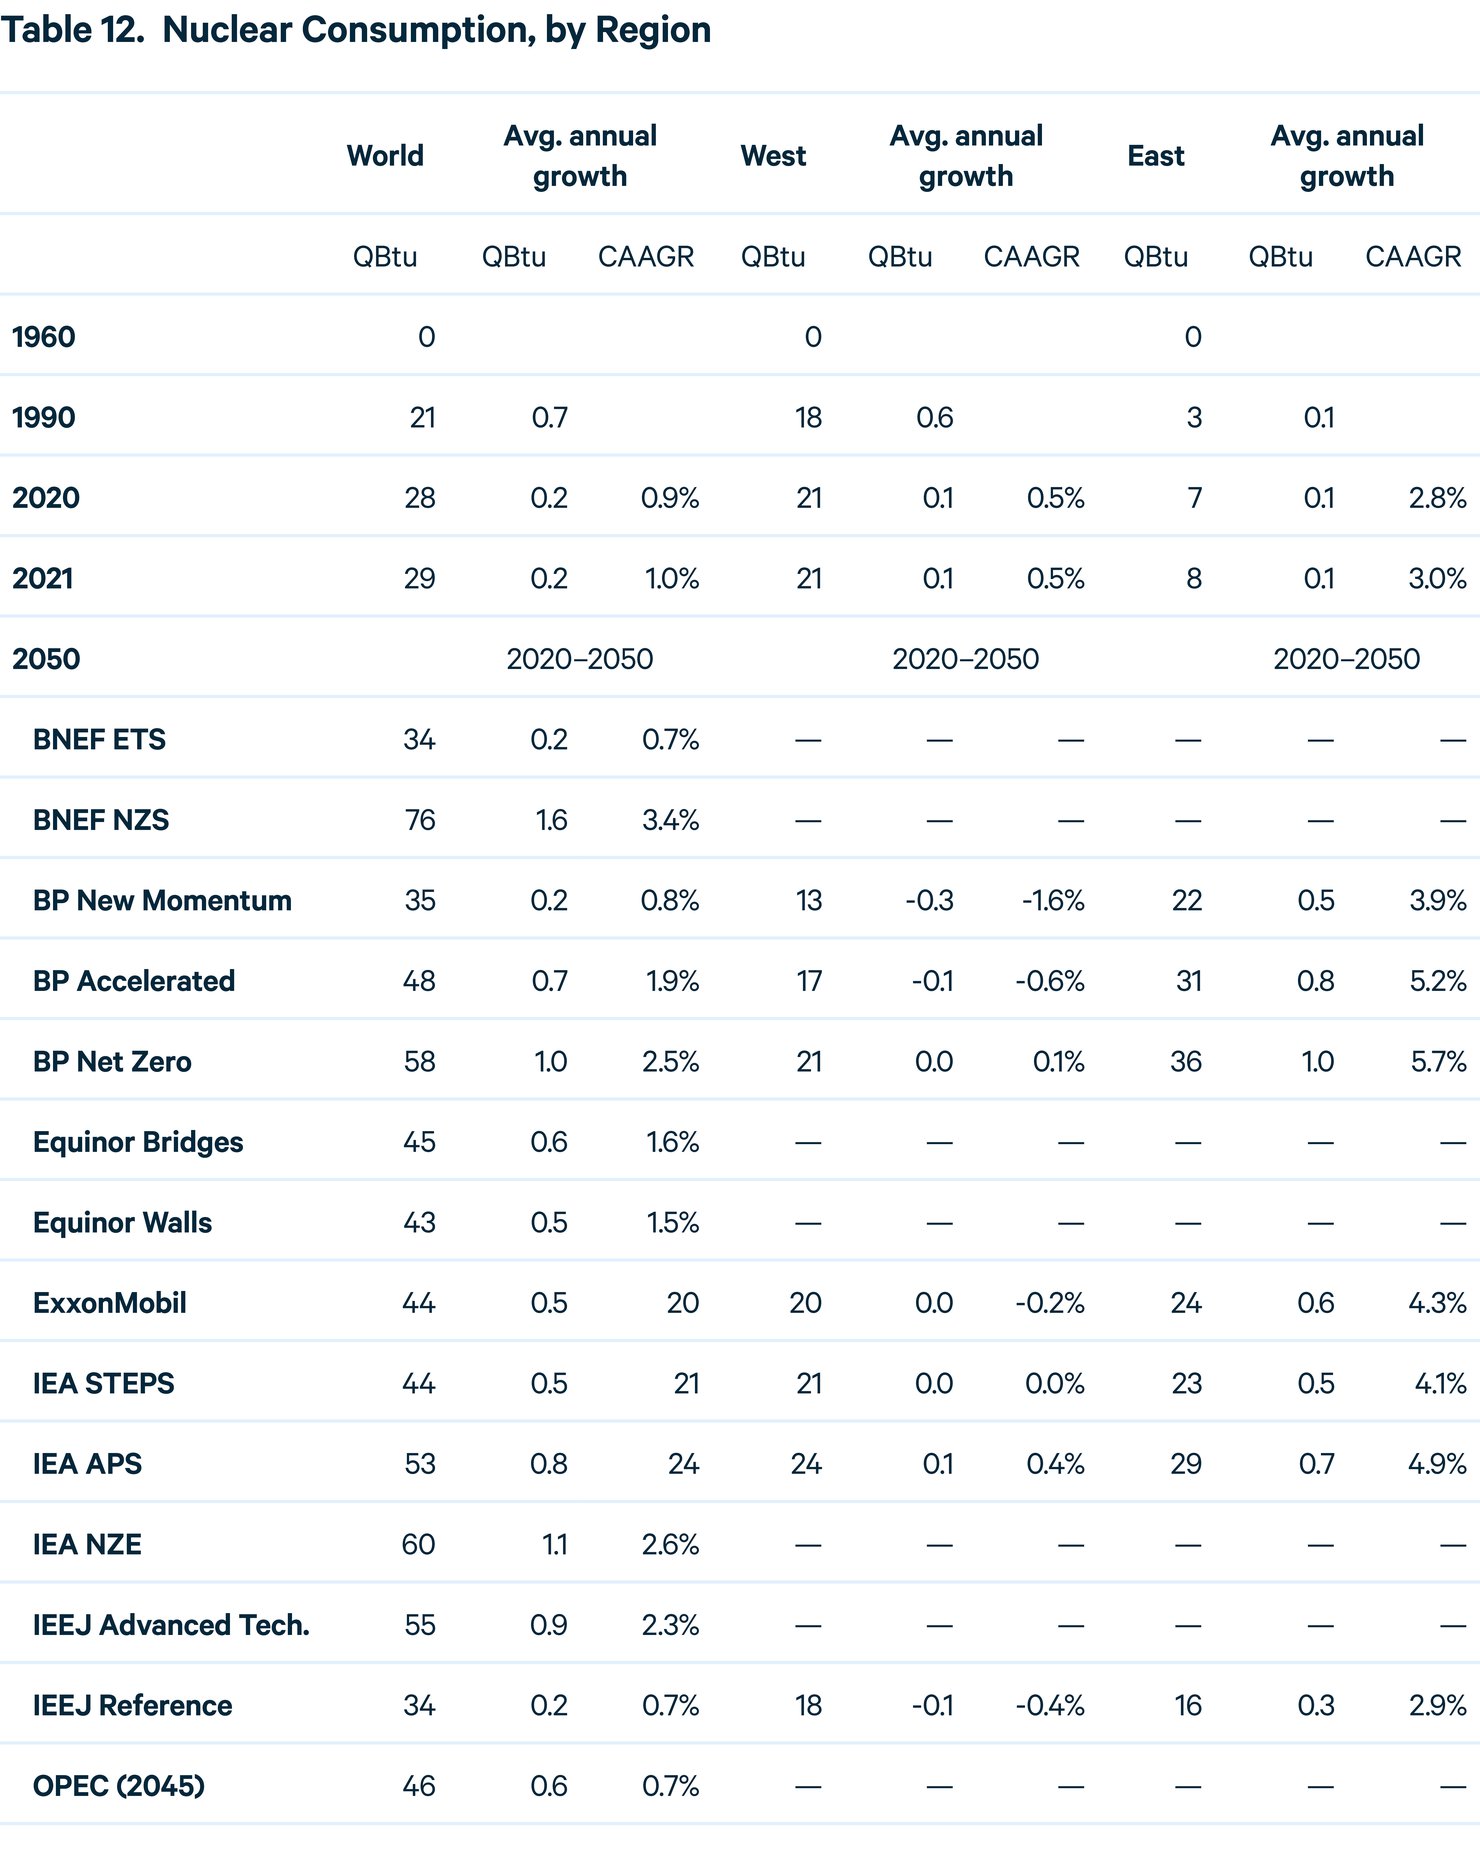
Recent announcements related to nuclear fusion technology have generated excitement across the energy world, but no outlooks examined here specifically consider its potential during the projection period. Compared with 5 percent in 2021, nuclear’s share in 2050 ranges from 5 percent (IEEJ Reference) to 14 percent (BNEF and BP Net Zero). Under three of the four net-zero scenarios, energy consumption from nuclear more than doubles by 2050, driven in some cases by the production of hydrogen for end uses in other sectors.
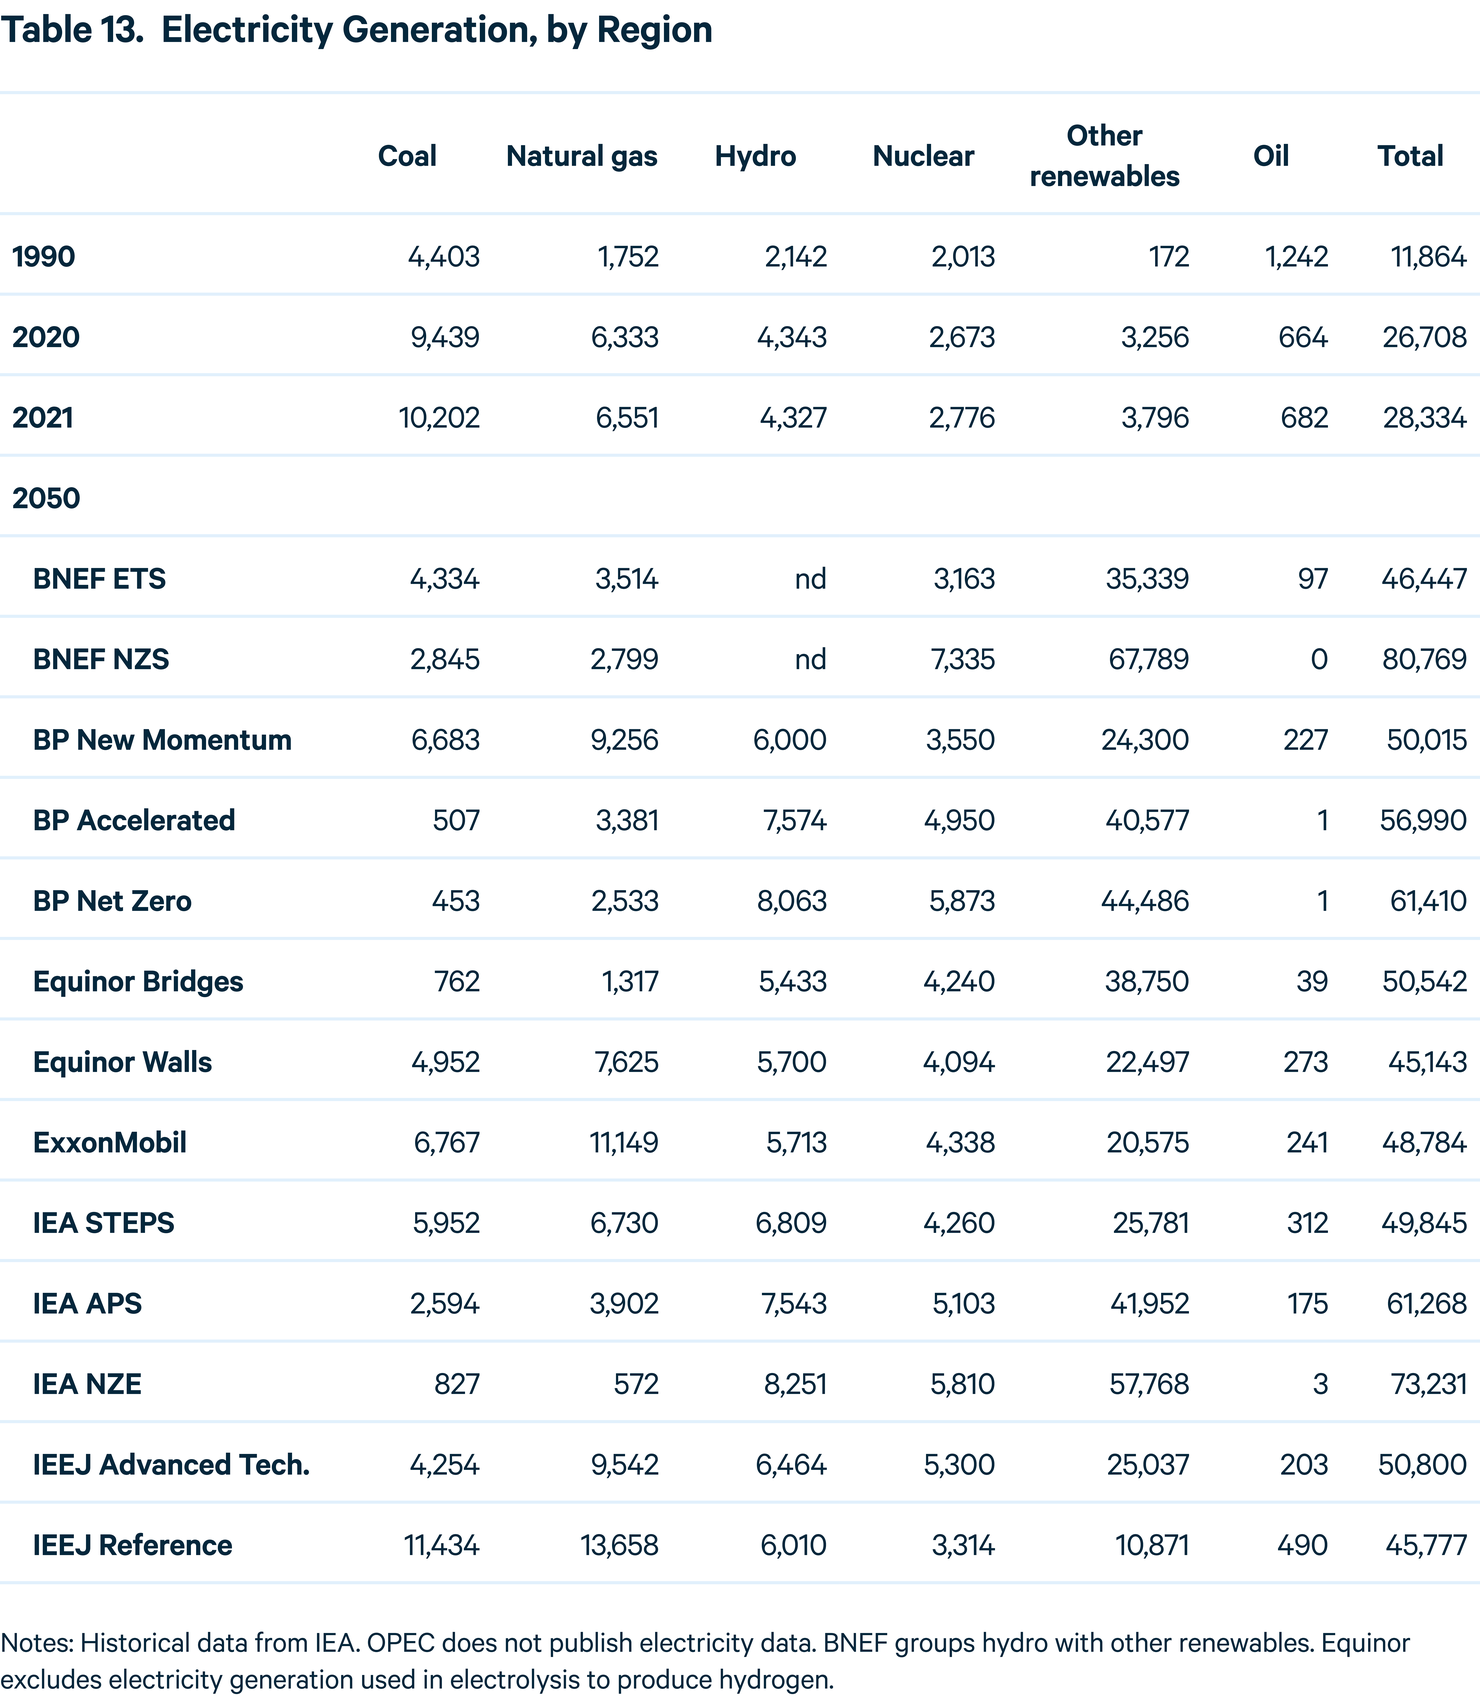
Global electricity demand is projected to grow between 62 and 185 percent by 2050 compared with 2021 levels. The share of fossil fuels in the electricity mix declines from 59 percent in 2021 to 2–55 percent by 2050, but in some Reference scenarios, the aggregate level of fossil fuels used for power generation grows. Under most Ambitious Climate scenarios, wind and solar together generate more electricity in 2050 than all sources combined in 2021. In two scenarios (BNEF NZE, IEA NZE), wind or solar alone produces more electricity than all sources globally in 2021.
Figure 5. World Electricity Mix
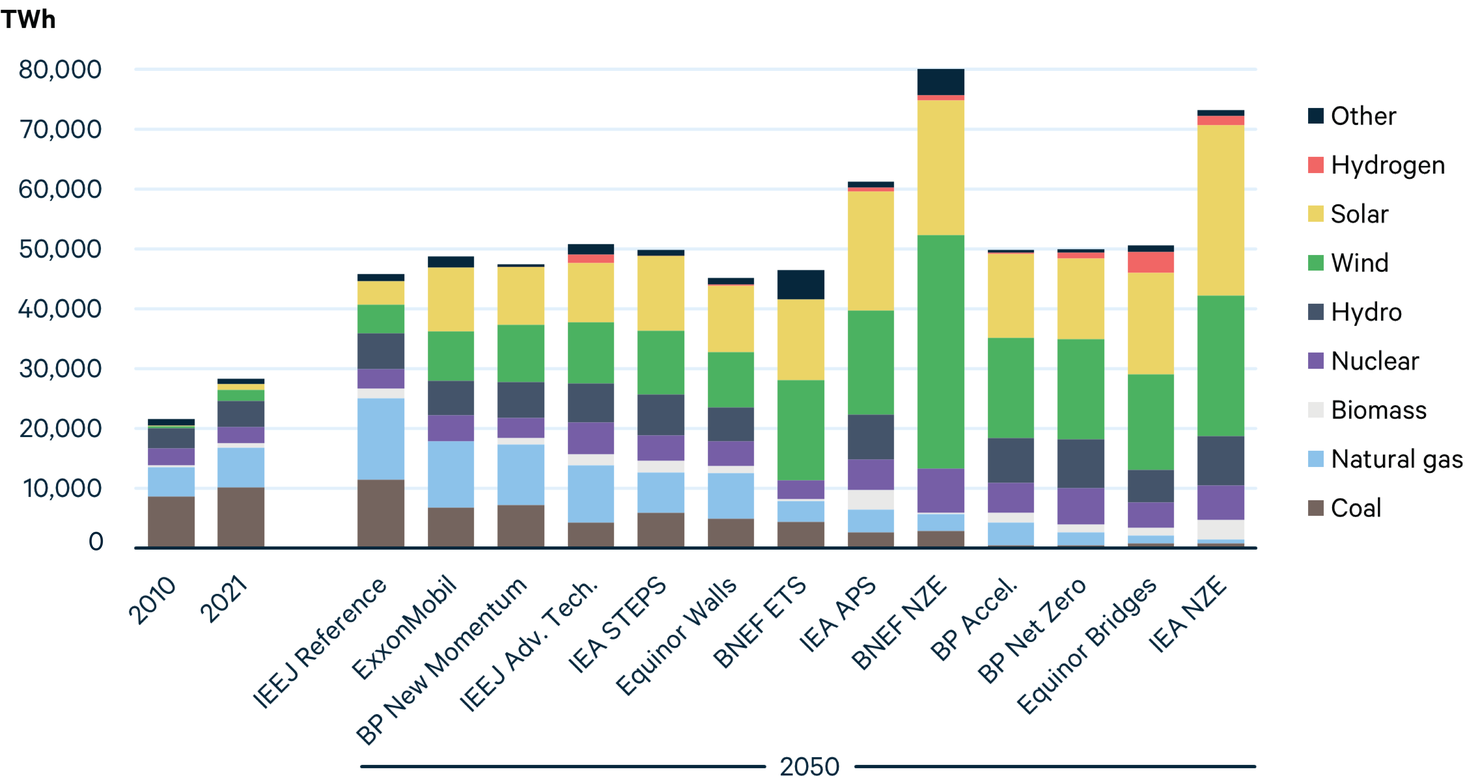
Under all scenarios other than IEEJ Reference, electricity from coal, today’s largest generation source, declines considerably by 2050, while natural gas consumption falls in just over half of the scenarios. Under most Ambitious Climate scenarios, use of coal and natural gas continues in the power sector through midcentury but is paired with CCS to reduce emissions.
In some outlooks, hydrogen begins to play a substantial role in the power sector by midcentury, exceeding 1,000 TWh of global generation by 2050 in four scenarios (BP Net Zero, Equinor Bridges, IEEJ Advanced Technology, and IEA NZE). However, most scenarios that envision a major role for hydrogen in the future energy system project its playing a more substantial role for other applications, particularly industrial heat and long-distance transportation.
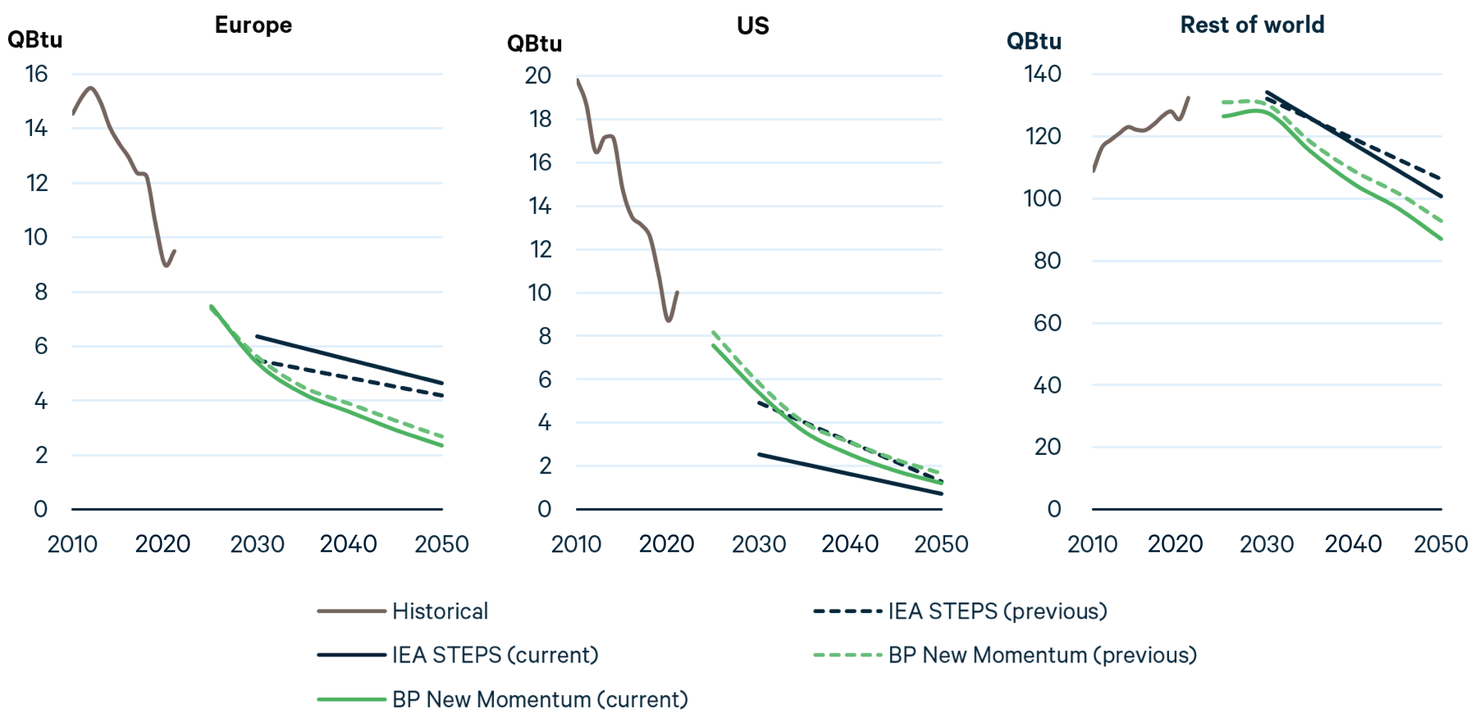
Russia’s invasion of Ukraine has reinforced Europe’s efforts to reduce fossil fuel consumption and associated CO2 emissions. In the United States, the passage of the Inflation Reduction Act is also expected to shift the energy system away from fossil fuels and toward cleaner sources. The effects of these shifts in Europe and the United States can be seen by comparing natural gas demand in last year’s projections (2022 for BP and 2021 for IEA) with the most recent outlooks. What’s more, projections for natural gas demand in the rest of the world are considerably lower than in the equivalent scenarios from last year.
Figure 6. Previous and Current Projected Natural Gas Demand from BP and IEA
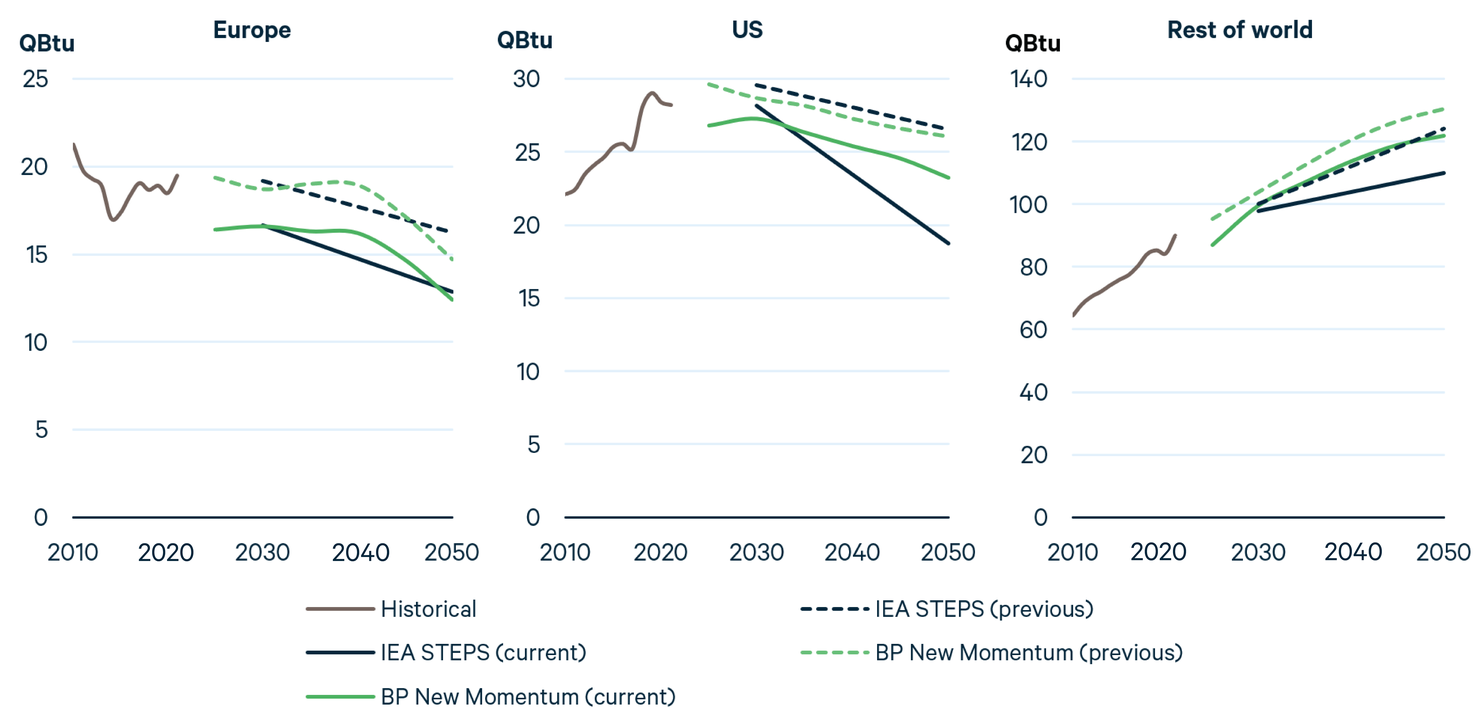
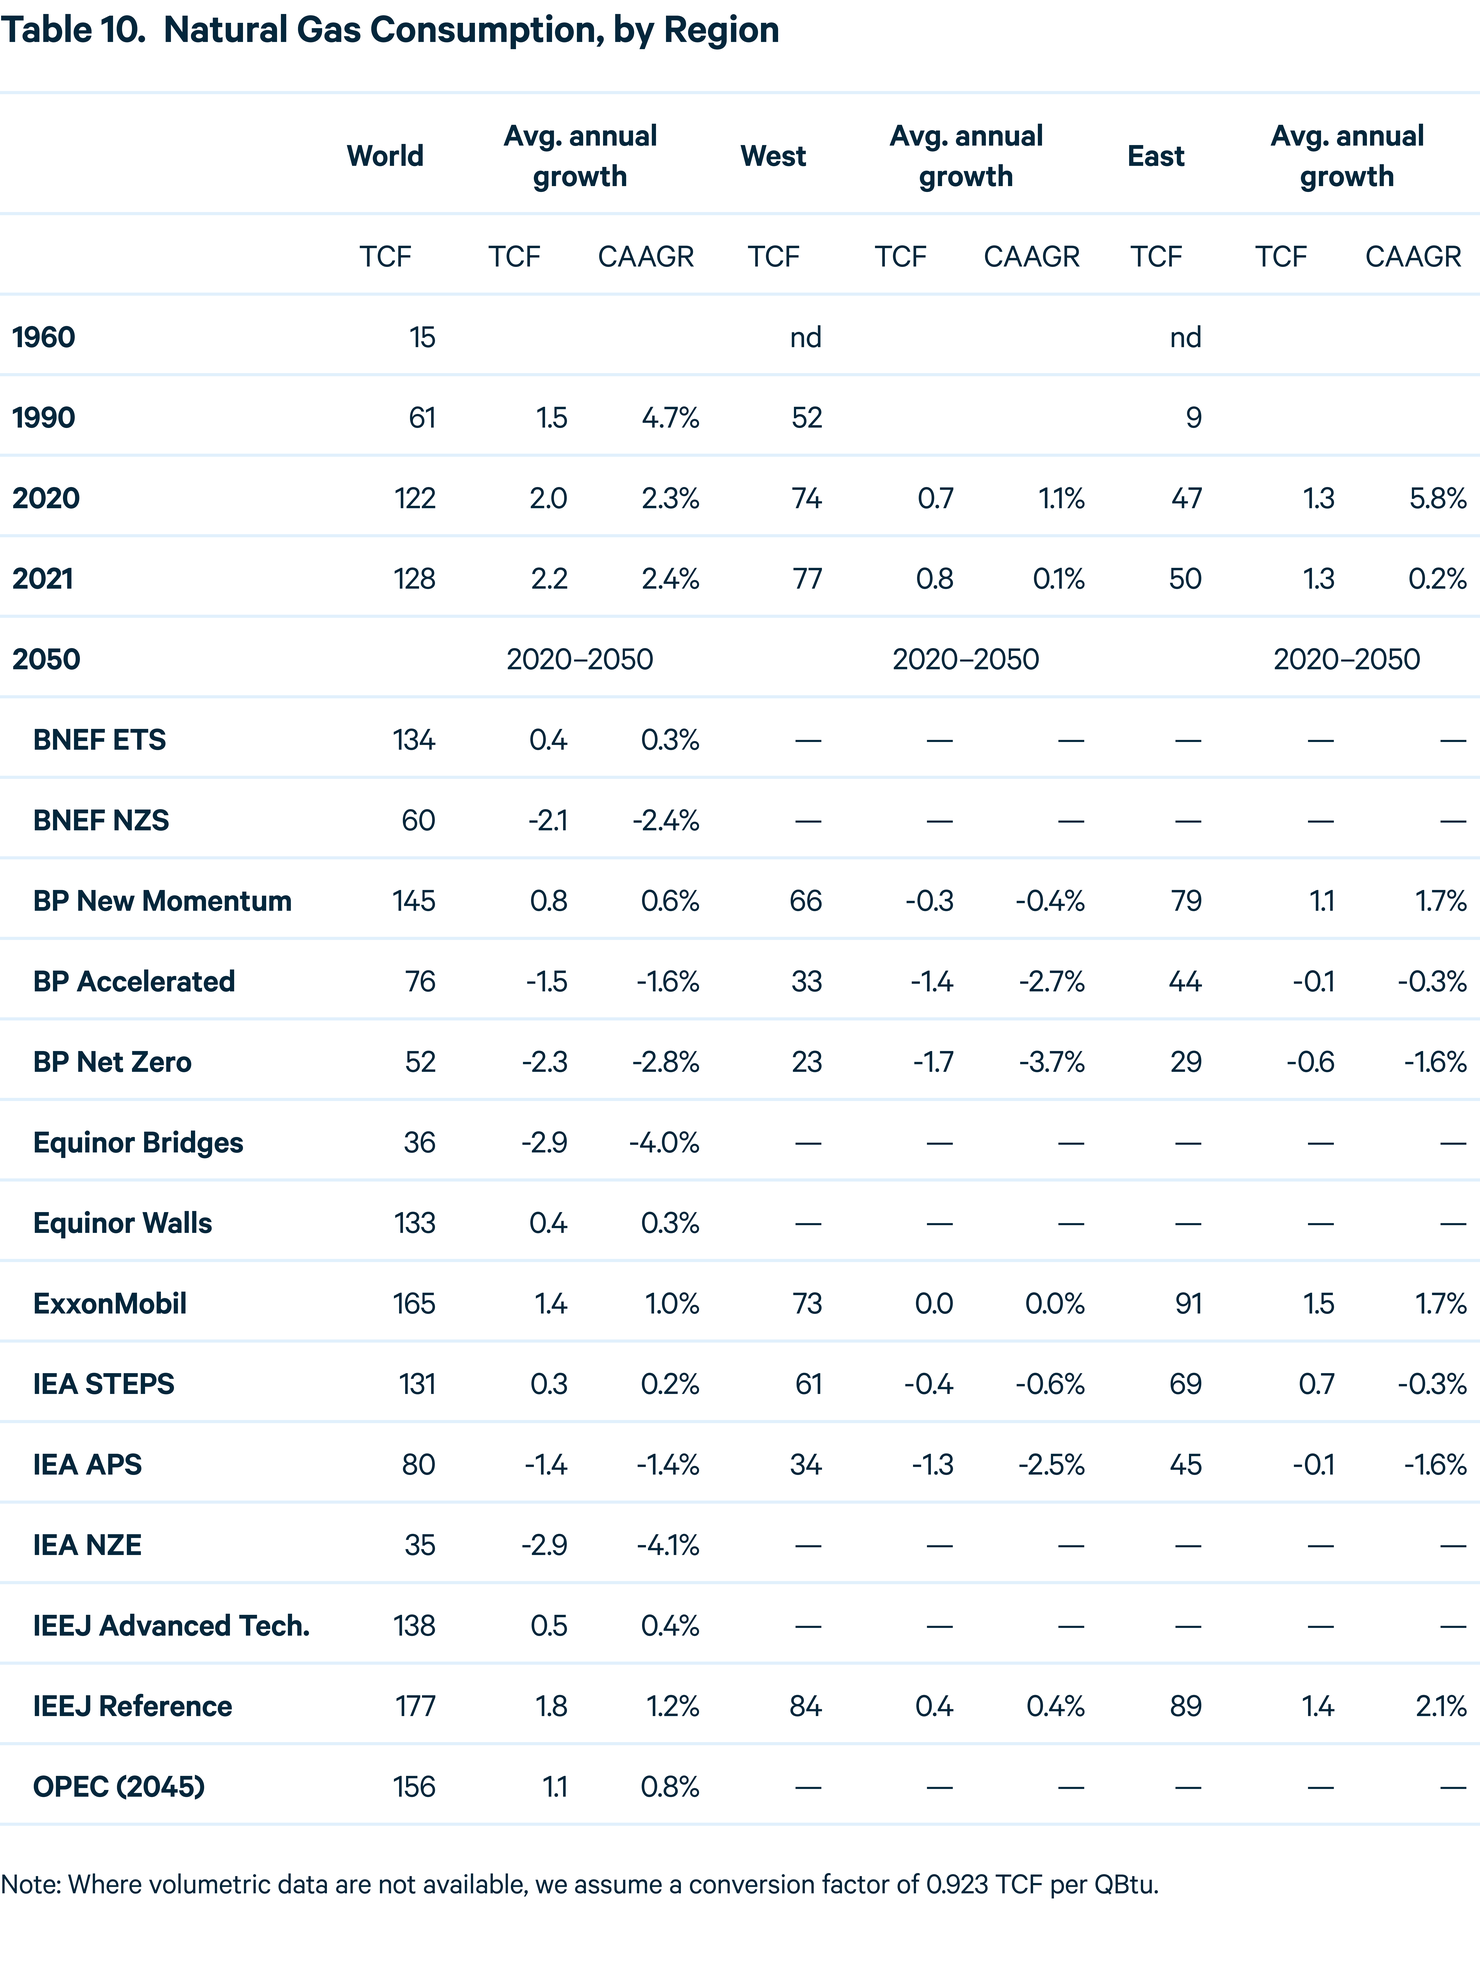
How do these projections compare with those from a decade ago? Consider IEA’s 2012 New Policies Scenario (NPS, roughly equivalent to today’s STEPS), which projected that global natural gas demand in 2020 would be 130 QBtu. In 2021, global demand exceeded this projection by roughly 6 percent, reflecting a growing market for global liquefied natural gas and abundant low-cost supplies of shale gas in the United States, among other things.
The 2012 IEA NPS projected global natural gas demand of 152 QBtu in 2030. This year’s projections, however, envision much slower or even declining growth, reaching 143 Qbtu under IEA STEPS and falling to 126 Qbtu under the IEA APS by 2030.
Although they are well below projections from a decade ago, the current Evolving Policies scenarios envision substantially higher natural gas demand than the levels associated with achieving international climate goals. For example, global natural gas demand in 2050 in Reference and Evolving Policies scenarios ranges from 142 to 191 QBtu, about three times the level envisioned in Ambitious Climate scenarios, which fall between 38 and 65 QBtu by 2050.
Global demand for coal has also been revised downward this year. However, near- and medium-term concerns over natural gas supplies have resulted in an upward revision for Europe in the IEA’s STEPS and little change in BP’s New Momentum scenario. The transition away from coal is particularly sharp in the United States, where 2030 demand under this year’s IEA STEPS is projected to be roughly half the level projected just last year.
Figure 7. Previous and Current Projected Coal Demand from BP and IEA
Outside Europe and the United States, projections of future coal demand have also been revised downward in IEA STEPS and BP New Momentum. Although global coal demand was projected to begin declining by 2030 or before under last year’s scenarios, that decline occurs more quickly in this year’s projections.
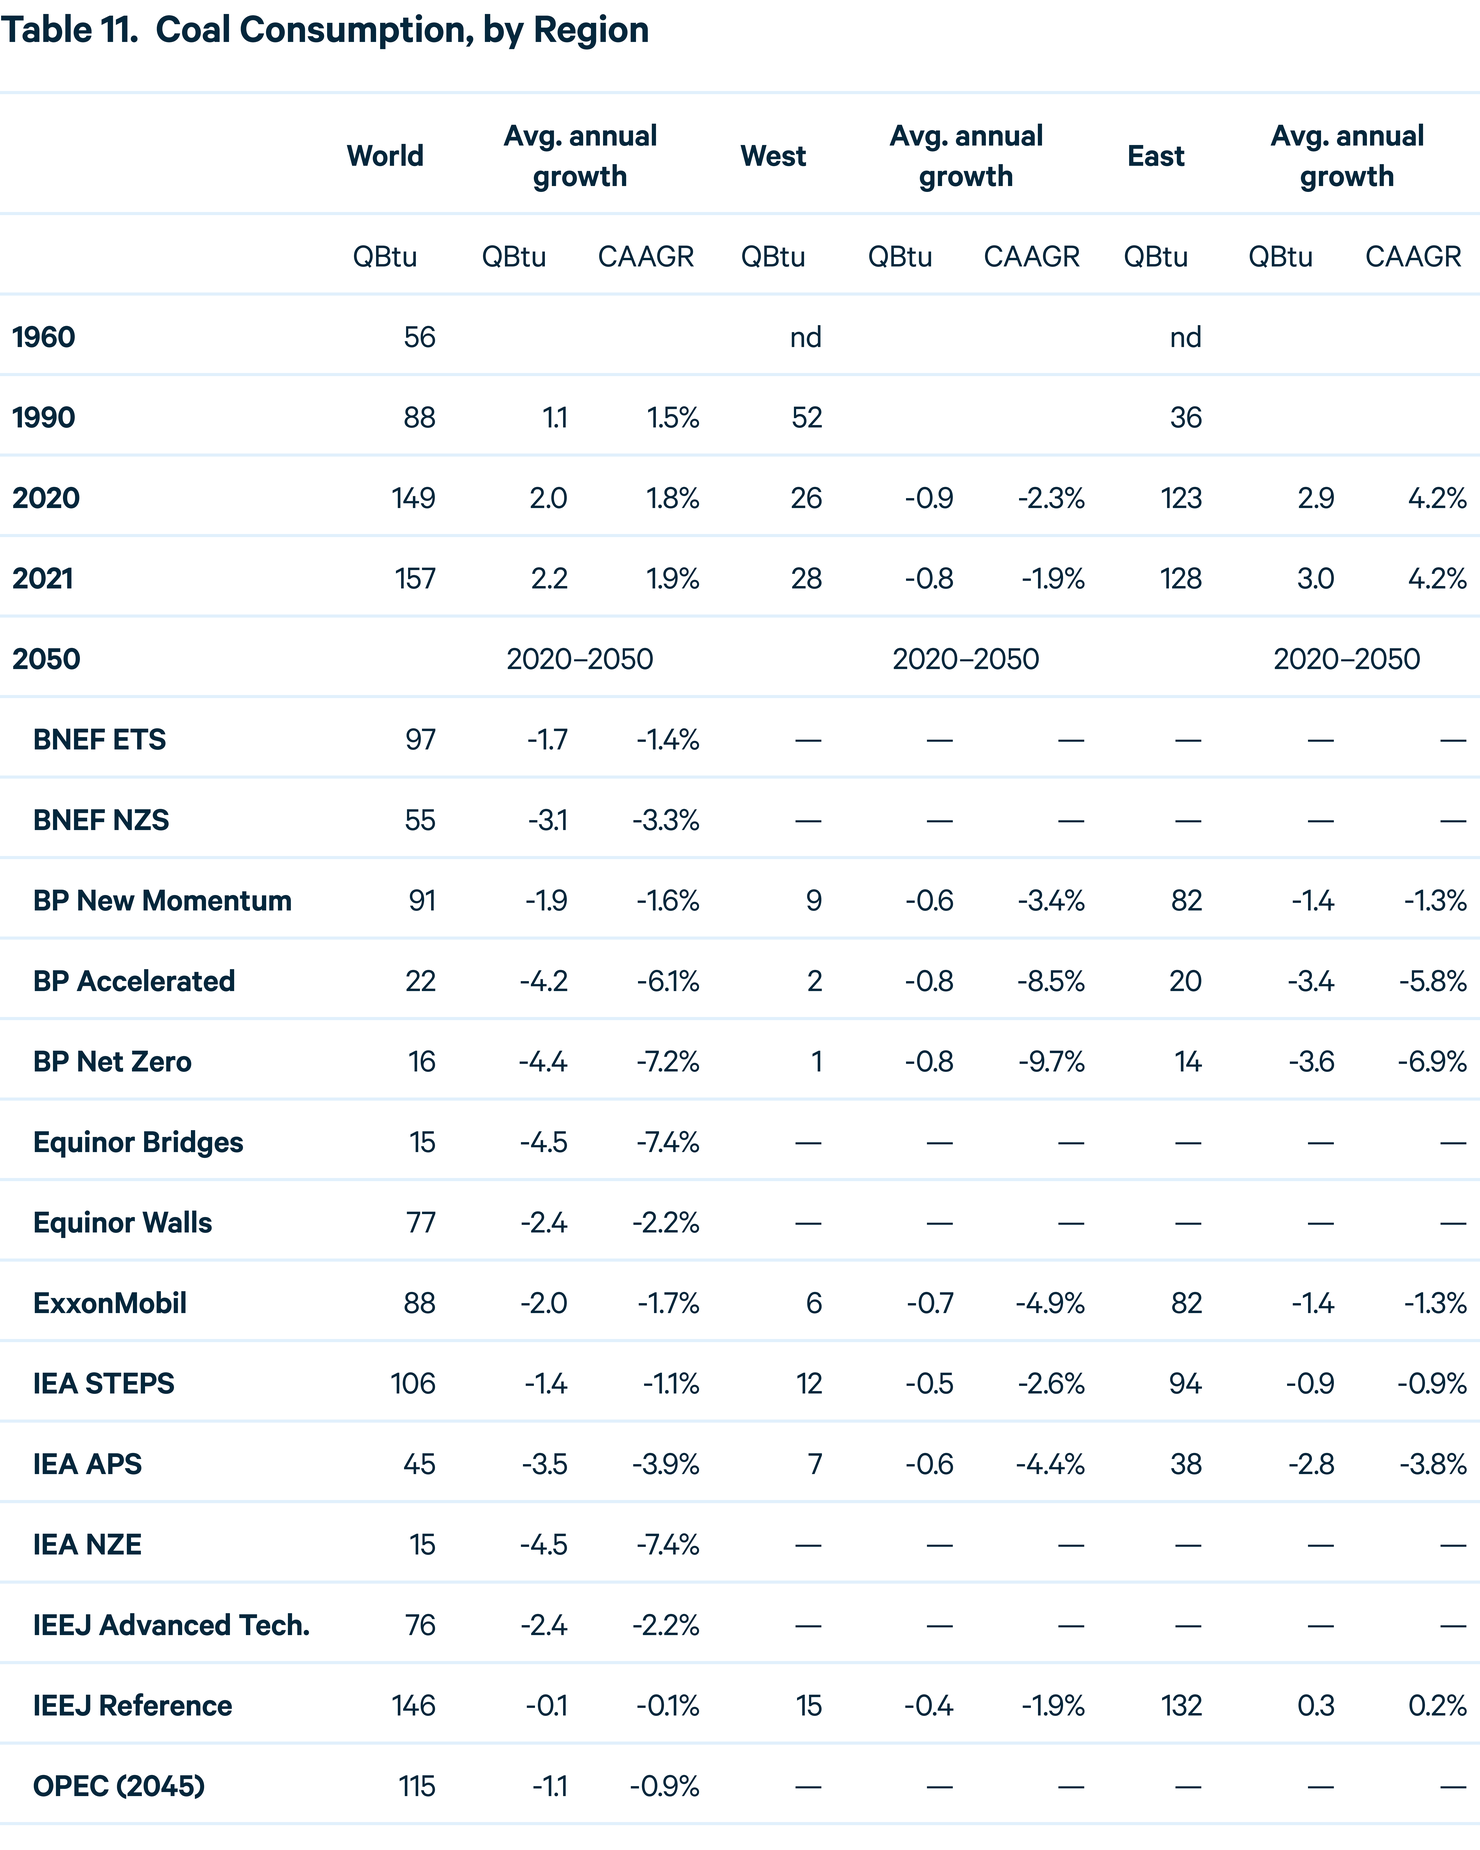
Expectations for future coal demand have changed even more significantly during the past decade. In 2012, the IEA NPS projected global coal demand of 162 QBtu in 2020, which is roughly 7 percent higher than the actual amount consumed in 2021 (2020 demand was even lower, but this was largely due to the effects of the COVID-19 pandemic). By 2030, the 2012 IEA NPS projected global coal demand rising to 166 QBtu. However, no scenario examined here reaches this level by 2030. The highest projection for global coal demand in 2030 comes from IEEJ’s Reference scenario, which reaches 156 QBtu in that year.
Nonetheless, the projected coal demand in Reference and Evolving Policies scenarios vastly exceeds the levels needed to limit global warming to 1.5°C or 2°C by 2100. In 2050, most Ambitious Climate scenarios project global coal demand between 15 and 17 QBtu, compared with a range from 77 to 156 QBtu under Reference and Evolving Policies scenarios.
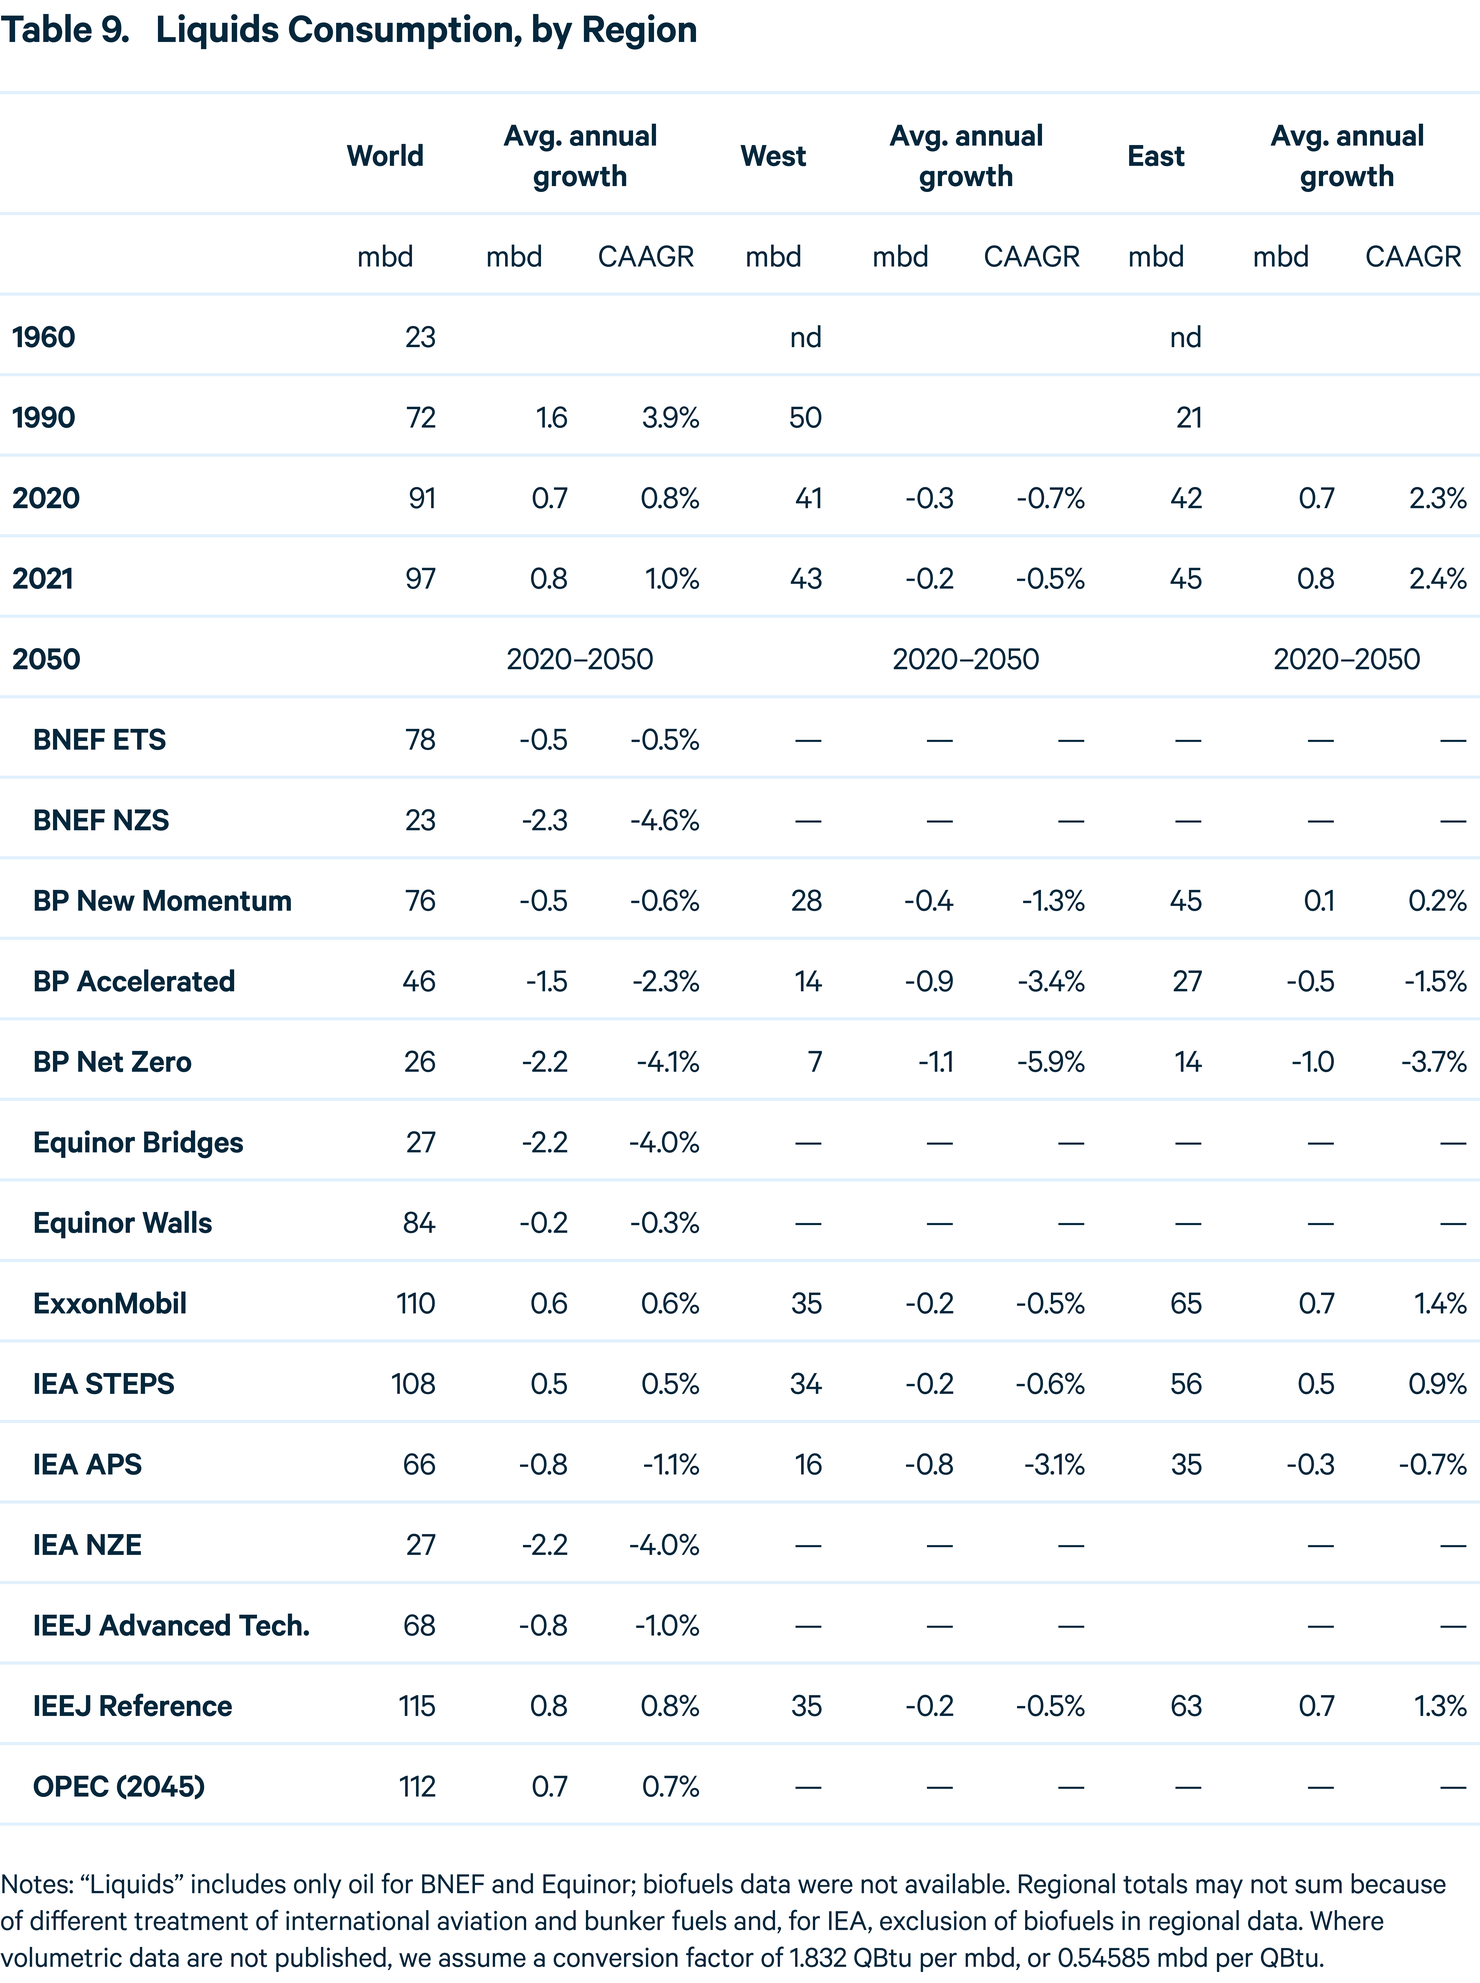
Under most scenarios, global oil demand is considerably lower by 2050 than it is today. Under Reference scenarios from ExxonMobil, IEEJ, and OPEC, oil consumption plateaus in the 2030s and remains at or above 100 mb/d through 2050, a level that is incompatible with achieving international climate targets. Evolving Policies scenarios illustrate a fairly wide range of future consumption, but scenarios that limit global temperature rise to 1.5°C by 2100 project that oil demand falls to roughly 20 to 25 mb/d by midcentury.
Figure 8. World Oil Demand
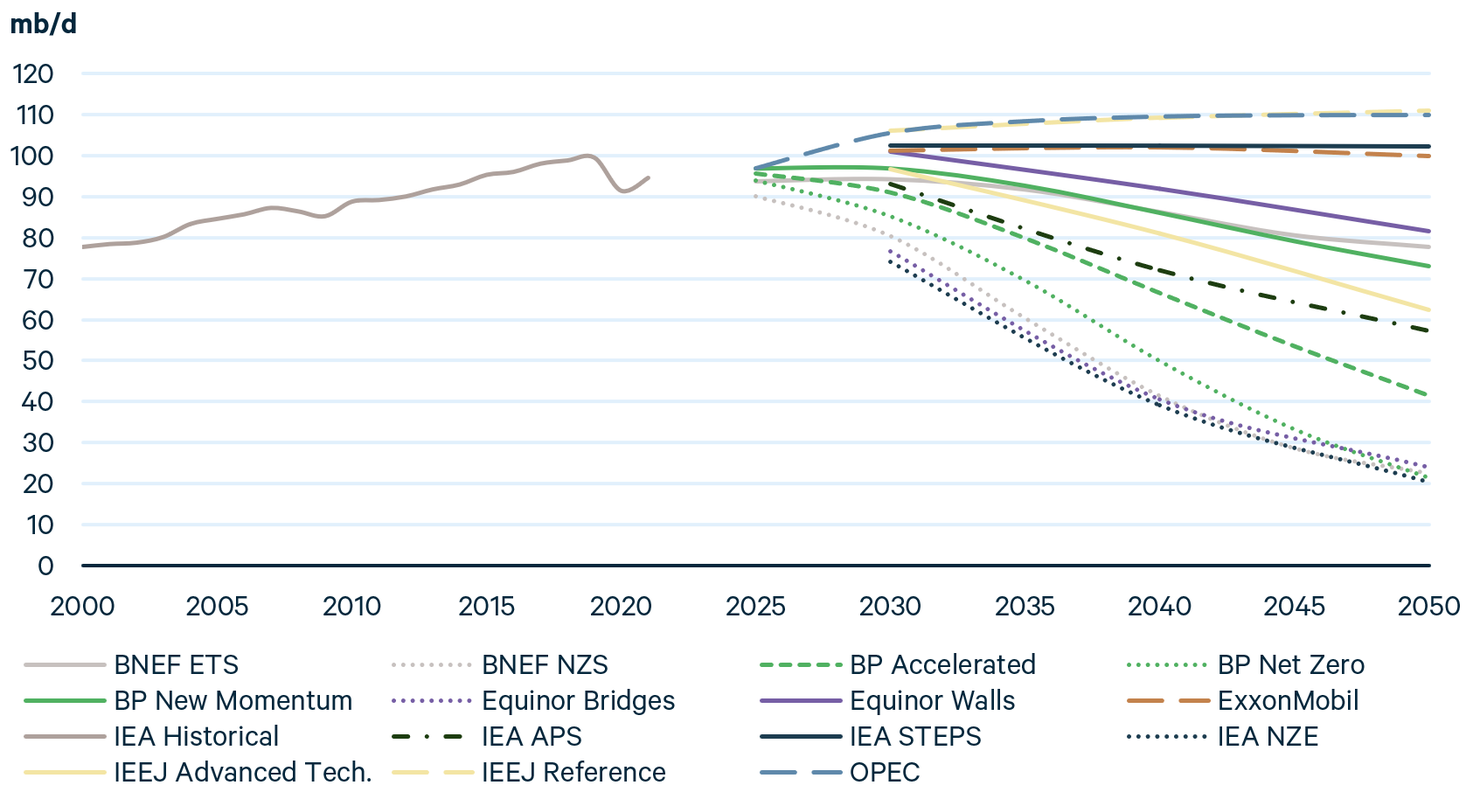
Future oil demand varies considerably across regions and scenarios. For example, all three of BP’s and IEA’s scenarios project demand in the Asia-Pacific region to peak by 2030 and then decline, whereas Reference scenarios from ExxonMobil and IEEJ project regional demand growth through 2050. In China, demand peaks by 2030 under all scenarios other than OPEC’s Reference case (ExxonMobil does not publish China-specific projections). In India, demand grows under all Reference and Evolving Policies scenarios but begins declining in the 2030s or 2040s under Ambitious Climate scenarios.
In North America, oil demand peaks in 2025 to 2030 and falls under all scenarios. However, the rate of decline varies dramatically between scenarios. By 2050, North American oil demand ranges from highs around 16 mb/d under ExxonMobil’s Reference and IEA STEPS to lows of just 3 mb/d under Ambitious Climate scenarios. In Latin America, demand remains relatively flat through 2050 under Reference and Evolving Policies scenarios but falls by more than half under most Ambitious Climate scenarios.
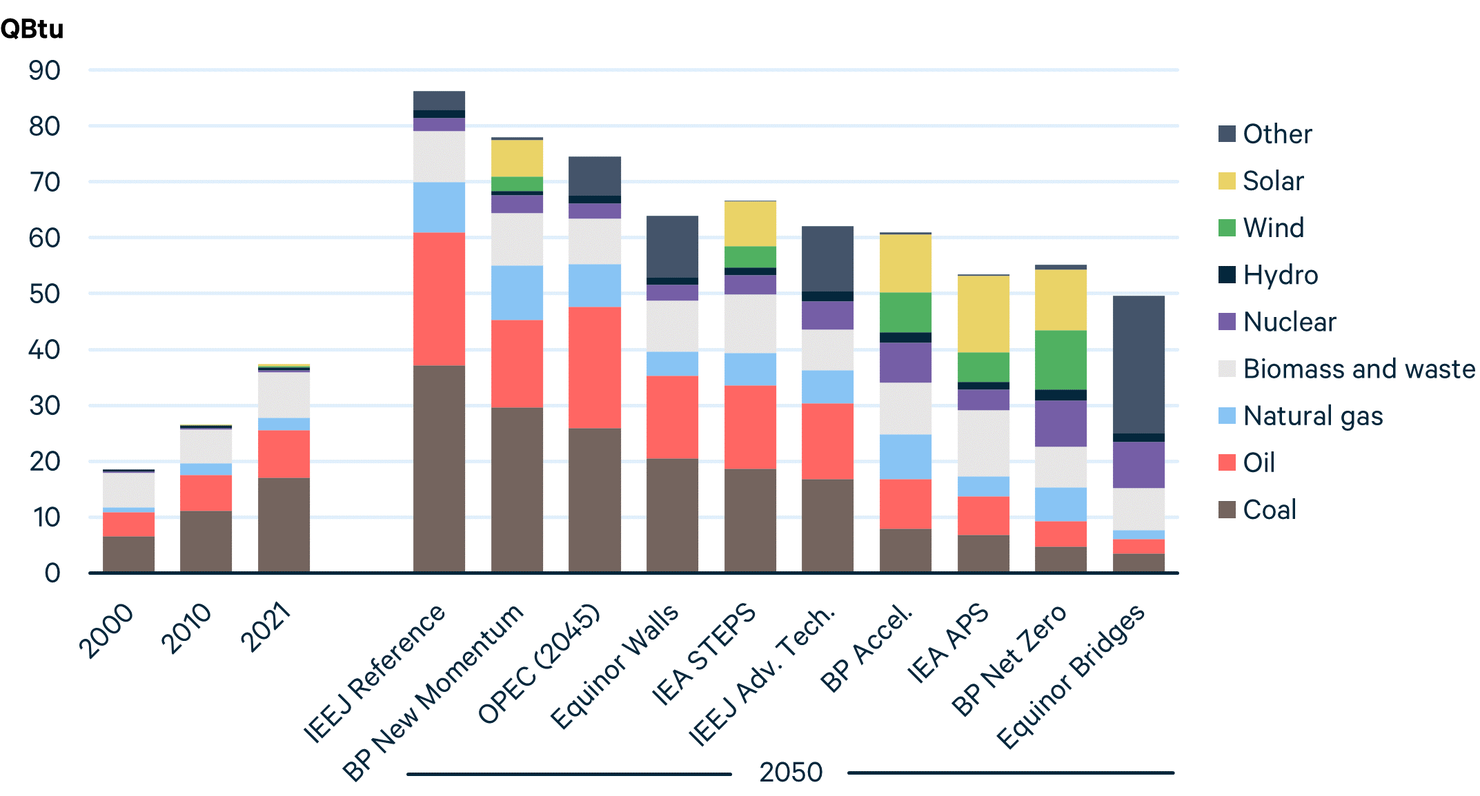
Energy demand in China has spiked over recent decades, roughly tripling since 2000. However, China’s population is expected to begin declining in the years ahead, reducing the projected rate of economic growth. As a result, primary energy demand in China is lower by midcentury under most scenarios examined here, particularly the Ambitious Climate scenarios. This is a marked change from last year, when more than half of scenarios projected considerable growth in demand by midcentury.
Figure 9. Primary Energy Demand in China
By 2050, coal demand in China is projected to be well below 2021 levels, falling by 28 percent (IEEJ Reference) to 93 percent (BP Net Zero). China’s oil demand also declines considerably in all scenarios except OPEC Reference. Under IEA STEPS and APS, oil demand by 2050 falls by 8 and 48 percent, respectively, highlighting the gap between China’s current and expected government polices and announced climate goals. Under Ambitious Climate scenarios, China’s oil demand declines by roughly 60 to 80 percent. Natural gas also declines considerably under Ambitious Climate scenarios but grows under most other scenarios.
Nuclear in China grows dramatically under all scenarios. In 2021, nuclear accounted for roughly 3 percent of China’s primary energy mix. By 2050, the absolute level of nuclear power more than triples under most scenarios and accounts for roughly 10 percent of the mix under Evolving Policies scenarios, such as IEA STEPS. Nuclear’s share is even higher under Ambitious Climate scenarios, contributing 13 to 22 percent of China’s primary energy by 2050.
Wind and solar account for the bulk of renewables growth in China, with more modest growth from hydropower. Compared with 3 percent in 2021, wind and solar are projected to contribute 15 percent or more of China’s primary energy by 2050 in scenarios that report these data.
In 2023, India is expected to surpass China to become the world’s most populous nation. As it continues to grow and modernize, India’s energy demand is projected to grow under all scenarios examined here. The composition of that growth, however, varies widely across scenarios. Under Reference and Evolving Policies scenarios, India’s demand for all fossil fuels grows through 2050, but under Ambitious Climate scenarios, it mostly declines.
Figure 10. Primary Energy Demand in India
In 2021, India’s energy mix was dominated by coal (46 percent), oil (23 percent), and biomass (22 percent). By 2050, India’s coal demand grows under half of the scenarios examined here, ranging from more than doubling (IEEJ Reference) to falling by 80 percent (Equinor Bridges). Oil demand increases under all but three scenarios, one of which is the IEA APS, which indicates the ambition of India’s announced (but not yet implemented) efforts to reduce emissions.
India’s use of biomass energy, which has been dominated by traditional biomass (i.e., locally gathered and combusted materials such as wood and dung), stays at a fairly consistent level, around 8 to 10 QBtu under most scenarios. However, this consistency masks considerable changes as traditional biomass is displaced by modern bioenergy (e.g., wood pellets, biofuels) in certain sectors of the economy.
Nuclear, wind, and solar grow dramatically in India under all scenarios. These three sources combined accounted for just 3 percent of India’s primary energy mix in 2021. By 2050, they grow to 15 percent or more under most scenarios, reaching as high as 50 to 60 percent of India’s energy mix under Ambitious Climate scenarios from BP and Equinor.
3. In Focus
3.1. Whither Peak Oil and Gas Demand?
An energy transition that addresses climate change must involve shifting energy demand away from oil and gas, but prospects for the repeatedly predicted time of “peak oil” have remained elusive. Both IEA’s and BP’s scenarios have long featured steadily increasing consumption of both oil and gas, except in their most aggressive decarbonization scenarios. However, those organizations’ recently released scenarios have begun to break from that pattern, indicating shifting views among analysts and institutions. Importantly, these updated scenarios incorporate major changes to energy markets that occurred in 2022, including Russia’s invasion of Ukraine and the passage of the Inflation Reduction Act in the United States.
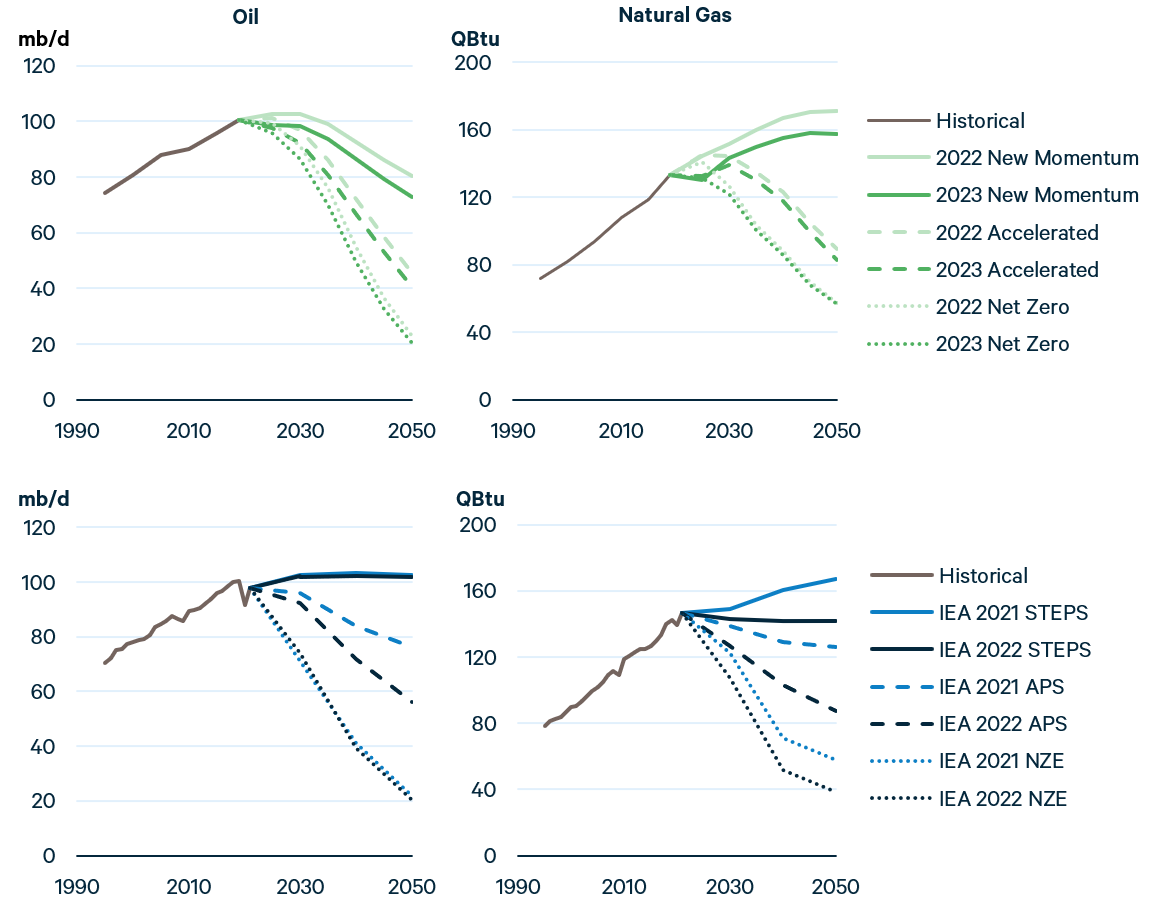
Figure 11 shows both IEA’s and BP’s scenarios for oil and gas demand over time. In a notable change from past scenarios, now for the first time, to our knowledge, all of BP’s scenarios feature lower oil demand in 2025 than in 2019 (see top left panel), suggesting that global oil demand may already be peaking. By contrast, as recently as last year, BP’s highest-fossil case (New Momentum) had oil demand peaking in 2030. Meanwhile, IEA STEPS continues to foresee rising and elevated levels of oil demand growth through 2040 (bottom left panel), although the NZE scenario features more aggressive declines in oil demand by 2030 than any of BP’s scenarios.
On natural gas, IEA’s and BP’s long-term prospects are more closely aligned, with growth and decline in gas demand possible through 2050, depending on the scenario. Of BP’s scenarios, only in the Net Zero case have we already passed “peak gas.” As for IEA, its 2022 STEPS features roughly flat gas demand through 2050, breaking from its 2021 projection, which featured modest but persistent growth in the coming decades.
Figure 11. Global Oil and Natural Gas Demand, Current and Previous Outlooks from BP (top) and IEA (bottom)
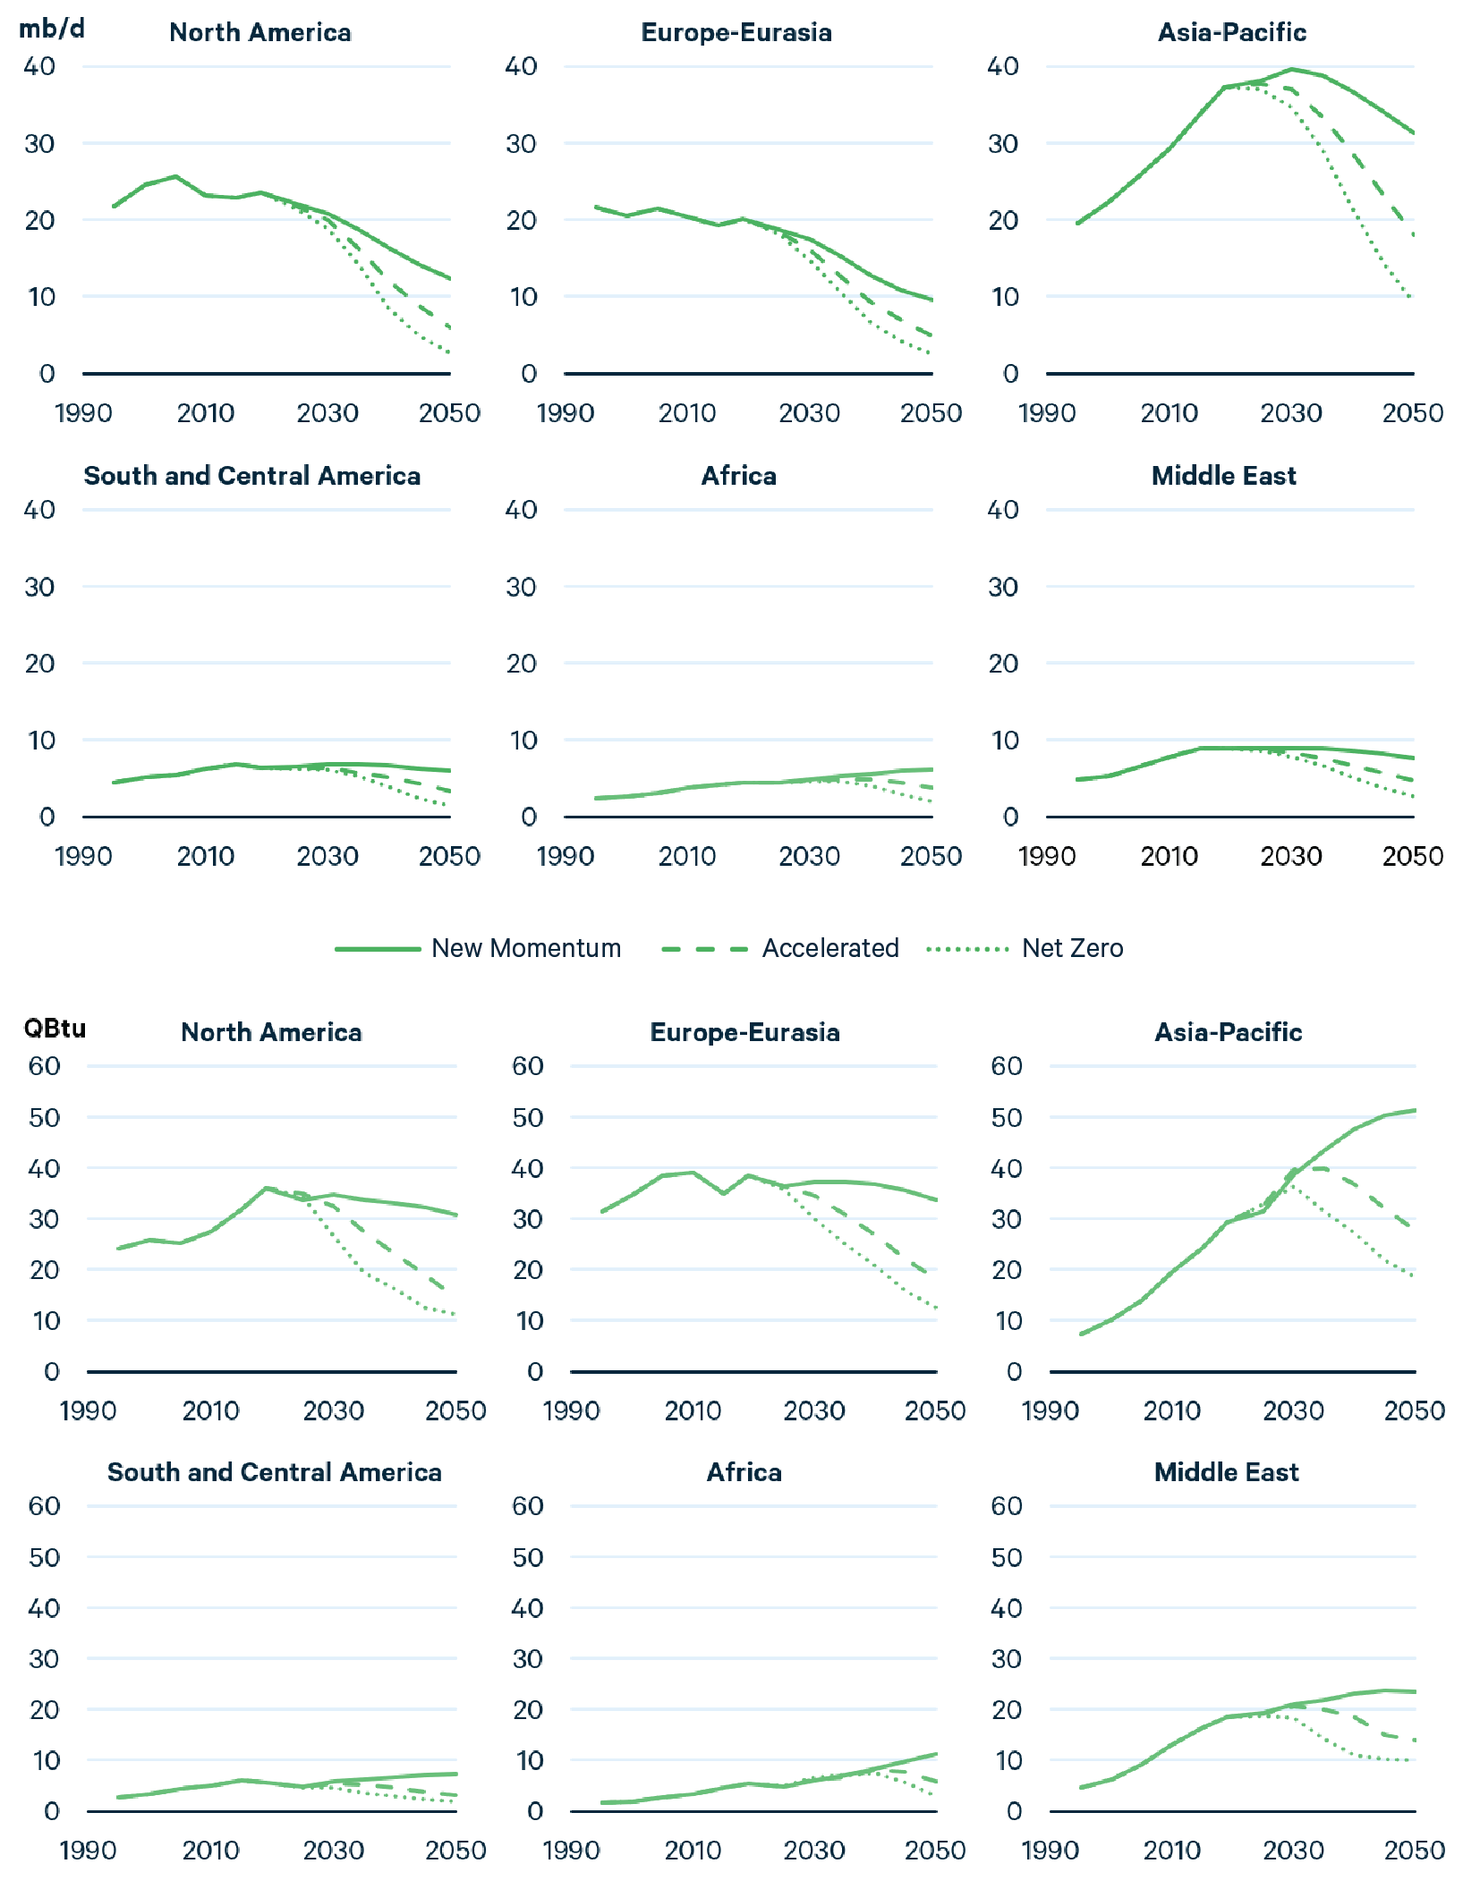
When peak oil demand or peak gas demand does occur, what regions might we expect to play the largest roles in this part of global decarbonization? Figure 12 tells this story by plotting BP’s scenarios of oil and gas consumption across six regions that constitute global demand. Oil demand broadly declines in North America and Europe-Eurasia but rises somewhat in Asia-Pacific before peaking toward the end of this decade, then declining sharply. Natural gas consumption also declines broadly in North America and Europe-Eurasia, but the alternative scenarios envision very different pathways of natural gas demand in Asia, the primary driver of uncertainty in long-term global gas demand and the possibility of peak gas. Across the low, medium, and high fossil scenarios, Asia-Pacific gas demand either peaks in 2030 or 2035 or continues to rise through 2050.
These ranges demonstrate large uncertainties in the timing of peak oil and peak gas. Nonetheless, revisions in this year’s scenarios from BP and IEA highlight the potential for an acceleration of the energy transition.
Figure 12. BP Pathways of Oil (top) and Gas (bottom) Demand, by Region
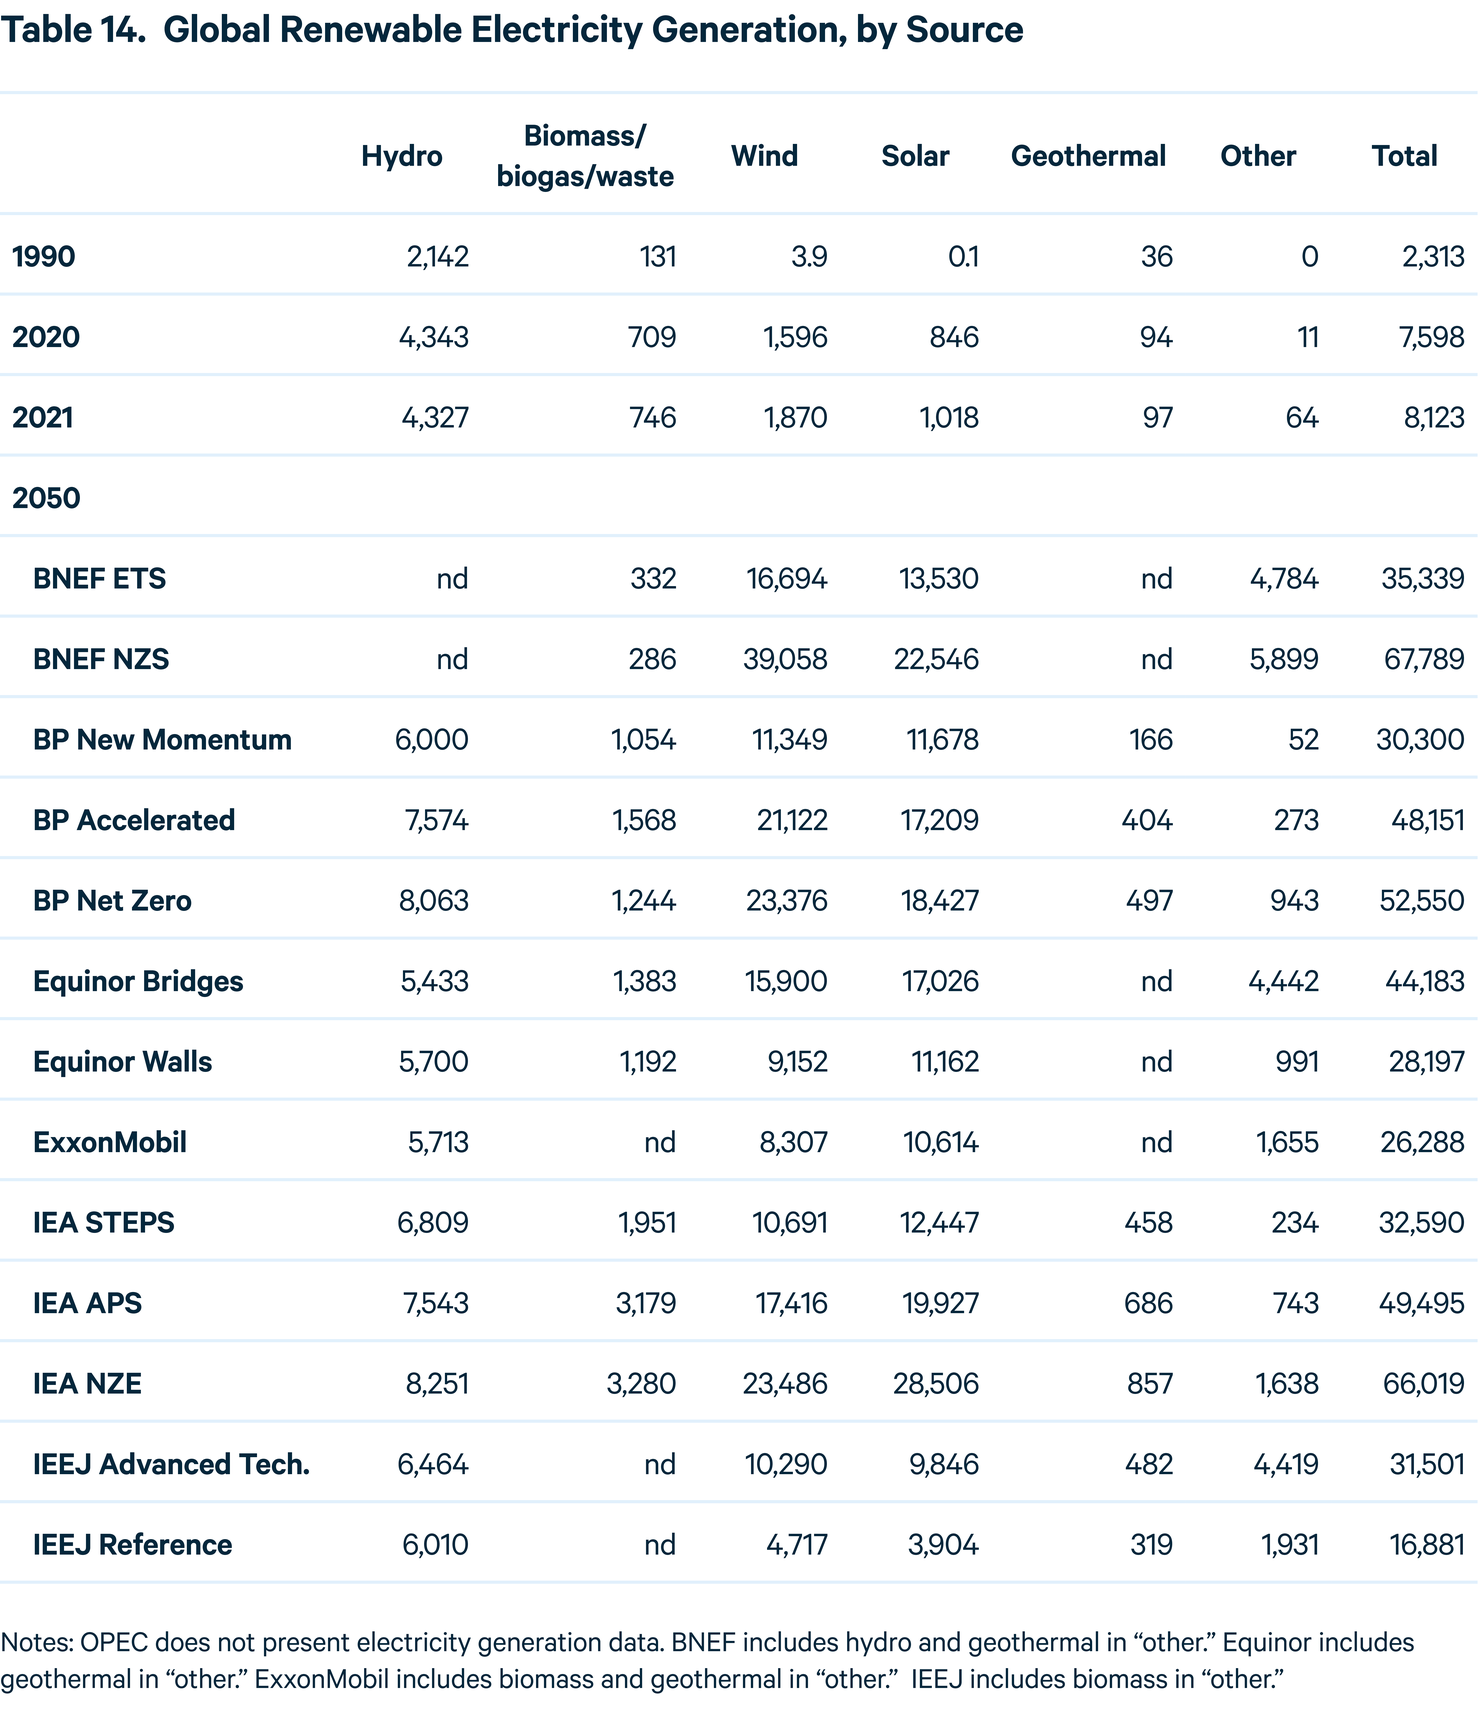
3.2. Assessing Regional Growth Trends for Wind and Solar
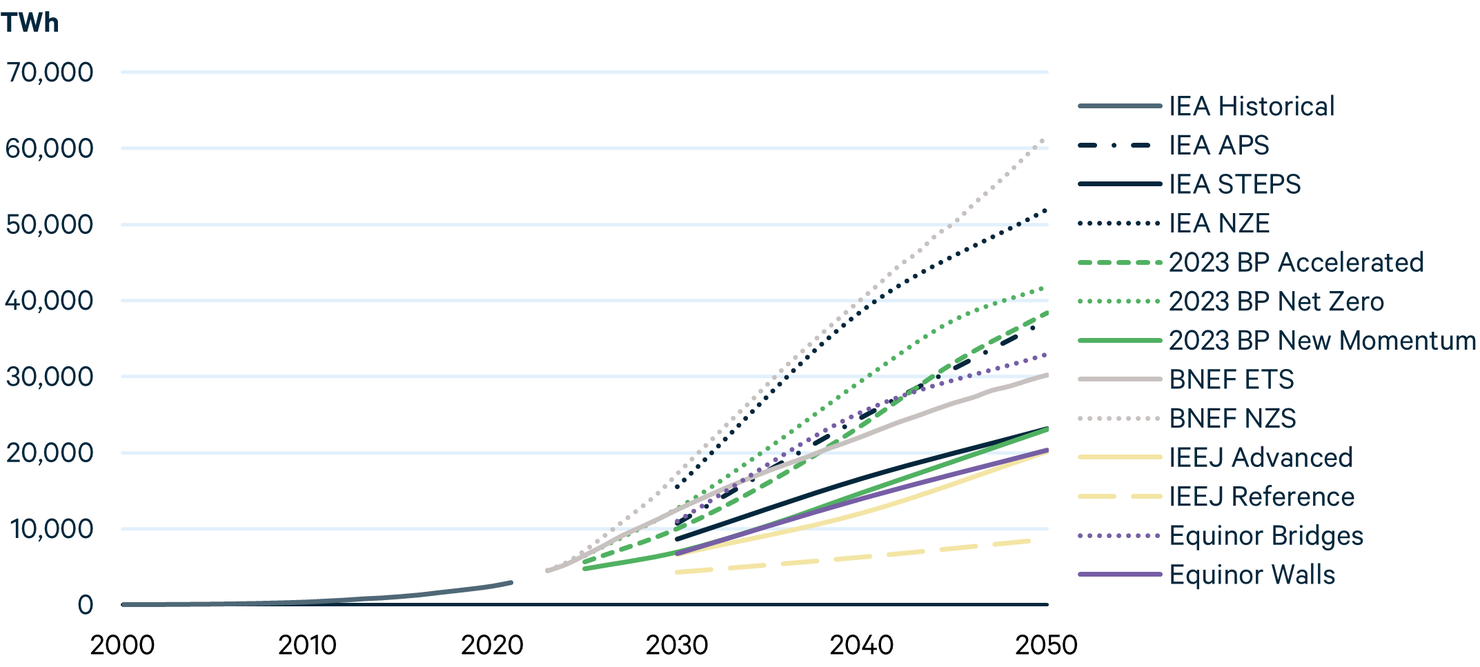
In recent years, growth in renewable energy—especially wind and solar—has achieved significant momentum. In Ambitious Climate scenarios, renewable generation sources are enabling the shift away from fossil fuels. However, the pace of growth varies widely across scenarios. In the most conservative scenario (IEEJ Reference), wind and solar power generation is expected to triple by 2050, but in the most ambitious scenario (BNEF NZS), it is expected to grow by a factor of 21 (Figure 13).
Figure 13. Historical and Projected Wind and Solar Generation through 2050
Several factors have contributed to these renewables’ accelerating growth, including policy support in critical regions and an overall decline in capital costs for equipment. However, projected growth is not evenly distributed across regions, especially in the near term. Only a few regions are expected to contribute most of the growth in wind and solar generation through 2030.
Energy security concerns due to Russia’s invasion of Ukraine have spurred European countries to accelerate their shift away from imported fossil fuels, particularly natural gas, and toward renewables. In May 2022, the European Commission presented the REPowerEU plan, which aim to increase the share of renewables in primary energy consumption from 40 to 45 percent by 2030. The Commission estimates that the renewable energy share of electricity generation will reach 69 percent by 2030 in the plan . In the United States, the Inflation Reduction Act has provided support for renewables. The bill extends existing technology-specific energy investment and production tax credits through 2024, at which point the tax credits will become emissions-based rather than technology-specific. Additional measures, including the Environmental Protection Agency’s $27 billion Greenhouse Gas Reduction Fund and the $40 billion in loan authority provided to the Department of Energy’s Loan Program Office, seek to mobilize private capital for clean energy projects.
China’s recent 14th Five-Year Plan includes upwardly revised goals in renewable power growth and targets a 50 percent increase in renewable power generation from 2020 to 2025. A suite of policy incentives, available land, and several planned gigawatt- and utility-scale clean energy bases are expected to boost China’s renewable energy.
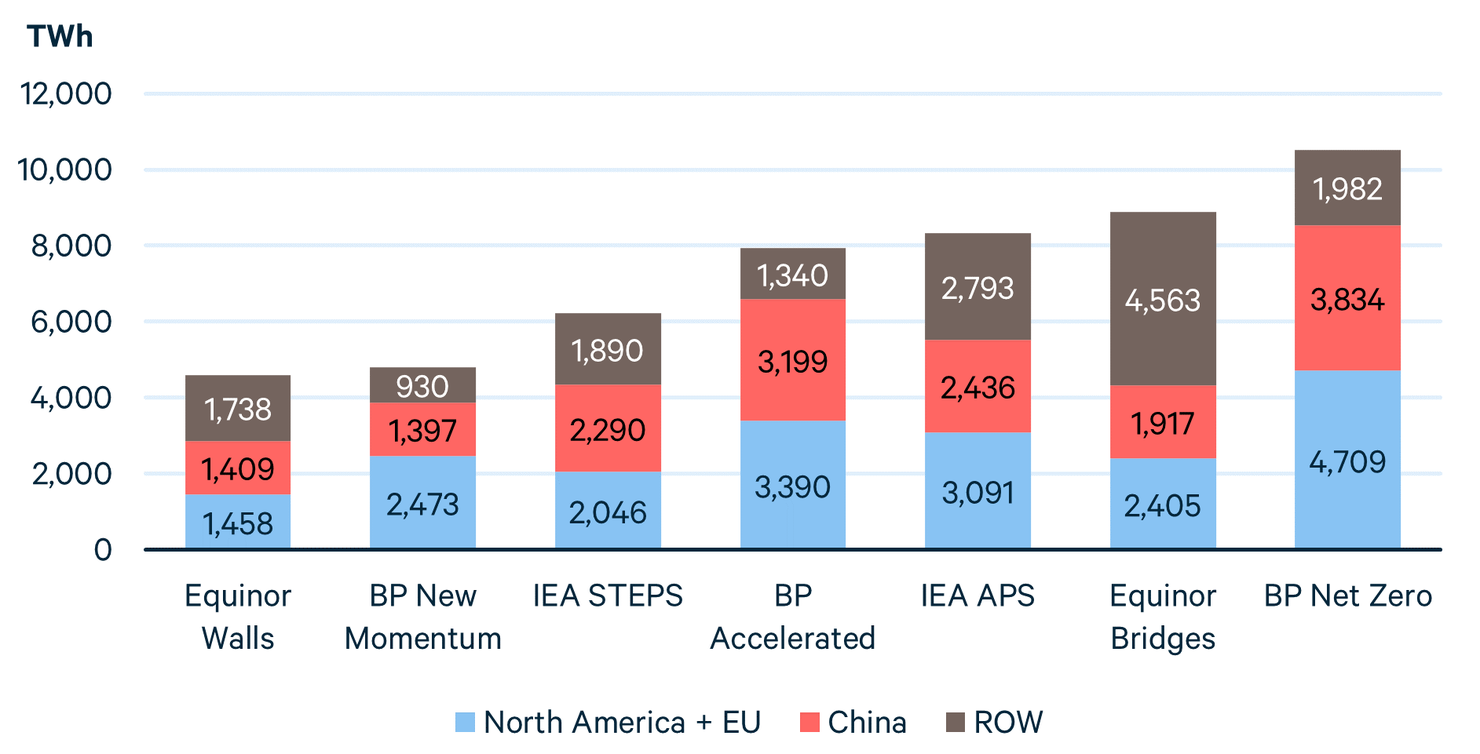
All scenarios (except Equinor Bridges) locate most of the growth in wind and solar generation in China, North America, and the European Union over the next decade (Figure 14). These regions are projected to account for 62 percent (Equinor Walls) to 83 percent (BP Accelerated) of all such growth.
However, the aggregate level of wind and solar deployment in China, North America, and the European Union differs considerably between most Reference and Evolving Policies scenarios (Equinor Walls, BP New Momentum, IEA STEPS, IEA APS) and the Ambitious Climate scenarios (BP Accelerated and BP Net Zero). This gap suggests the need for additional policy support for displacing fossil-based resources if climate targets are to be met, as well as policies addressing issues such as regulatory and permitting challenges, transmission, and private financing that can accelerate wind and solar deployment.
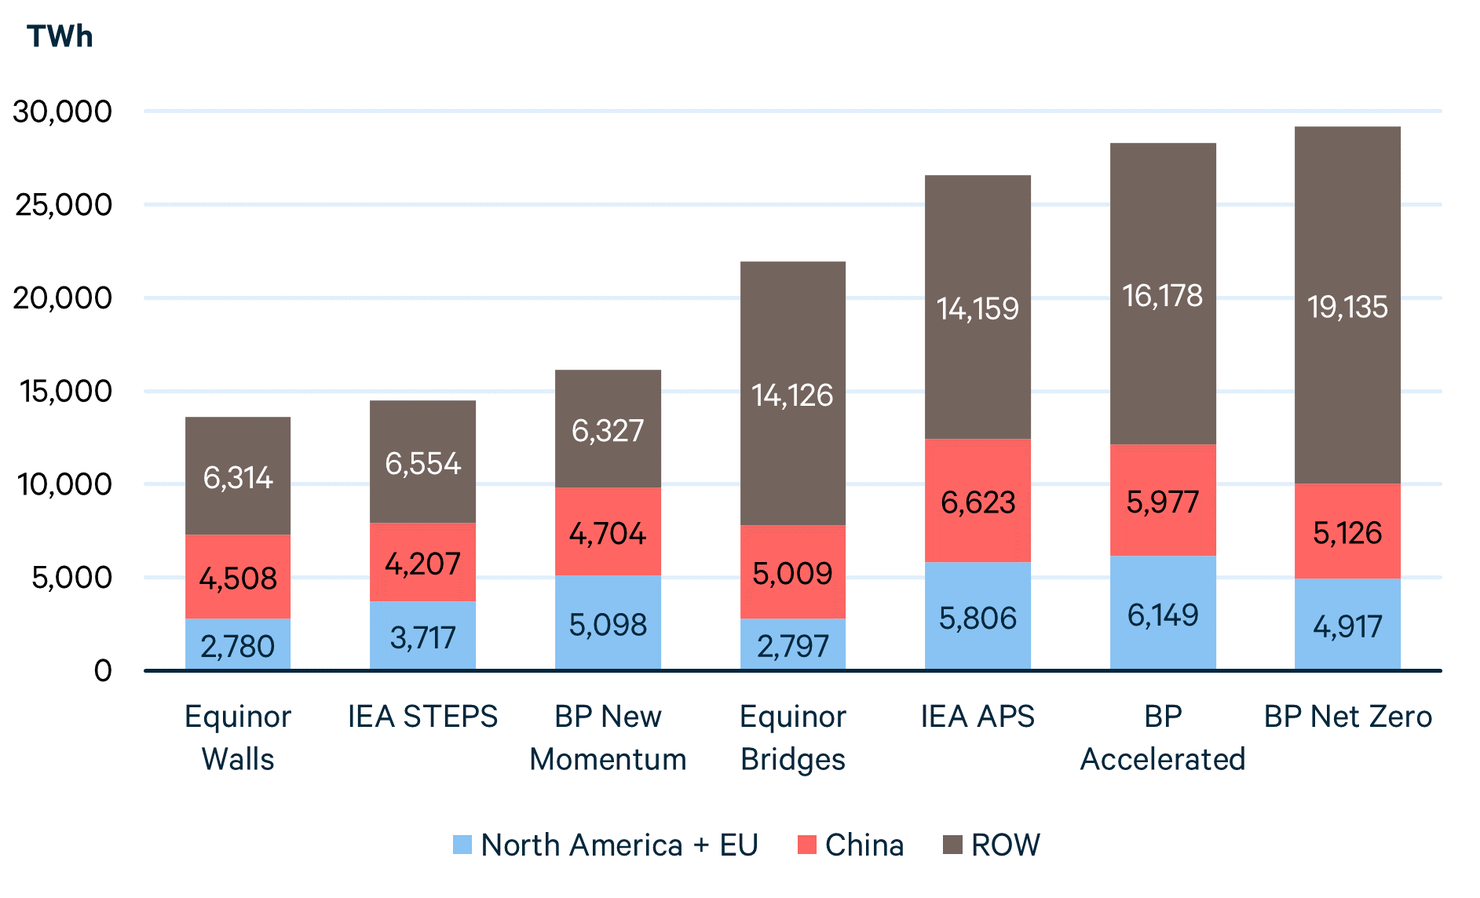
Figure 14. Growth in Wind and Solar Power Generation, by Region, 2019–2030
The divide between Evolving Policy and Ambitious Climate scenarios becomes more apparent in the long term, from 2030 to 2050, especially outside the United States, European Union, and China (Figure 15). Across scenarios, the rest of the world is expected to contribute 39 to 66 percent of the growth in wind and solar generation from 2030 to 2050. However, Evolving Policies scenarios project that growth in these regions will be less than half of the total generation necessary for meeting net-zero goals. To remain on track for net zero, much greater clean energy investment in emerging and developing economies is necessary. According to IEA, the World Bank, and the World Economic Forum, investment in emerging and developing countries will need to increase sevenfold, from less than $150 billion in 2020 to more than $1 trillion by 2030.
Figure 15. Growth in Wind and Solar Power Generation, by Region, 2030–2050
3.3. Fuels of the Future
In a future where fossil fuels play a smaller role in the primary energy mix, new energy sources will be needed to fulfill essential energy services. The three fuels that play the largest role in decarbonization across scenarios are electricity, hydrogen, and bioenergy —particularly the forms of these sources that involve low, zero, or even negative greenhouse gas emissions. Of course, these fuels are already available: electricity is used throughout the economy, hydrogen for refining and in chemicals production, and bioenergy for select industrial, electricity and heat generation, and transportation applications. We examine the outlook for each energy source in this section.
3.3.1. Electricity
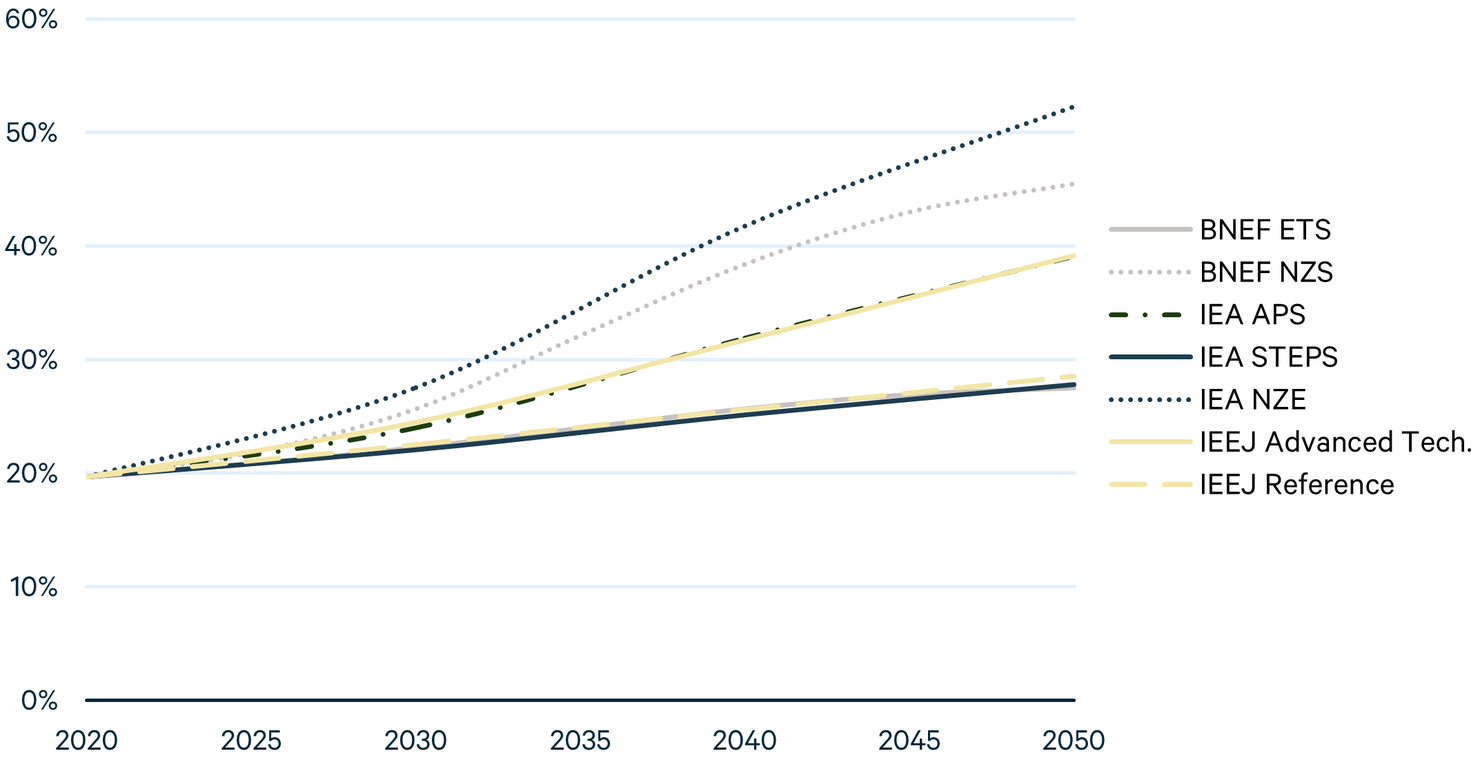
Electricity generation is shown in Figure 16, and electricity consumption as a fraction of total final consumption is shown in Figure 17. In most cases, electricity generation is higher in the Ambitious Climate scenarios. The two highest levels of generation, by a significant margin, are the BNEF and IEA Net Zero scenarios. This is also the case for the consumption fraction, which exceeds 50 percent for IEA NZE and 45 percent for BNEF NZS. Interestingly, generation is also quite high in the IEA APS scenario.
Figure 16. World Electricity Generation, All Sources
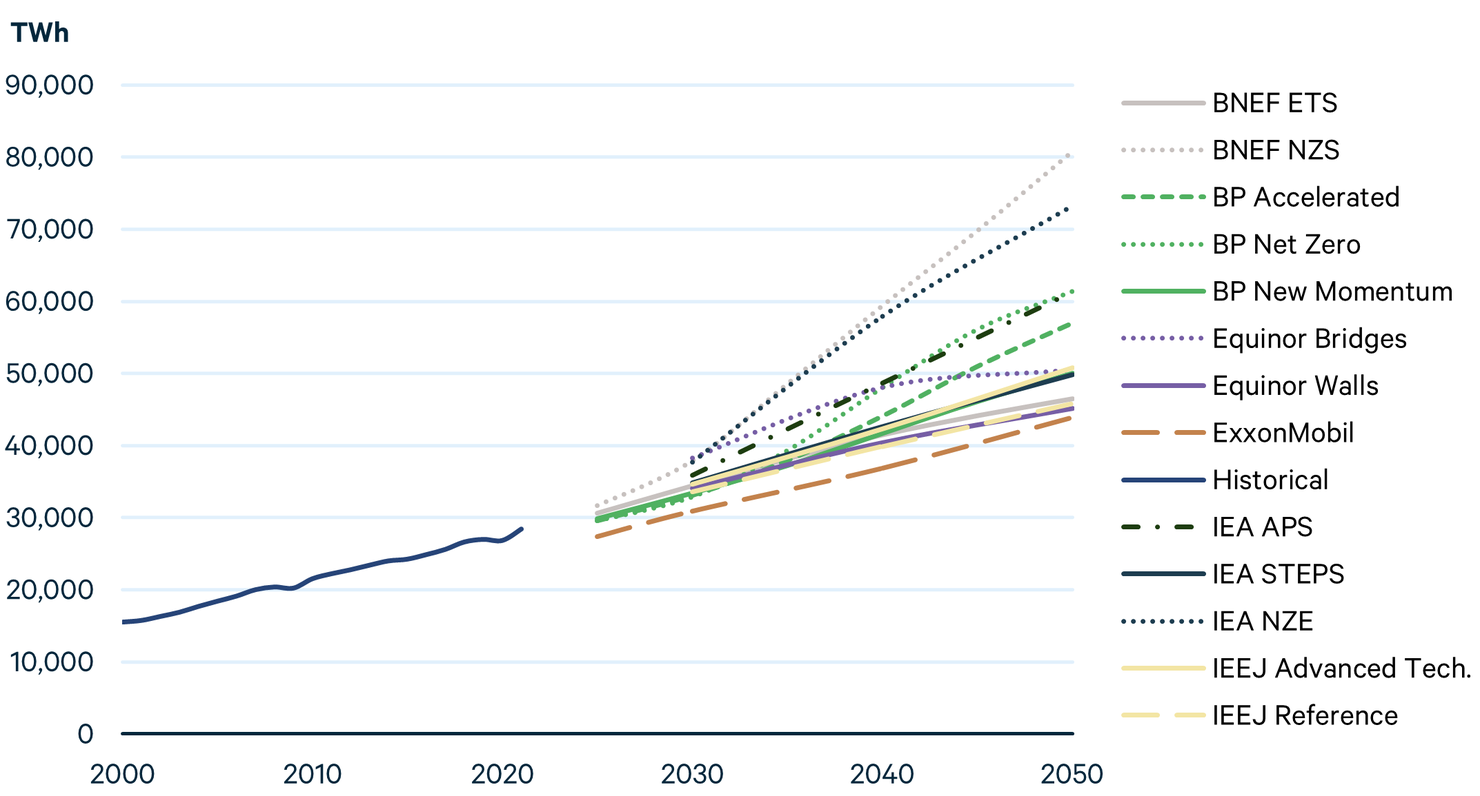
Figure 17. Share of Electricity in World Final Energy Consumption
One way to visualize the relationship between electrification and decarbonization is to plot electricity generation alongside carbon dioxide emissions. Figure 18 shows the values for the year 2050 in each scenario.
Figure 18. World Electricity Generation and Net CO2 Emissions in 2050
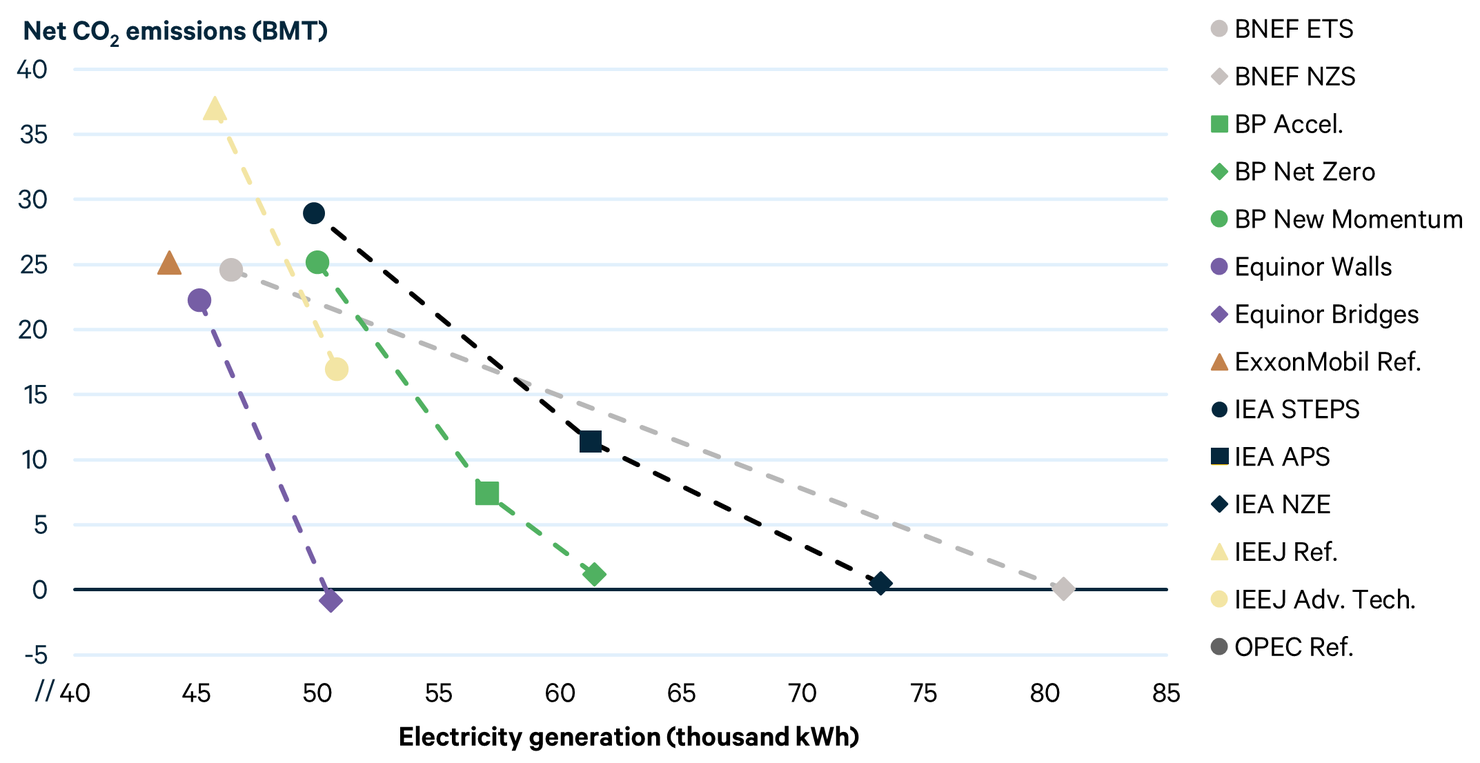
Here, we again see the highest levels of generation in the IEA and BP Net Zero scenarios. Although most of the points reflect a roughly linear relationship, with generation increasing as emissions decline, the Equinor Bridges scenario has generation comparable to scenarios with much higher emissions while achieving negative overall emissions. This likely reflects the fact that Equinor’s outlook does not include electricity used for hydrogen production in its measure of electricity generation.
In addition to high levels of electricity generation, these scenarios all have substantial hydrogen production (as does the IEEJ Advanced Technologies scenario). Among the Evolving Policies scenarios for which data are available, the two scenarios with the largest hydrogen production have electricity as a higher fraction of consumption. Although isolating the underlying source of hydrogen in these scenarios (e.g., electrolysis versus steam reforming) without further investigation is difficult, it appears that hydrogen produced from electrolysis is leading to increased electricity consumption in these scenarios. Based on internal communication, we understand that Equinor’s outlook does not include electricity used for hydrogen production in its measure of electricity generation, which makes direct comparison with other scenarios difficult. The hydrogen production in the IEEJ Advanced Technologies scenario may also not cause as large an increase in electricity generation because the increased demand from hydrogen production is offset by reductions in demand due to energy efficiency. We explore hydrogen outlooks further in the next section.
3.3.2. Hydrogen
Hydrogen use (in the scenarios that include it) is shown in Figure 19. The three scenarios where hydrogen plays the largest roles are BNEF and BP Net Zero (both 10 percent of final energy consumption in 2050), and Net Zero (IEA Net Zero (6 percent). Evolving Policies scenarios such as the IEEJ Advanced Technologies and the IEA APS include some hydrogen consumption but considerably less than their two ambitious scenarios.
Projections from BP generally show a higher share of hydrogen in final energy consumption than other scenarios, but this is partly the result of BP’s historical data, which shows hydrogen playing a larger role than other historical datasets. The cause of the underlying discrepancy in historical data is unclear, and may result from different accounting or reporting protocols across organizations.
Figure 19. Share of Hydrogen in World Final Energy Consumption
Although most outlooks do not report how the hydrogen is produced, some do provide these projections. In 2019, BP reports that 99.99 percent of all hydrogen production came from fossil fuels, primarily steam methane reforming. In its outlook, BP projects that the share of fossil-based hydrogen production decreases to 59, 36, and 28 percent by 2050 under its New Momentum, Accelerated, and Net Zero scenarios, respectively. In its Net Zero scenario, BP projects that in 2050, wind and solar provide two-thirds of the energy to produce hydrogen, primarily through water electrolysis. Under IEA’s STEPS, 68 percent of the 24 metric tons of low-emissions hydrogen production comes from water electrolysis by 2050, with the remainder coming from fossil fuels with CCUS. Under the APS and NZE, water electrolysis plays a much larger role, producing roughly three-quarters of all low-emissions hydrogen by 2050.
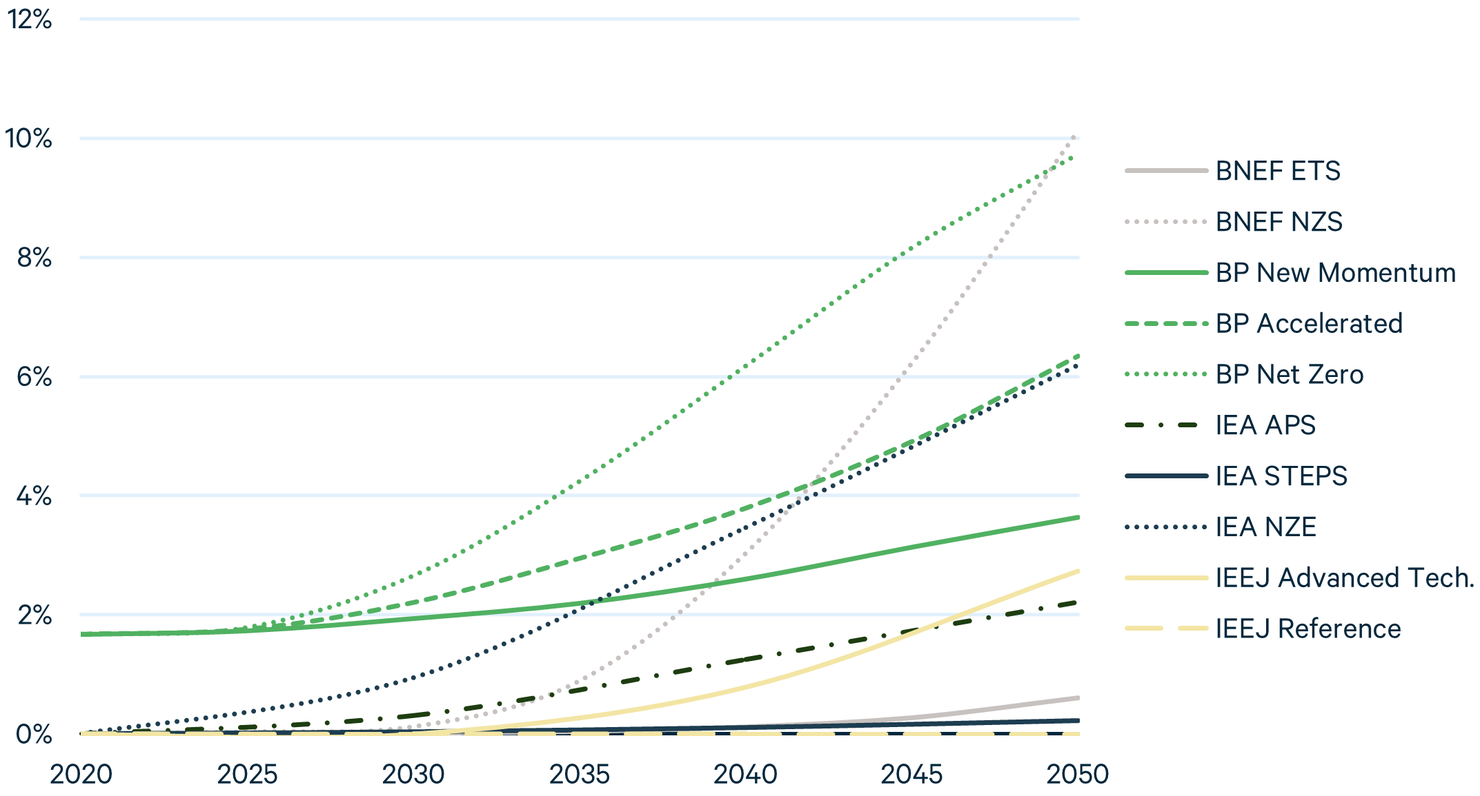
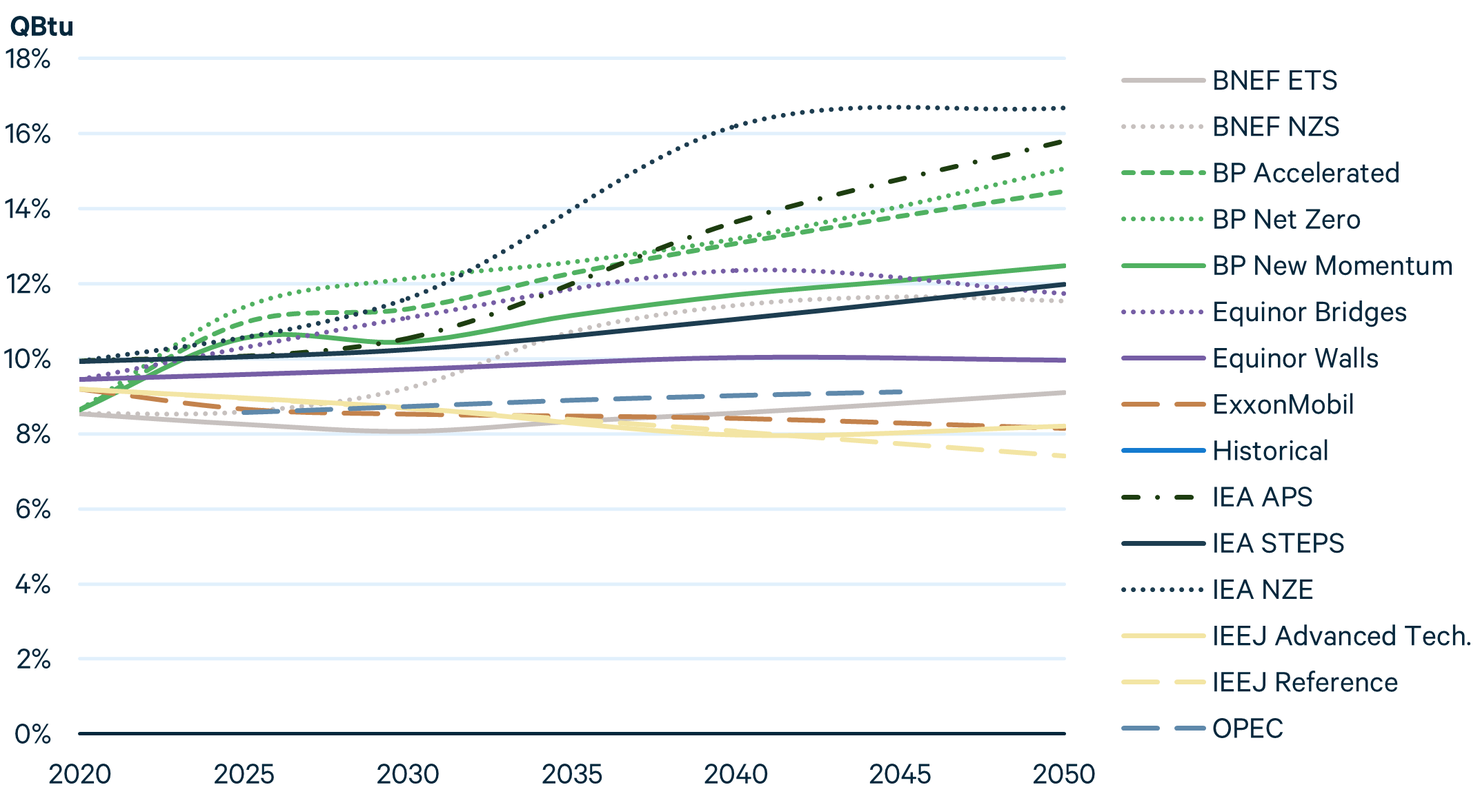
3.3.4. Biomass
Primary energy consumption from biomass is shown in Figure 20, and its share of the total is shown in Figure 21, including both traditional biomass (e.g., wood, dung, and agricultural by-products) and marketed, commercial-scale biomass (e.g., wood pellets) but excludes biofuels. Compared with hydrogen and electricity, biomass has very different patterns. Please note that we have not been able to completely harmonize these data, so the overall levels and shares of primary energy are not aligned across sources, as seen in the variety of starting points for outlooks in years 2025 and 2030. Even taking into account the calibration issue, the IEA scenarios show the highest absolute levels of biomass consumption, regardless of scenario type.
Figure 20. World Biomass Primary Energy Consumption
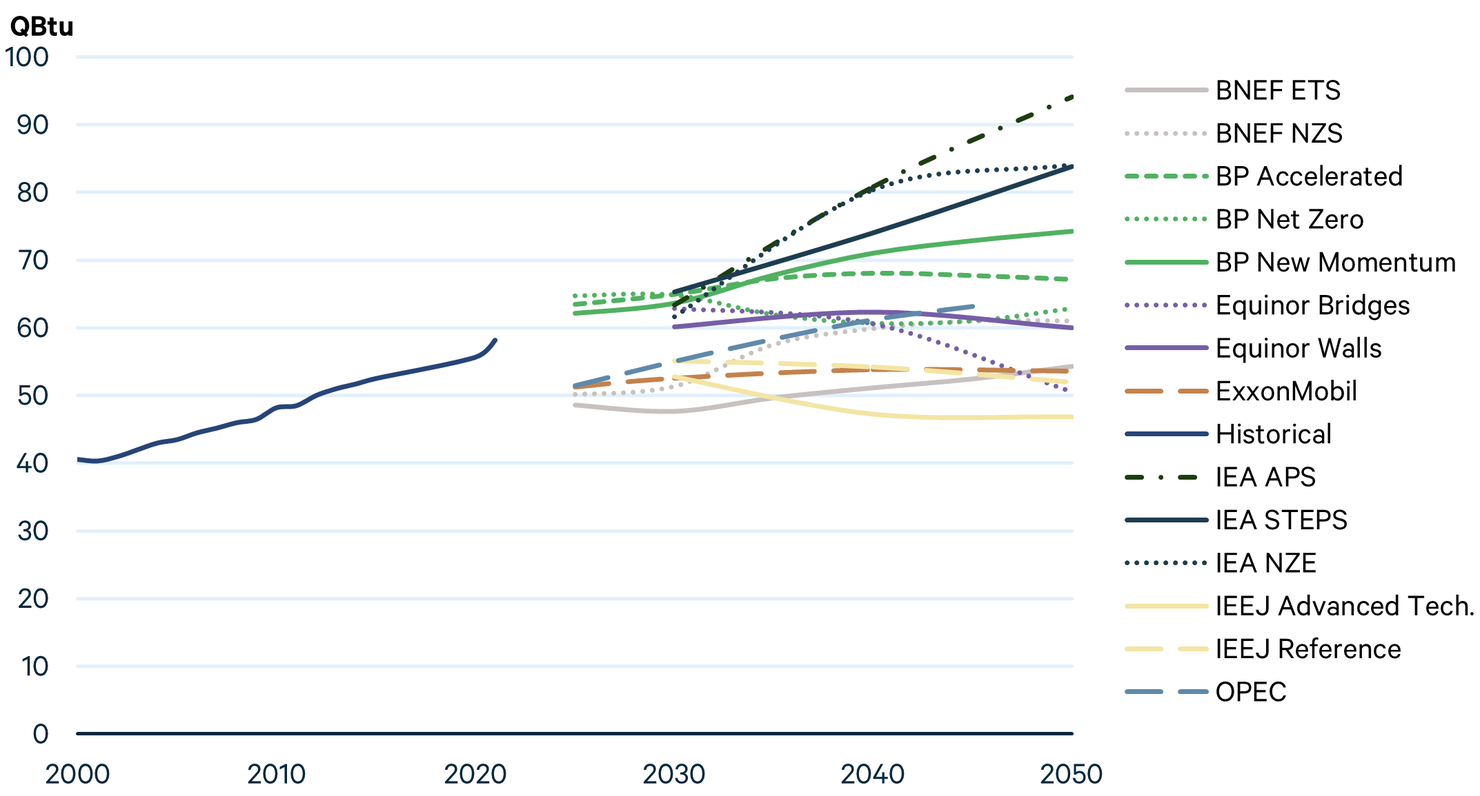
Figure 21. World Biomass Primary Energy Consumption
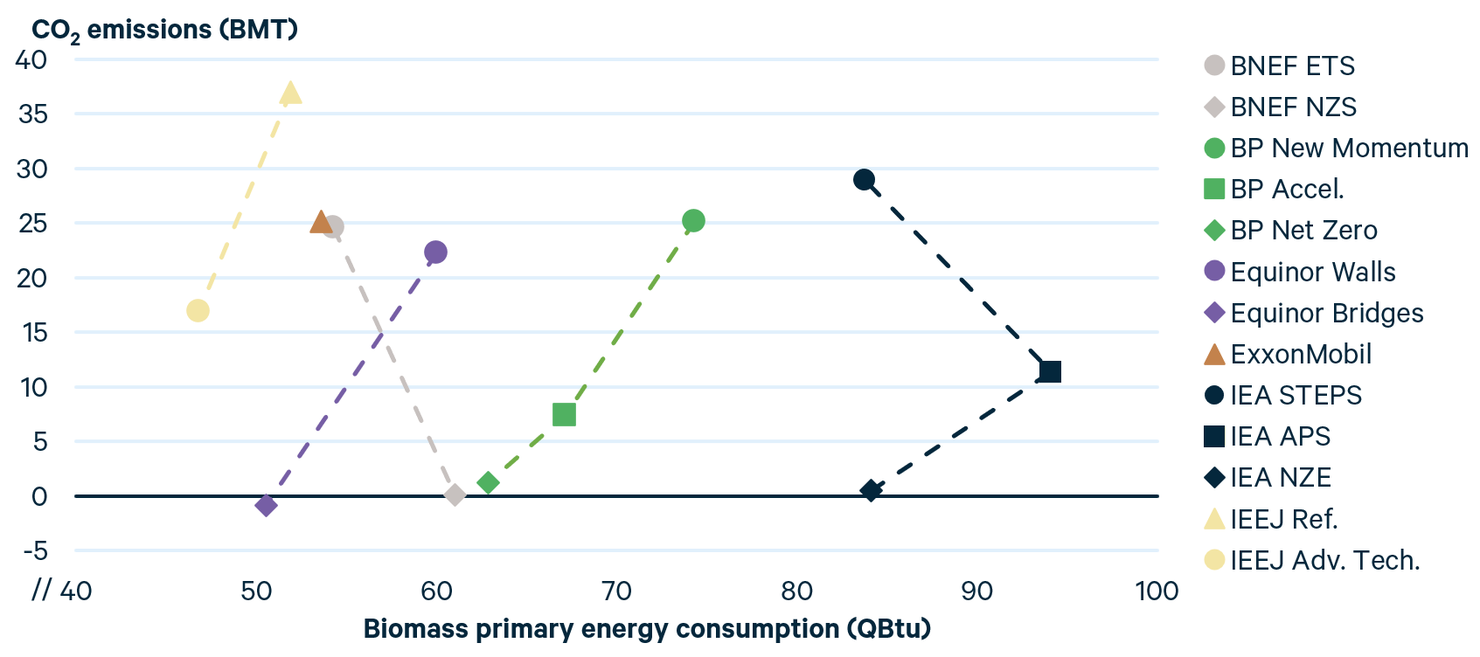
Unlike electricity, biomass does not appear to have a strong relationship between consumption and emissions (Figure 22). This likely reflects assumptions about the economics and availability of biomass. Moreover, except for the IEA scenarios, most projections show a leveling off or even a decrease in the absolute level of biomass consumption. Some of this reflects an offsetting decline in traditional biomass as more modern forms of biomass, such as wood pellets, become more prevalent.
Figure 22. World Biomass Energy Consumption and Net CO2 Emissions in 2050
4. Data and Methods
In this paper, we examined projections from the following publications:
- BNEF: New Energy Outlook 2022
- BP: Energy Outlook 2023
- Equinor: Energy Perspectives 2022
- ExxonMobil: 2022 Outlook for Energy
- IEA: World Energy Outlook 2022
- IEEJ: Energy Outlook 2022
- OPEC: World Oil Outlook 2022
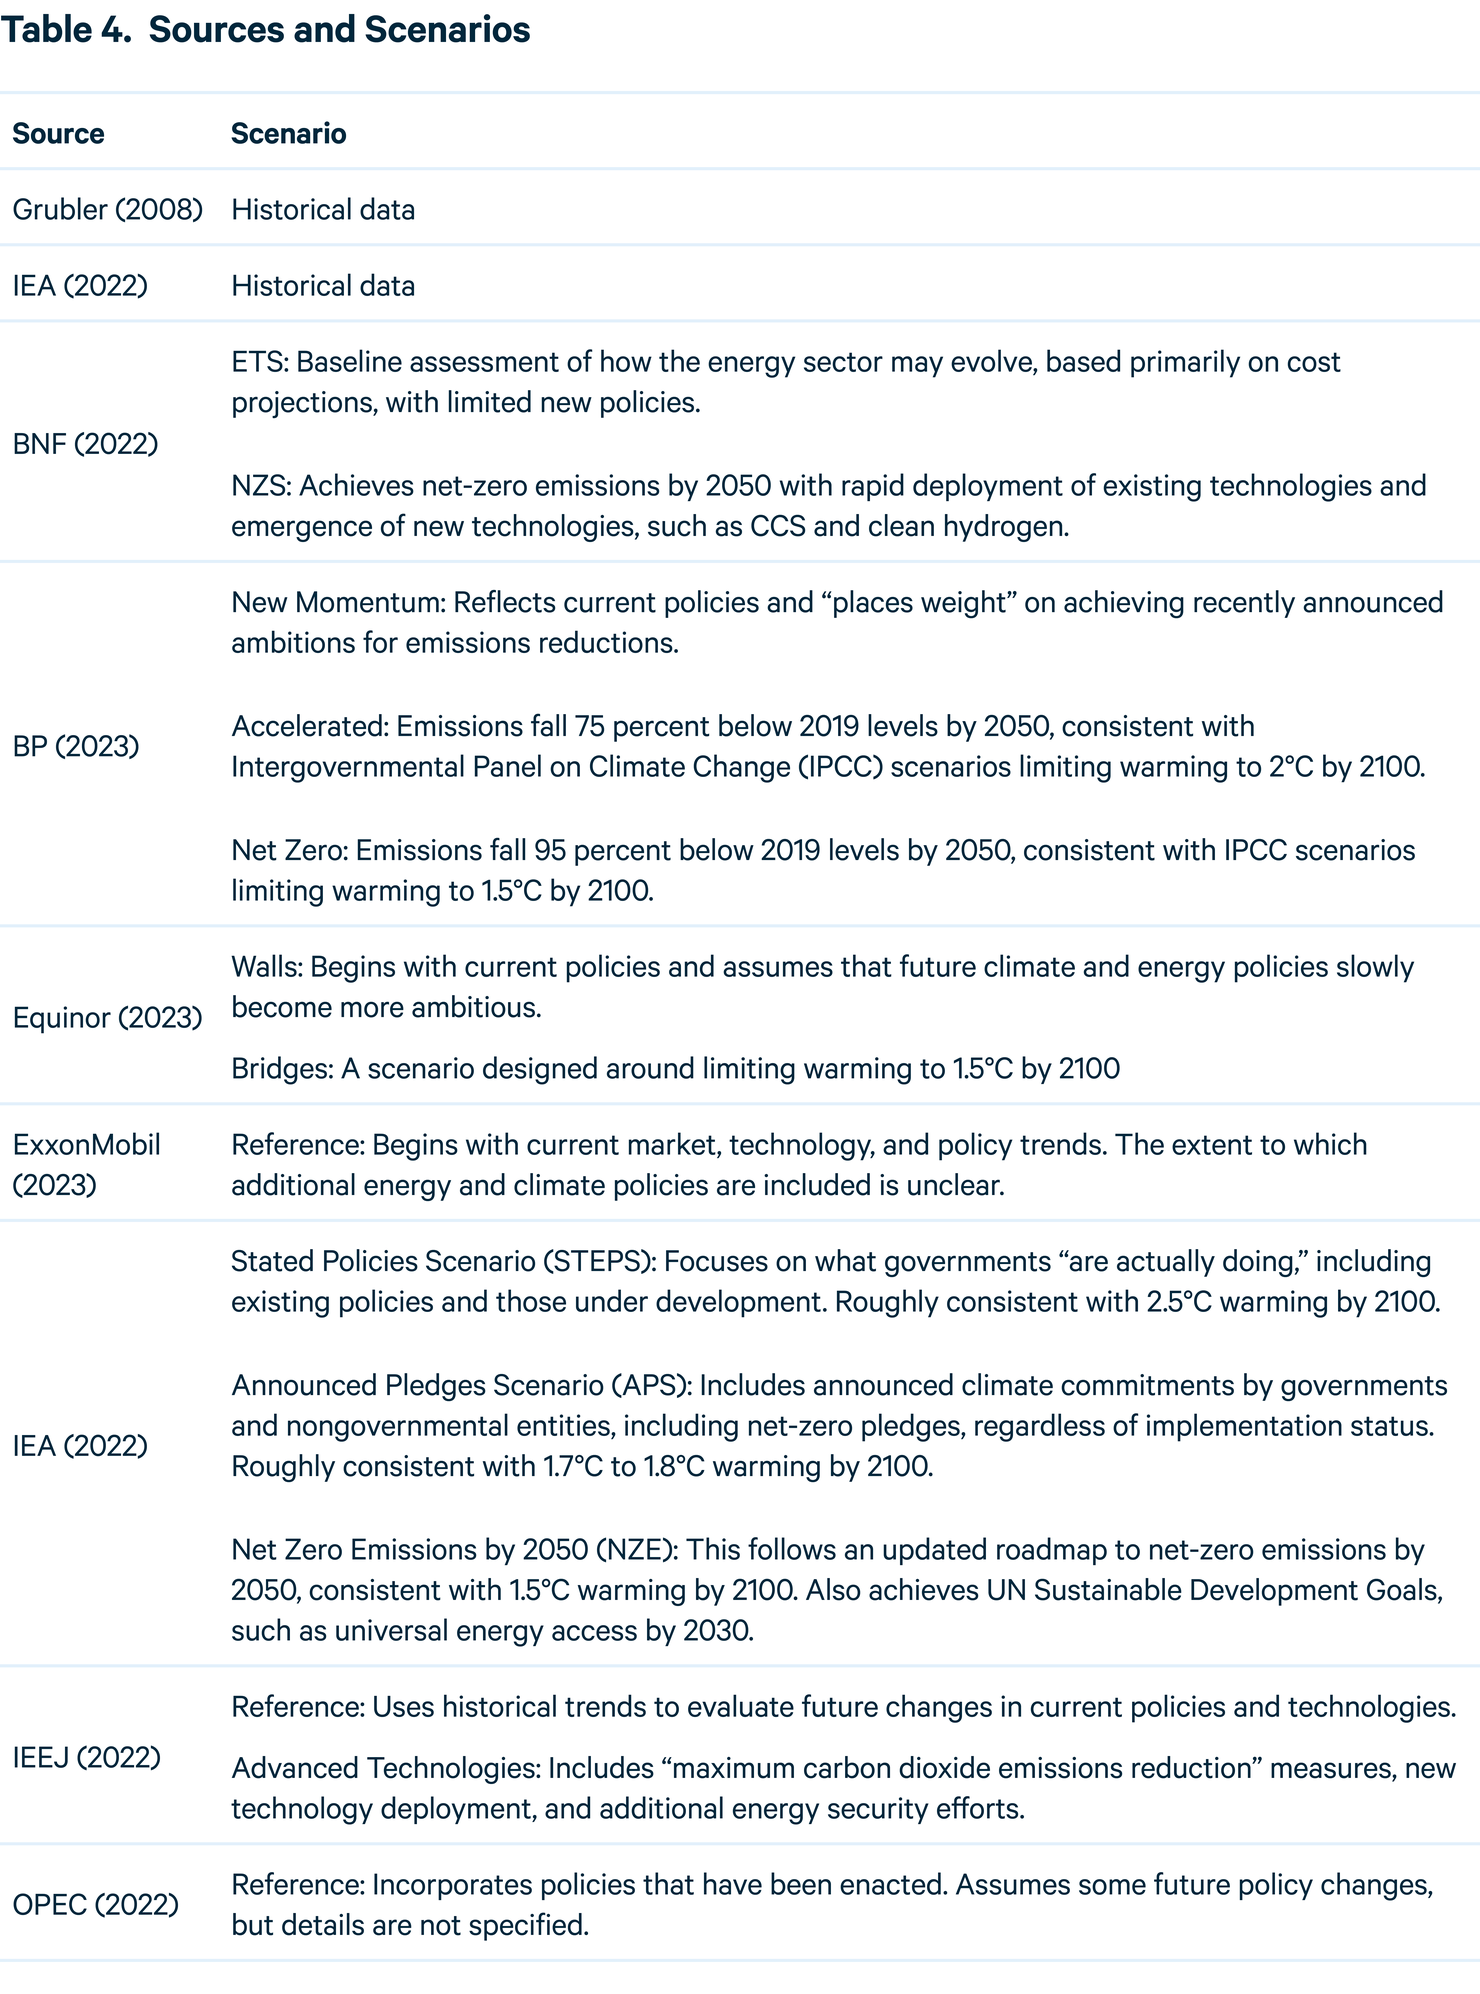
These outlooks vary across many dimensions, including differences in modeling techniques, historical data, economic growth assumptions, and policy scenarios. Generally, scenarios can be grouped into three categories: (1) Reference, which assume no major policy changes; (2) Evolving Policies, which incorporate the modeling team’s expectations of policy trends; and (3) alternatives, which are typically based on certain policy targets or technology assumptions. We focus on Ambitious Climate scenarios, a major subset of (3). Table 4 summarizes the scenarios included in this year’s analysis.
Variations in underlying assumptions about the future of policies, technologies, and markets produce useful variation among outlooks, allowing analysts to view a wide range of potential energy futures. However, outlooks also have important methodological differences that can complicate direct comparisons and reduce the ability to draw insights.
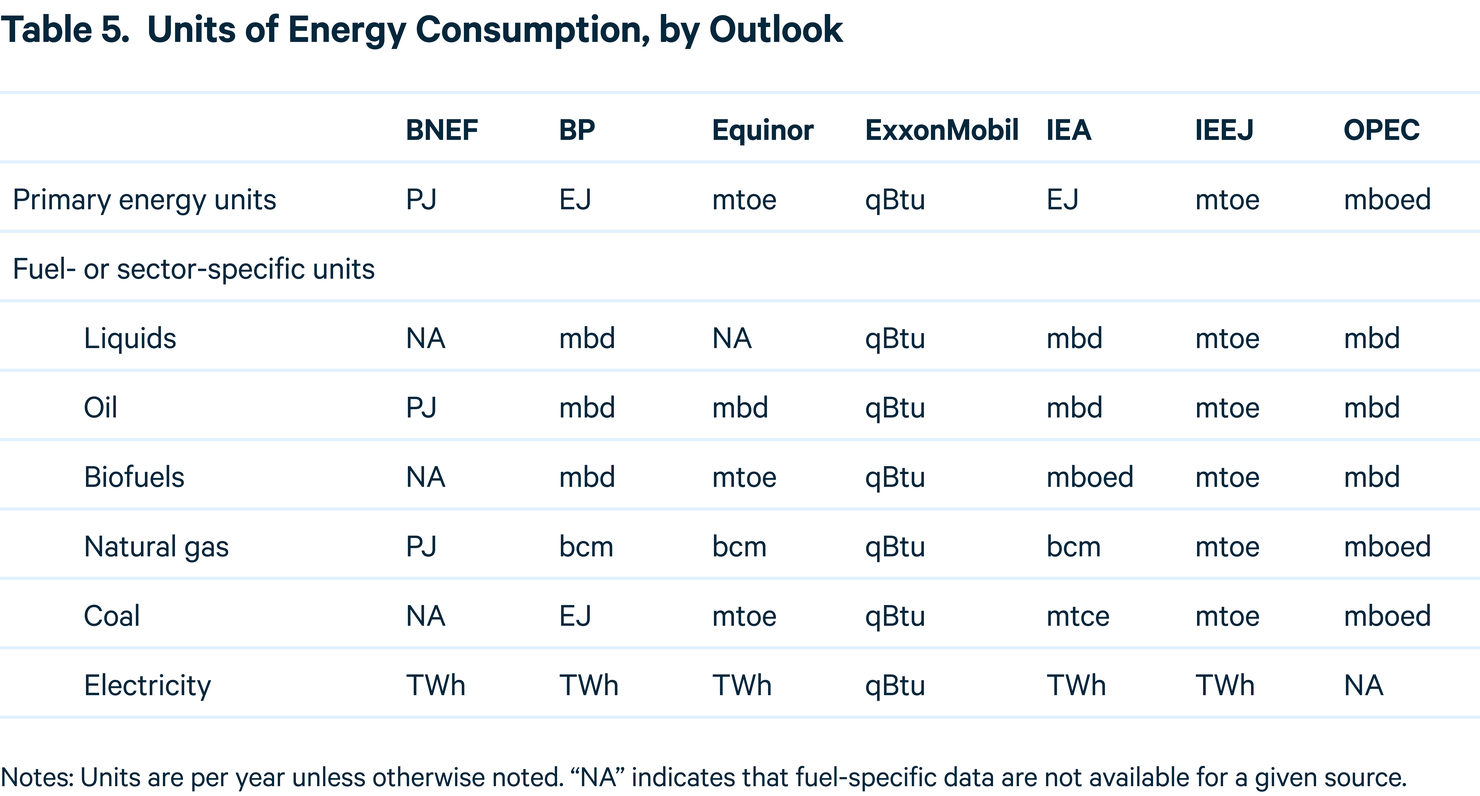
One major difference is the choice of reporting units. For primary energy, outlooks use QBtu, million tonnes of oil equivalent (mtoe), or exajoules. In this report, we standardize all units to QBtu. For fuel-specific data, outlooks use million barrels per day (mbd) or million barrels of oil equivalent per day (mboed) for liquid fuels, billion cubic meters (bcm) or trillion cubic feet (tcf) for natural gas, and million tonnes of coal-equivalent (mtce) or short tons for coal. Table 5 presents the reporting units for each outlook, and Table 6 provides relevant conversion factors.
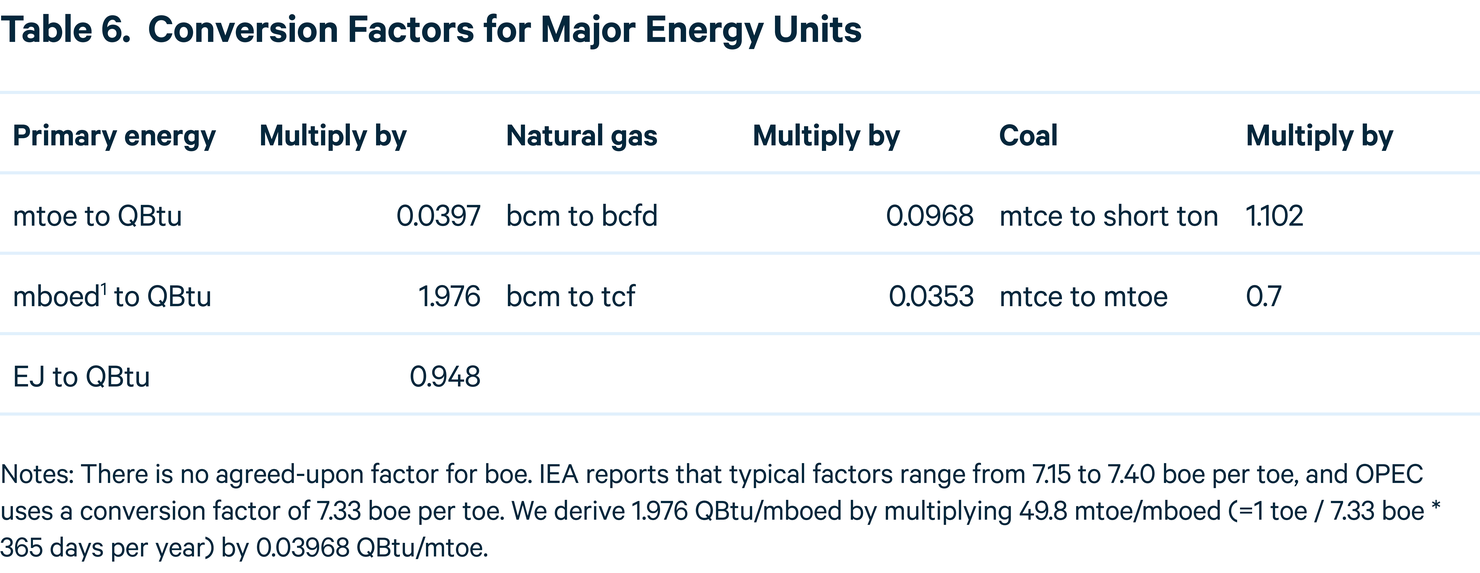
A second difference among outlooks is that assumptions about the energy content in a given physical unit of fuel result in different conversion factors for data presented in energy units (e.g., QBtu) and those presented in physical units (e.g., mbd or bcm). Among the outlooks we examine, these assumptions vary by up to 10 percent. Although conversion unit variations may appear small, they are amplified when applied across the massive scale of global energy systems, particularly over long time horizons.
A third difference results from varying decisions about including nonmarketed biomass, such as locally gathered wood and dung, in historical data and projections for primary energy consumption. In previous years, BP and the US Energy Information Administration (EIA) had not included these sources in their projections. However, BP’s Energy Outlook 2023 does include nonmarketed biomass, allowing for enhanced comparability (the EIA publishes its International Energy Outlook every two years and did not publish it in 2022).
Yet another difference relates to comparing the energy content of fossil and nonfossil fuels. The primary energy content of oil, natural gas, and coal is relatively well understood and similar across outlooks. However, a substantial portion of that embodied energy is wasted as heat during combustion. Because nonfossil fuels, such as hydroelectricity, wind, and solar, do not generate substantial amounts of waste heat, identifying a comparable metric for primary energy is difficult, and outlooks take various approaches.
Other differences in outlooks include (1) different categorizations for liquids fuels and renewable energy, (2) different regional groupings for aggregated data and projections, (3) use of net versus gross calorific values for reporting the energy content of fossil fuels, (4) use of net versus gross generation for reporting electricity data, and (5) whether and how to include flared natural gas in energy consumption data.
To address those challenges and allow for a more accurate comparison across outlooks, Newell and Iler apply a harmonization process. We update and use it here. For details, see Raimi and Newell.
5. Statistics
6. Endnotes
- A. Grubler, Energy Transitions, in Encyclopedia of Earth (Environmental Information Coalition, National Council for Science and the Environment, 2008).
- International Energy Agency, World Energy Balances Database (2022).
- BNEF, New Energy Outlook 2022, https://about.bnef.com/new-energy-outlook/ (2022).
- BP, Energy Outlook 2023, https://www.bp.com/en/global/corporate/energy-economics/energy-outlook.html (2023).
- Equinor, Energy Perspectives 2022: Global Macroeconomic and Energy Market Outlook, https://www.equinor.com/sustainability/energy-perspectives (2022).
- ExxonMobil, 2022 Outlook for Energy, https://corporate.exxonmobil.com/energy-and-innovation/outlook-for-energy (2022).
- International Energy Agency, World Energy Outlook 2022, https://www.iea.org/reports/world-energy-outlook-2022 (2022).
- Institute of Energy Economics, Japan, IEEJ Outlook 2023: Challenges for Achieving Both Energy Security and Carbon Neutrality, https://eneken.ieej.or.jp/en/whatsnew/442.html (2022).
- OPEC, World Oil Outlook 2022, https://woo.opec.org/ (2022).
- International Energy Agency, IEA World Energy Statistics and Balances, https://www.oecd-ilibrary.org/energy/data/iea-world-energy-statistics-and-balances_enestats-data-en (2018).
- BNEF, Energy Transition Investment Trends 2023, https://about.bnef.com/energy-transition-investment/ (2023).
- P. Friedlingstein et al., Global Carbon Budget 2022, Earth System Science Data 14: 4811–900 (2022).
- Climate Action Tracker, 2030 Emissions Gap: CAT Projections and Resulting Emissions Gap in Meeting the 1.5°C Paris Agreement Goal, https://climateactiontracker.org/global/cat-emissions-gaps/ (2022).
- UN Environment Programme, Emissions Gap Report 2022: The Closing Window: Climate Crisis Calls for Rapid Transformation of Societies, https://www.unep.org/resources/emissions-gap-report-2022 (2022).
- V. Srikrishnan, Y. Guan, R. S. J. Tol, and K. Keller, Probabilistic Projections of Baseline Twenty-First Century CO2 Emissions Using a Simple Calibrated Integrated Assessment Model, Climatic Change 170: 37 (2022).
- IEA, Coal Market Update: July 2022, https://www.iea.org/reports/coal-market-update-july-2022 (2022).
- J. E. Aldy et al., Social Science Research to Inform Solar Geoengineering, Science 374: 815–18 (2021).
- S. M. Smith et al., The State of Carbon Dioxide Removal, http://dx.doi.org/10.17605/OSF.IO/W3B4Z (2023) doi:10.17605/OSF.IO/W3B4Z.
- US Department of Energy, DOE National Laboratory Makes History by Achieving Fusion Ignition, https://www.energy.gov/articles/doe-national-laboratory-makes-history-achieving-fusion-ignition (2022).
- BP, Energy Outlook 2022, https://www.bp.com/en/global/corporate/energy-economics/energy-outlook.html (2022).
- International Energy Agency, World Energy Outlook 2021, https://www.iea.org/reports/world-energy-outlook-2021 (2021).
- BP, Statistical Review of World Energy 2022, https://www.bp.com/en/global/corporate/energy-economics/statistical-review-of-world-energy.html (2022).
- D. Raimi et al., Global Energy Outlook 2022: Turning Points and Tension in the Energy Transition, https://www.rff.org/publications/reports/global-energy-outlook-2022/ (2022).
- United Nations Department of Economic and Social Affairs Population Division, World Population Prospects 2022, https://population.un.org/wpp/ (2022).
- European Commission, REPowerEU Plan, https://energy.ec.europa.eu/communication-repowereu-plan-com2022230_en (2022).
- White House, Building a Clean Energy Economy: A Guidebook to the Inflation Reduction Act’s Investments in Clean Energy and Climate Action, cleanenergy.gov, https://www.whitehouse.gov/wp-content/uploads/2022/12/Inflation-Reduction-Act-Guidebook.pdf (2023).
- B. Han, China’s Renewables 14th Five-Year Plan: Official Targets to Be Remarkably Outpaced? S&P Global, https://www.spglobal.com/commodityinsights/en/ci/research-analysis/chinas-renewables-14th-fiveyear-plan-official-targets.html (2022).
- IEA, World Bank, and World Economic Forum, Financing Clean Energy Transitions in Emerging and Developing Economies, International Energy Agency (2021).
- R. G. Newell and S. Iler, The Global Energy Outlook, http://www.nber.org/papers/w18967 (2013) doi:10.3386/w18967.
- D. Raimi and R. G. Newell, Global Energy Outlook Comparison Methods: 2023 Update, www.rff.org/geo (2023).