Prospects for Land Sector Carbon Dioxide Removal in the United States
This RFF report explores policies to expand the level of carbon dioxide removals from the land sector.
Abstract
Because eliminating all emissions is impractical, the US Long-Term Strategy for reaching net zero emissions by 2050 anticipates growth in the rate of carbon dioxide removals (CDR) from the atmosphere from 0.84 gigatons (GT)/year to an average of 1.0–1.8 GT/year over the next three decades. Without large-scale deployment of novel technologies, such as direct air capture, most future CDR would come from conventional land-based carbon sequestration, mainly in forests. We model the potential for such CDR by accounting for land use change and forest growth and mortality over the next 40 years. Absent policy interventions, land-based CDR is expected to continue to decline, averaging 0.73 GT/year, as the nation’s forests age and sequestration slows. Afforestation programs could expand CDR over this baseline, with a 30-million-acre program keeping it close to recent historical values (0.83 GT/year) and a 90-million-acre program growing it to 0.95 GT/year. Substantial investments in novel technologies and also land/forest sequestration will be required to accomplish the CDR goals of the Long-Term Strategy.
1. Introduction
Global emission pathways that restrict global warming to 1.5°C (IPCC 2022), and the US Long-Term Strategy for reaching net zero emissions by 2050 (DOS 2021) require unprecedented carbon dioxide removals (CDR) from the atmosphere in addition to substantial emission reductions to accomplish their targets. In 2021, annual land-based CDR amounted to 0.84 gigatons (GT) CO2eq, or about 13 percent of that year’s US emissions of 6.3 GT (EPA 2021). Most US CDR accrues to conventional land carbon sinks, primarily from biological sequestration on forested lands (EPA 2021). Although novel technologies, such as bioenergy with carbon capture and storage or direct air capture, may eventually provide scalable CDR, lands—and forested lands in particular—currently offer the only feasible means to expand removals on a large scale. The recent State of Carbon Dioxide Removals report (Smith et al. 2023) identifies a global “CDR gap” between 1.5°C pathways and national plans/commitments that can only be filled by growing conventional CDR while rapidly developing novel CDR, and the Long-Term Strategy anticipates a 30-year expansion of CDR of 1–1.8 GT CO2eq/year, or 22–220 percent over recent levels, mainly from conventional sources (EPA 2021). However, the US land carbon sink has been declining, and it is not clear how it can be maintained at current levels given the condition of forests and competing demands for land.
This report examines the potential for continued or expanded land-based US CDR. We explore the recent history of the land/forest sink and, after modeling CDR expectations with a business-as-usual (BAU) future, we evaluate alternatives for expanding CDR through afforestation, as anticipated by the IPCC Special Report and the Long-Term Strategy. Our scenarios simulate land use switching based on a dynamic empirical model, and we model the resulting carbon emissions and sequestration due to forest growth and mortality across varied ecological settings. We also discuss other approaches to enhancing land/forest CDR and potential policy costs.
2. The Land Sector and Recent CDR
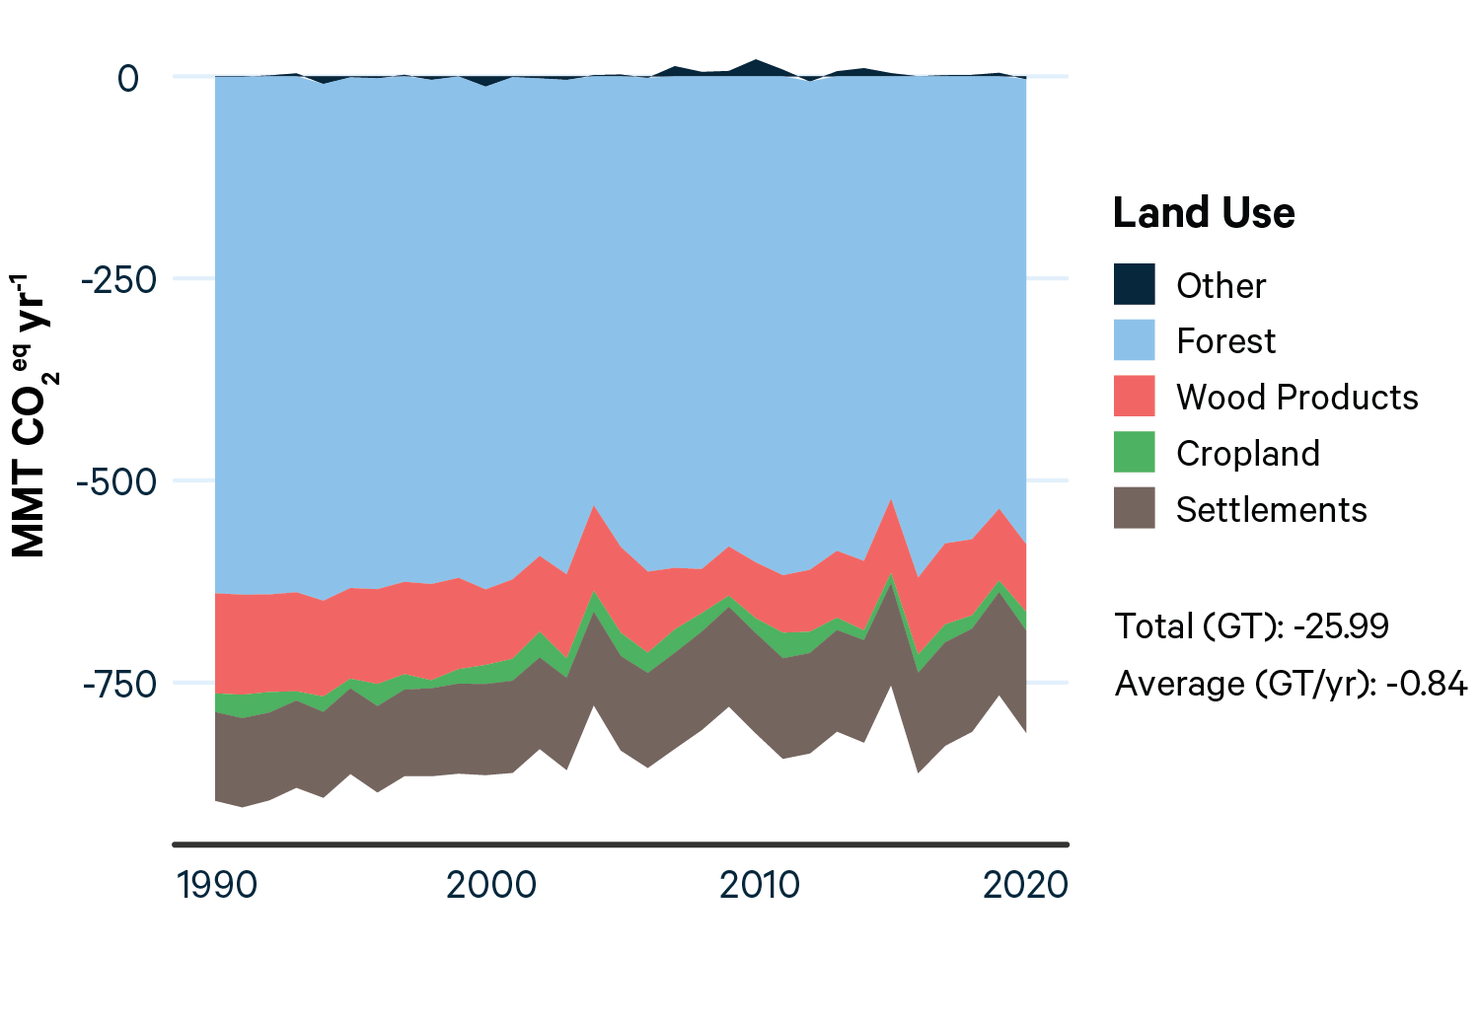
The future of land sector carbon depends on the interplay between natural and human systems that determine land allocation among uses and the material composition and carbon density of natural and built environments. CDR from the land/forest sector accumulates carbon in two stocks or pools: vegetation and soils in situ and harvested material stored for long periods in wood products. The land/forest sector has provided substantial CDR throughout the period of record for greenhouse gas emission inventories (1990–2020, Figure 1), generating an annual average of 0.84 GT CO2eq/year of negative emissions from 1990 to 2021 (EPA 2021). However, the sink has declined by 10 percent, from an average of .89 GT CO2eq/year in 1990–1995 to .81 GT CO2eq/year in 2015–2020. Many land uses contribute at least some CDR, but most of the land/forest sink derives from forests, including forest ecosystems and wood products carbon pools (Figure 1). CDR in the settlements category (urban and suburban uses) is also substantial at 14 percent of the total, mostly due to tree growth (EPA 2021).
Although several factors—including land use, biological growth, and forest use—have affected carbon sink strength over the past several decades, declining sequestration rates are largely due to forest aging. The US landscape is composed of public and private lands; although land use is mostly stable on public land, market-driven change increased forest by about 21 million acres (about the area of Kentucky) between 1987 and 2017 (Oswalt et al. 2019). Sink strength declined between 1990 and 2020 despite this accretion of forest area due to aging stands and corresponding decreases in the average rate of carbon sequestration.
Figure 1. Average Annual Net Emissions from the Land Use, Land Use Change, and Forestry Sector (EPA 2021) for Land Uses and the Wood Products Carbon Pool
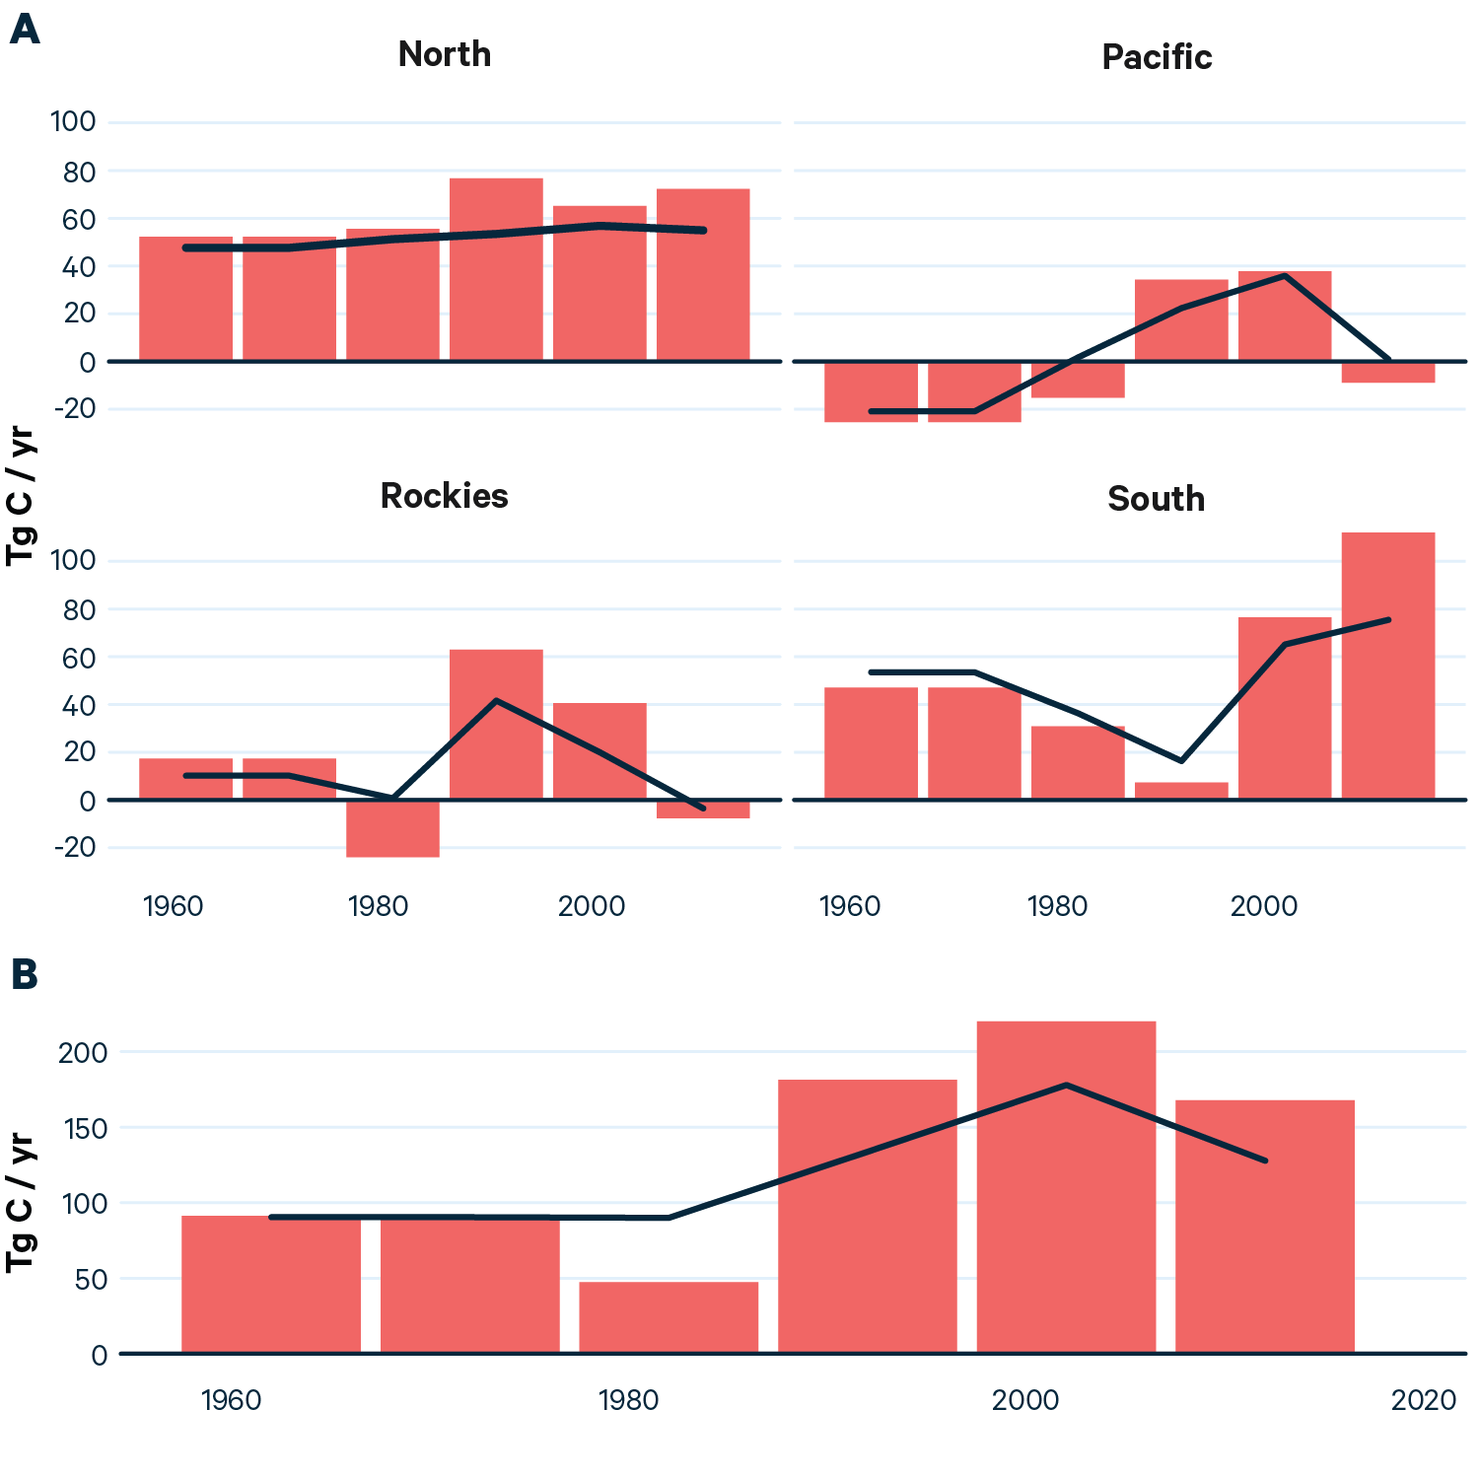
In forests, that rate is age dependent. After a forest is established, the rate increases to a maximum value and then declines with age until it reaches zero; fully mature forests achieve a stasis where emissions through mortality are equivalent to carbon uptake through growth (unless disrupted by a disturbance, such as a harvest or wildfire). A large portion of the recent US carbon sink can be attributed to the rapid growth of younger forests during the last quarter of the 20th century, especially in the Southeast, and the conclusion of old-growth harvesting in the Pacific Northwest. Historical simulations (Wear 2023) indicate that this period of net afforestation increased CDR in forests from about .33 GT CO2 eq/year in the 1960s–1970s to a peak of .65 GT CO2 eq/year in 1987–2007 (Figure 2). Afforestation rates have diminished recently, and the mechanics of forest aging suggest a continued decline in CDR absent another surge in afforestation.
CDR rates vary across major regions due to the ecological setting and local biophysical productivity (Figure 2). Nearly all recent forest carbon sequestration has occurred in the eastern states; western regions teeter between sink and source (Wear and Coulston 2015). Especially strong investments in forests in the Southeast expanded its carbon sequestration substantially after the 1990s. In recent years, losses of forest area in the Pacific Northwest have offset its strong accumulation in persistent forests.
Figure 2. Average Annual Net Emissions from the Land Use, Land Use Change, and Forestry Sector (EPA 2021) for Land Uses and the Wood Products Carbon Pool
The built environment also continues to accumulate carbon in the form of harvested wood products net of emissions from their production (Figure 1). The growth in their carbon stocks accounts for about 15 percent of the recent land carbon sink but varies with general market trends. The stock of carbon bound up in wood products can be increased by new construction and diminished by demolition, so net emissions can range from positive to negative. Per capita consumption of wood and the wood content of homes and other structures have trended down over the last three decades (Howard et al. 2016), suggesting that this sink might continue to shrink over time (Johnston and Radeloff 2019), absent incentives to stimulate greater use of wood construction.
In sum, carbon sequestration in the land/forest sector is substantial but gradually declining due mainly to land use dynamics and the age structure of forests. To reverse these trends and put the nation on track to meet CDR and broader climate change mitigation goals, policy action will be required to incentivize expanding forest area, storing more carbon longer in existing forests, and/or expanding the forest carbon stored in the built environment. We focus next on exploring future sequestration and how it might be affected by afforestation programs, which have the greatest potential for moving the needle.
3. The Future of Land-Sector CDR
Land-sector CDR will depend on changes in land use—especially those that alter forest area—and the dynamics of carbon accumulation within forests as affected by age, disturbance, and use. To explore CDR potential, we first construct a BAU projection of land use for US counties based on a model of use choices and carbon exchanges between land and the atmosphere. The RFF Carbon and Land Use Model (CALM) simulates land use changes between all uses on nonfederal lands using an empirical model of conversion decisions. The model simulates resulting changes in carbon sequestration based on the dynamics of forest inventories for all ownerships (growth, disturbances, and harvesting for public and private forests) across 19 ecological regions (see Appendix). CDR estimates for forest land uses are generated from carbon stock changes (and use changes involving forests); estimates for nonforest land uses are based on average annual carbon emissions or sequestration (net emission coefficients). For this analysis, we hold future wood product carbon CDR constant at the average of 2016–2020 levels.
The BAU scenario projects land use change for 2012–2062 based on trends from 1997–2012 and land use returns as of 2012. Figure 3 shows projected changes in four uses—cropland, forest, settlements, and “other,” which includes pastureland, rangeland, and land enrolled in the Conservation Reserve Program—by the end of the simulation period (2062). Under the BAU scenario, we project strong shifts out of cropland and into other uses and settlements in the upper Midwest; further west, we project expansions of cropland and shifts out of other uses. Projections indicate that forestland will decline in the Pacific Northwest and the southeast Atlantic Coast as settlements expand. However, this loss is expected to be offset by increases in forestland in the inland Southeast.
Figure 3. Projected Changes in Percent Land Use by County, from the Beginning to End of the Simulation Period (2012–2062)
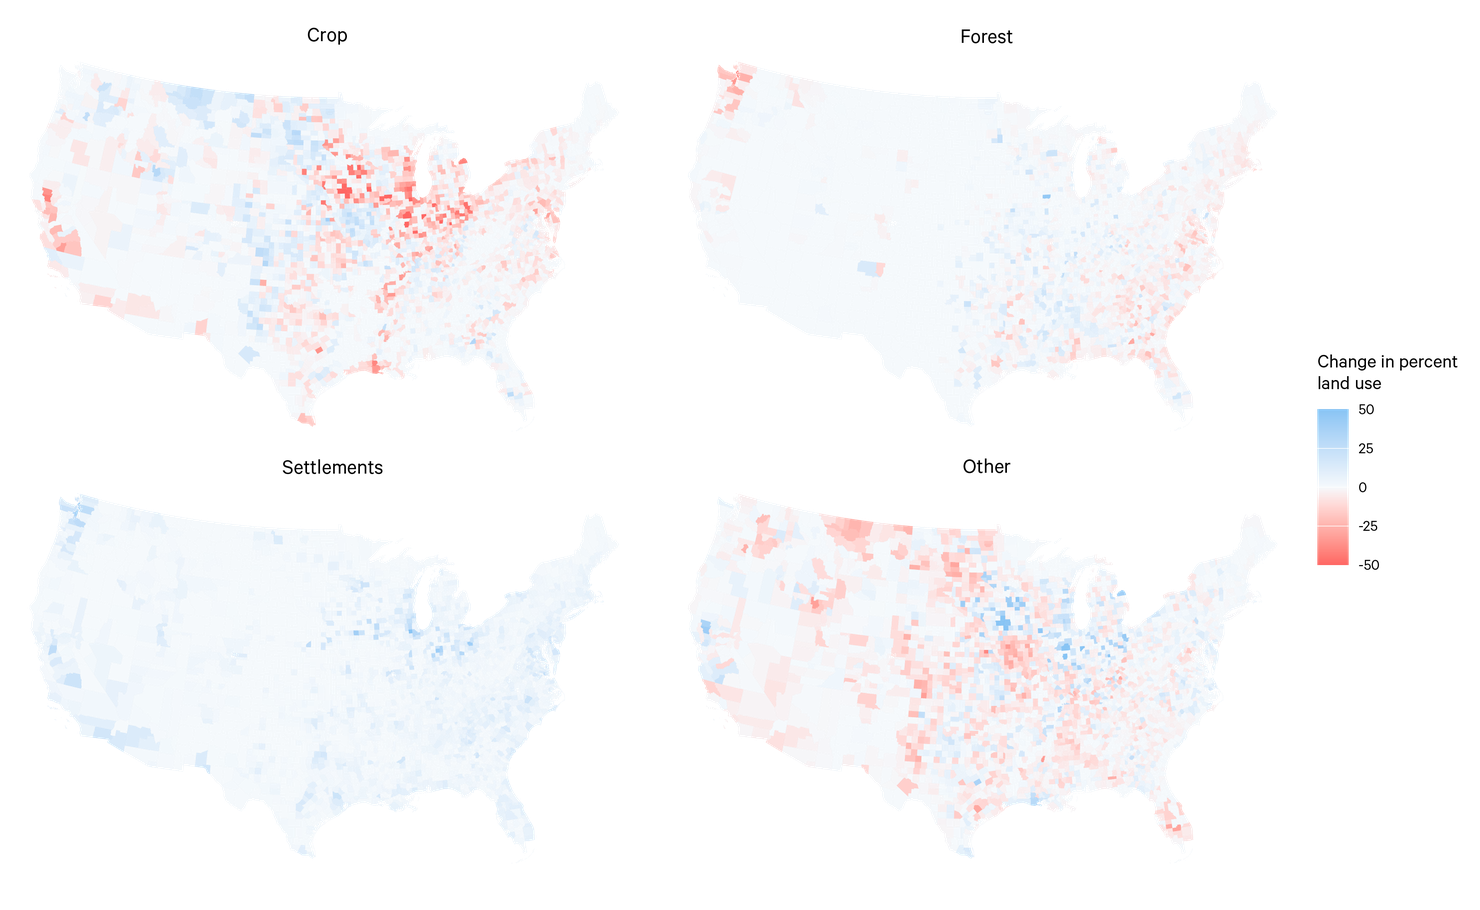
Under BAU, the land/forest sector removes 29.3 GT CO2eq or 0.73 GT CO2eq/year over the projection period, but the CDR rate declines steadily based on projected land use changes and the aging and disturbance of in situ forests (Figure 4). Most of the decline in CDR--from .81 GT CO2eq/year in 2022 to .64 GT CO2eq/year in 2062, a decline of 21 percent— is accounted for by slowing forest growth in planted forests of the Southeast and total forests in the North (because their area is small, we do not separately account for planted forests in the North). Still, CDR continues to be concentrated in the East, where forests are younger. These regions account for >90 percent of total CDR by 2062. In the West, land use change, forest age, and disturbances (especially fire) result in no net CDR (emissions are roughly equal to sequestration). An especially important change in the West is continued urbanization and net forest losses in the Pacific Northwest (Figure 4), where forest carbon density is especially high.
As forest CDR declines, the shares of CDR in the settlement land use and wood products carbon pools increase (Figure 4). Settlement CDR increases from .13 GT CO2eq/year in 2022 (17 percent of total CDR) to .16 GT CO2eq/year in 2062 (27 percent); wood product CDR remains constant by assumption (.09 GT CO2eq/year), but the share increases from 13 to 16 percent.
Figure 4. Historical (1990–2020) and Projected Land/Forest CDR (2022–2062) and B) Forest CDR by Region and Origin Class (2022–2062) under the BAU Scenario

4. Expanding CDR from the Land Sector
How might policy be used to expand the amount of future CDR from the BAU case? Among nature-based climate solutions, afforestation is seen as the most effective method (Fargione et al. 2018; Griscom et al. 2017). Although other management approaches could enhance CDR, potentially at a competitive cost, the potential scale is much lower. We use CALM to evaluate afforestation initiatives, accounting for forest dynamics across ecological settings and offsetting changes in sequestration from other land uses. We start by examining an afforestation program of 30 million acres over 10 years (3 million acres each year). A program of this scale has some precedent, roughly equivalent to the size of the USDA Conservation Reserve Program (CRP), which has removed 21–35 million acres of environmentally sensitive land from agricultural production in exchange for rental payments. We then simulate the effects of a more expansive program that would increase the area of forests by 90 million acres over 30 years (3 million acres each year).
Because forest productivity varies substantially nationwide, location of afforestation and subsequent management has implications for CDR outcomes. We simulate afforestation scenarios based on CALM, which predicts areas that are most likely to switch to forests based on historical patterns of change associated with differences in land use returns. We assume that new forests are established through planting in regions that have substantial planting activity (pines in the Southeast and Douglas fir in the Pacific Northwest). In other regions, we assume that forests are established through a natural regeneration of forest types proportional to their current regional distribution.
Figure 5. Projected Difference in Percent Land Use at End of Simulation Period for Afforestation Scenarios, by County.
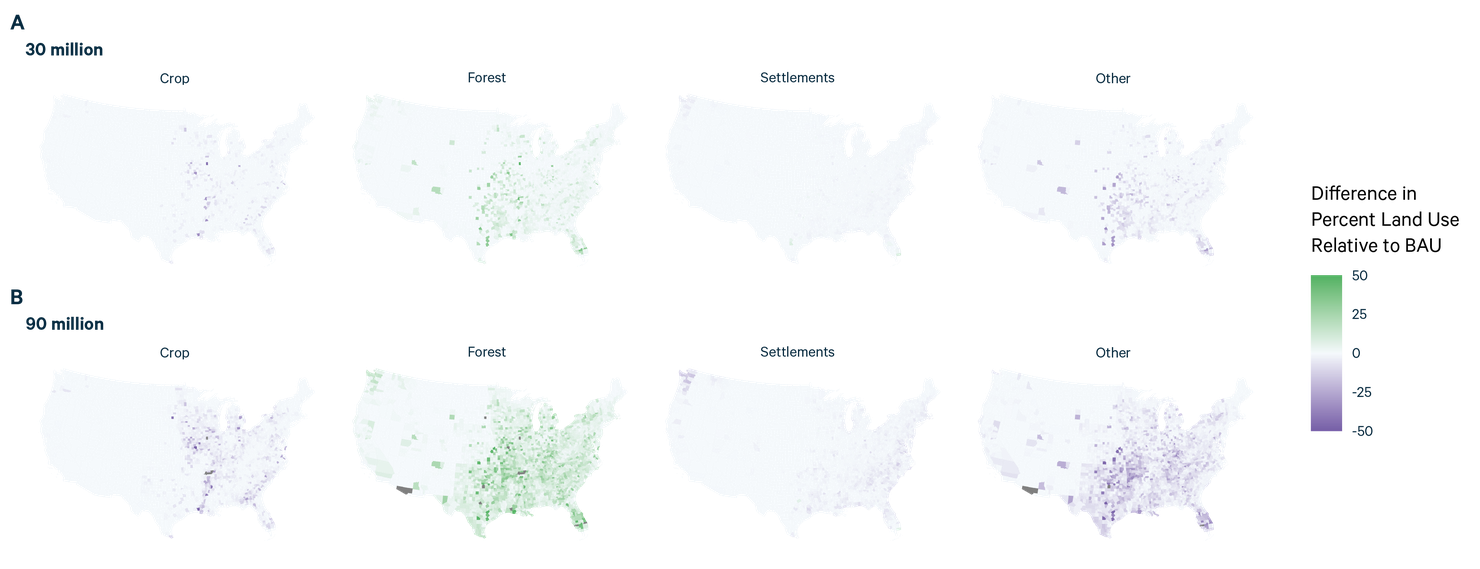
Figure 5 illustrates the differences between projected percentage land in each use in each scenario in 2062 and under the BAU scenario. Relative to BAU, both scenarios increase forestland, especially in the eastern Plains/Prairie Parkland and southeastern regions; most of this increased forestland displaces cropland and other uses. However, because the 30-million-acre program is brief, the initial increase in forestland scenario is muted by the end of the simulation period (Figure 5).
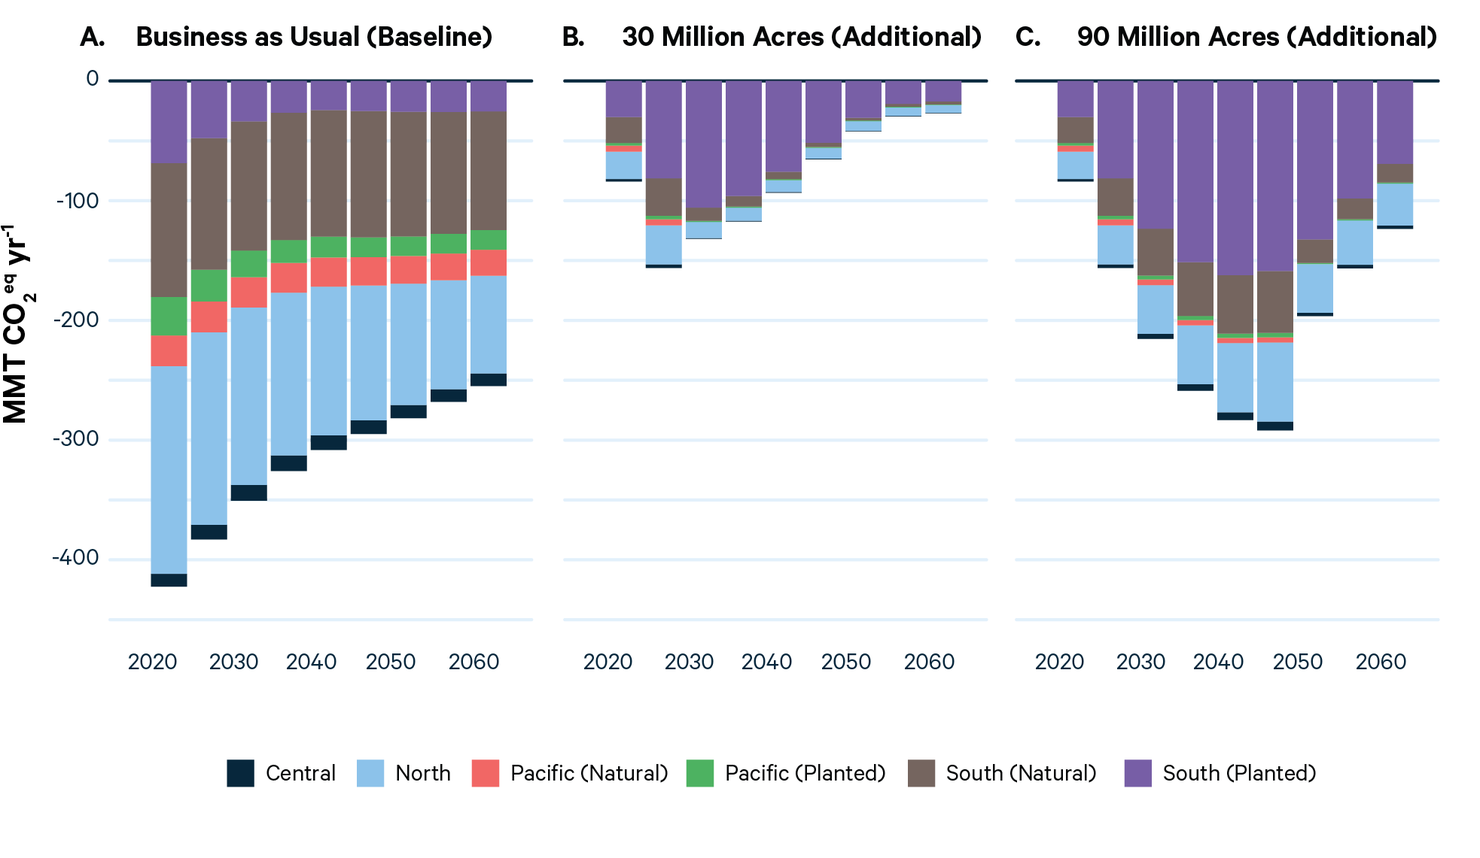
Over the simulation period, the 30-million-acre program generates an additional 3.6 GT CO2eq over BAU, for a total of 32.9 GT CO2eq (Figure 7). The resulting average rate of CDR is .82 GT CO2eq over the next 40 years, roughly equivalent to rates at the end of the historical period and 12 percent higher than BAU. The 90-million-acre program generates an additional 8.5 GT over BAU, for a total of 37.8 GT CO2eq. The resulting average rate of CDR is .95 GT CO2eq/year, which exceeds recent historical rates by about 16 percent and averages 30 percent higher than BAU. In both scenarios, a majority of added CDR occurs in the Southeast (80 percent), and 96 percent is in the East (Figure 7). Newly planted forests in the Southeast alone account for a majority of additional CDR (69 and 68 percent in the 30- and 90-million-acre scenarios, respectively), reflecting their rapid accumulation of biomass and carbon.
Figure 6. Historical and Projected Land/Forest CDR for Business-as-Usual and Two Afforestation Scenarios
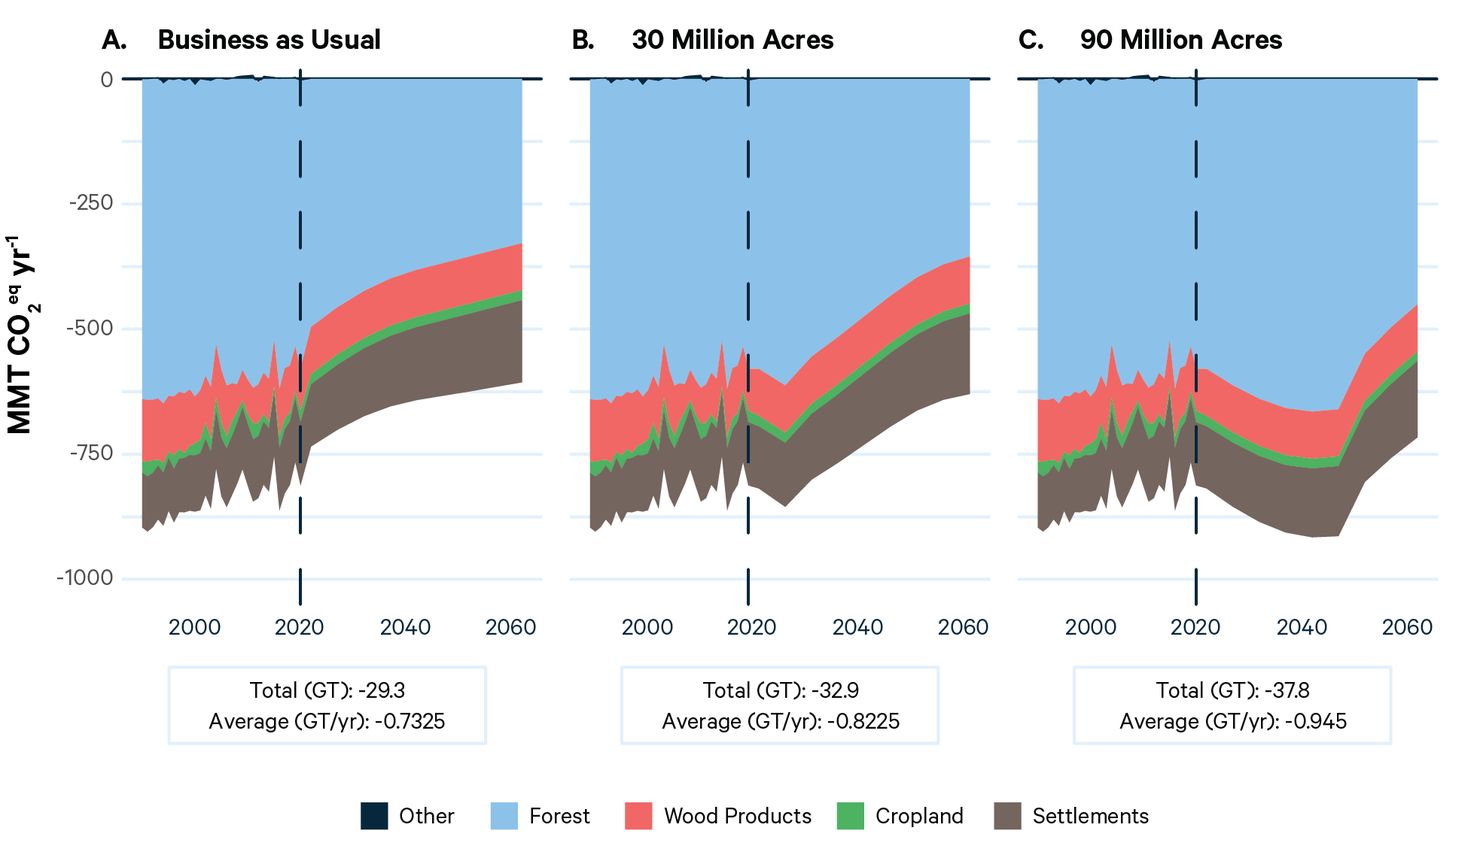
Figure 7. Business-as-Usual Forest CDR and Additional CDR Provided by Two Afforestation Scenarios by Region and Forest Origin Type
5. Discussion
CDR from land/forests is a key component of global and US climate change mitigation strategies. The US Long-Term Strategy (DOS 2021) and the 4th Biennial Report (US 2021) anticipate land providing substantial CDR in the future, and the strategy emphasizes the potential role of afforestation in building the sink. Both reports highlight the uncertainty around sink projections defined by the complexity of interactions between land use and biological growth components. For example, the Biennial Report projects a broad range of BAU CDR for 2035 (.63–.92 GT) based on a set of models. Our 2042 projection of .66 GT highlights the effects of forest aging and anticipated forest losses under our BAU scenario.
BAU results define a dynamic baseline for land/forest CDR with declining levels anticipated over the entire projection period. Our historical analysis shows that CDR over the past 30 years was boosted by an episodic change in wood products markets that accelerated afforestation, especially in the Southeast. CDR will remain important—at least 29.3 GT CO2 eq over the 40-year period—but rates will decline over time due to forest aging without ongoing afforestation. Our simulations indicate that afforestation could contribute a consequential amount of additional CDR—the 30- and 90-million-acre programs add 3.6 and 8.5 GT, respectively. The former brings projected CDR to levels observed over the past 10 years; the latter achieves levels approaching only the low case defined for the Long-Term Strategy (about 1 GT CO2 eq/year). Medium and high levels of CDR in the Long-Term Strategy would seem out of reach for the land/forest sector based on our analysis. If we doubled the 90-million-acre program (to about the area of Texas) and assumed the same incremental contribution to CDR (which is highly optimistic), then land/forest CDR would only rise to 1.2 GT/year, or 33 percent below the high level in the Long-Term Strategy.
Our prototypic afforestation programs range from the largest conservation program ever funded by the federal government (the CRP) to one three times that size. Implementation would be challenged by logistical factors, including the infrastructure required to deliver seedlings and labor availability. Both programs anticipate planting 3 million additional acres per year, which would more than double recent rates (2.3 million acres/year for 2011–2015) (Oswalt et al. 2019). The design of policy instruments to induce this level of afforestation on private lands represents another challenge and would influence program costs and benefit delivery. Tree planting subsidies alone can generate substantial leakage of benefits (Mei et al. 2022). Rental programs, such as the CRP, implemented with government funding or through voluntary offset markets could generate less leakage but would require substantially more oversight.
The costs of programs at this scale are difficult to estimate due to various market feedback and other factors (i.e., they require an understanding of how changes in land use affect changes in markets for products derived from land). If we assume a program structured like the CRP with annual rental payments to landowners, a rough estimate of total annual costs is $2–4 billion and $5–7 billion (2022$) for the 30- and 90-million-acre programs, respectively, assuming that rents are paid for the entire 40-year period (see Appendix for details). The implied average costs of additional CDR would be $17–41/T (which is comparable to other estimates for land CDR) (Cook-Patton et al. 2020). We estimate the benefits of additional CDR—based on recent estimates of the social cost of greenhouse gases (Rennert et al. 2022)—as $507 and $1,132 billion for the 30- and 90-million-acre programs, respectively; the associated benefit–cost ratios are 3.6–6.2—a very high return on investment also consistent with previous findings (Haight et al. 2020).
We focus exclusively on afforestation as an instrument to increase land/forest CDR but recognize that other activities, including wood products and settlement CDR, could contribute, albeit to a lesser degree. Our analysis holds wood products CDR constant at recent historical levels. Recent declines in per capita wood consumption coupled with slowing population growth suggest declining wood product carbon uptake, but new products and building techniques (mass timber, for example) suggest ways to expand this carbon sink. Projections indicate that settlement land uses will provide a growing portion of CDR—suggesting a need for a more thorough evaluation of potential in these areas. However, other approaches could increase the average carbon stocks of managed forests, especially extending harvest or rotation ages, and at relatively low costs.
Our simulations reveal that, due to aging forests, recent declines in CDR from land/forests are likely to continue well into the future. Therefore, expanding forests is necessary to maintain land carbon sink strength and meet the nation’s climate goals. Until other technologies for CDR develop and potentially become scalable at competitive costs, afforestation provides the only viable approach to enhancing CDR toward levels anticipated by the US Long-Term Strategy and the IPCC’s global pathways to 1.5°C warming, but it would not be enough to attain the strategy’s goals. Substantial investments in novel technologies and land/forest sequestration will be required.